Randomized Controlled Trial
. 2023 Mar 17;9(11):eade6675.
doi: 10.1126/sciadv.ade6675. Epub 2023 Mar 15.

The BAF complex inhibitor pyrimethamine reverses HIV-1 latency in people with HIV-1 on antiretroviral therapy

Affiliations
Randomized Controlled Trial

The BAF complex inhibitor pyrimethamine reverses HIV-1 latency in people with HIV-1 on antiretroviral therapy

Henrieke A B Prins et al. Sci Adv. .

Abstract

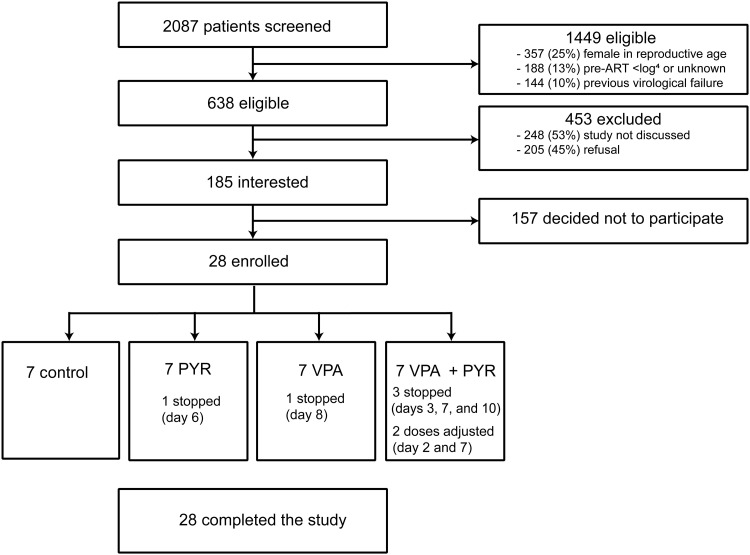
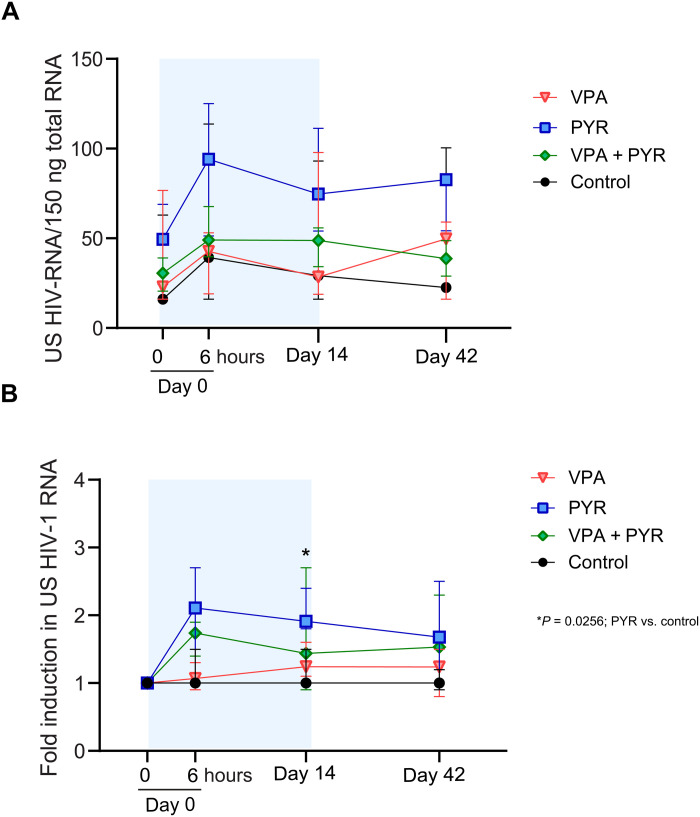
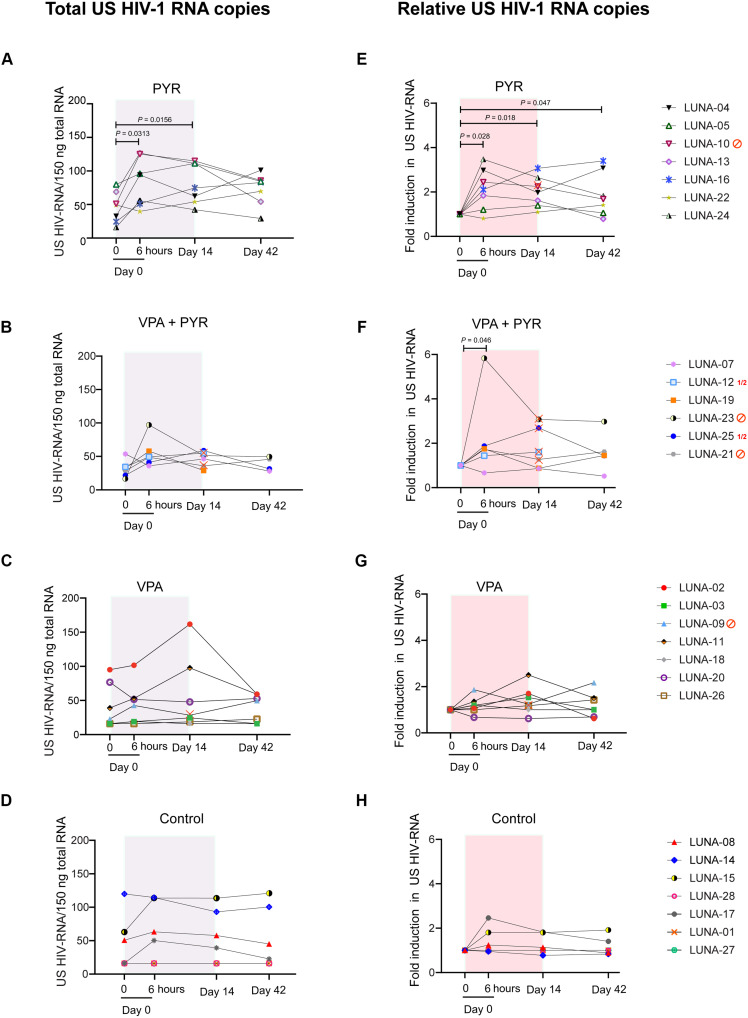
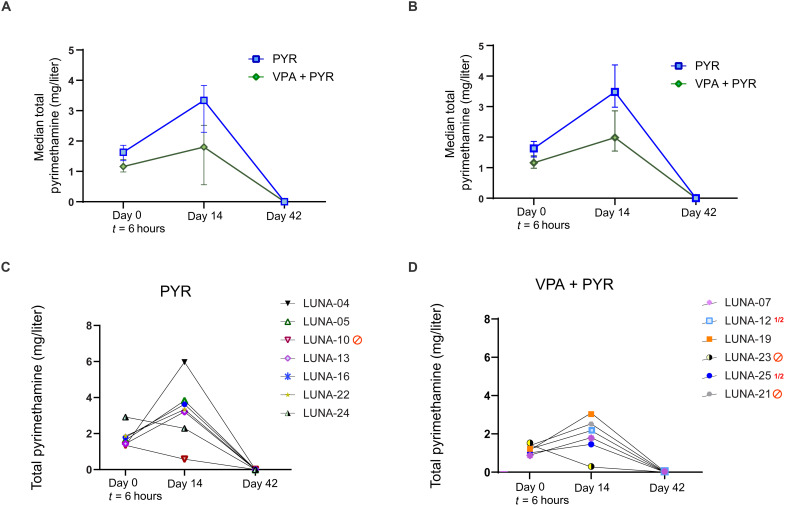
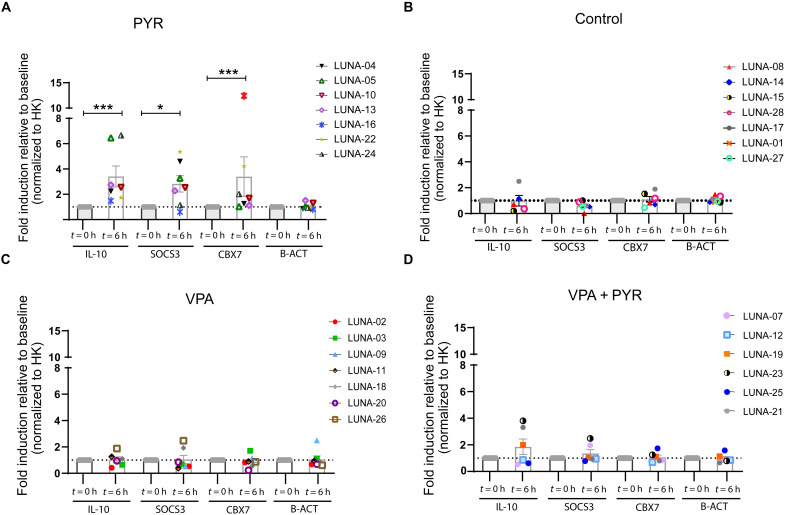
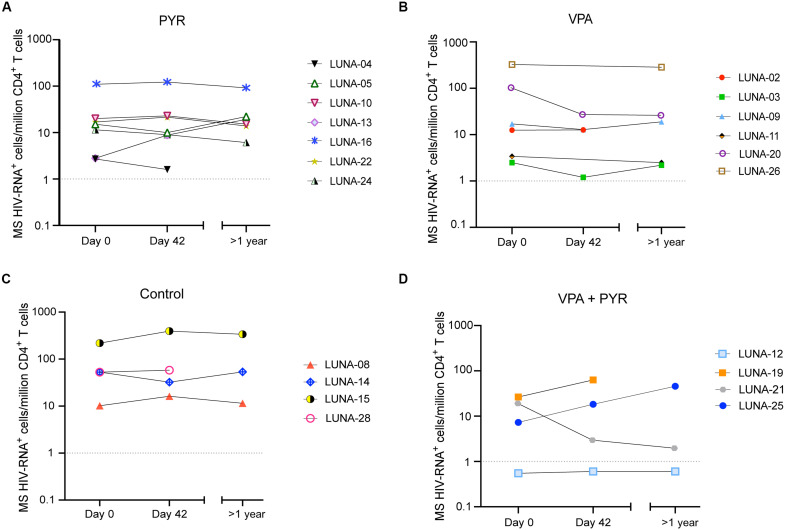
Reactivation of the latent HIV-1 reservoir is a first step toward triggering reservoir decay. Here, we investigated the impact of the BAF complex inhibitor pyrimethamine on the reservoir of people living with HIV-1 (PLWH). Twenty-eight PLWH on suppressive antiretroviral therapy were randomized (1:1:1:1 ratio) to receive pyrimethamine, valproic acid, both, or no intervention for 14 days. The primary end point was change in cell-associated unspliced (CA US) HIV-1 RNA at days 0 and 14. We observed a rapid, modest, and significant increase in (CA US) HIV-1 RNA in response to pyrimethamine exposure, which persisted throughout treatment and follow-up. Valproic acid treatment alone did not increase (CA US) HIV-1 RNA or augment the effect of pyrimethamine. Pyrimethamine treatment did not result in a reduction in the size of the inducible reservoir. These data demonstrate that the licensed drug pyrimethamine can be repurposed as a BAF complex inhibitor to reverse HIV-1 latency in vivo in PLWH, substantiating its potential advancement in clinical studies.


Figures

Fig. 1.
Fig. 1.. Study flow diagram showing the information about the method of recruitment and the number of participants that completed the LUNA study.
Miscellaneous category for ineligibility covers not fitting the other study inclusion and exclusion criteria, clinical judgment of treating physician, and study not discussed. ART, antiretroviral therapy; PYR, pyrimethamine.
Fig. 2.
Fig. 2.. Changes in CA HIV-1 US RNA per arm at four time points during the LUNA study.
(A) Median (IQR) total CA US HIV-1 RNA per 150 ng of total RNA in all four study arms at treatment initiation (day 0, t = 0 hours) and 6 hours after first dosing (day 0 t = 6 hours), at the end of the treatment period (day 14), and 28 days after the end of treatment (day 42). (B) Median (IQR) fold change in CA US HIV-1 RNA in all four study arms relative to baseline (day 0, t = 0 hours). * indicates the effect comparisons at the time points of the treatment arms compared to controls with P < 0.05.
Fig. 3.
Fig. 3.. Changes in CA HIV-1 US RNA per participant per arm at four time points during the LUNA study.
(A to D) Graphs represent absolute CA US HIV-1 RNA copies in all participants from the pyrimethamine (A), pyrimethamine with VPA (B), VPA (C), and control (D) arms at treatment initiation (day 0, t = 0 hours) after 6 hours after the first dosing (day 0, t = 6 hours), at the end of treatment period (day 14), and 28 days after the end of treatment (day 42). (E to H) Graphs represent fold induction of CA US HIV-1 RNA at different study time points compared to baseline (day 0, t = 0) in all participants from the pyrimethamine (E), pyrimethamine with VPA (F), VPA (G), and control (H) arms at the same time points. A total of 1.5 million CD4+ T cells were isolated from peripheral blood mononuclear cells, lysed in triplicate, followed by total RNA isolation and reverse transcription. Total copies of CA US HIV-1 RNA were quantified by nested qPCR. The gray/red boxes represent treatment duration. Participants that stopped study medication or had dose adjustments are indicated with either a red stop sign or red ½ symbol and a red cross on the individual points in the graph. In both the VPA arm and the pyrimethamine arm, one participant stopped their study medication on day 8 (LUNA-09) and day 6 (LUNA-10), respectively. In the combination treatment arm, three participants stopped both compounds (LUNA-23 on day 3, LUNA-06 on day 7, and LUNA-21 on day 10), and two participants had their dosage adjusted (LUNA-25 had VPA dose halved from day 2 on, pyrimethamine dose halved from day 7 on, and LUNA-12 had pyrimethamine dose halved from day 7 on). P values below 0.05 are indicated. Statistical significance was calculated using Wilcoxon signed-rank tests.
Fig. 4.
Fig. 4.. Pharmacokinetics of the drug pyrimethamine in study participants.
(A and B) Pharmacokinetic analysis of the drug pyrimethamine in study participants from pyrimethamine (blue) and the combination treatment arm with pyrimethamine and VPA (green) as measured by median total pyrimethamine (mg/liter) levels in plasma with IQRs at 6 hours after first dosing (day 0, t = 6 hours), at the end of treatment period (day 14), and 28 days after the end of treatment (day 42) overall (A) and in those with uninterrupted pyrimethamine exposure (B) and represented as plasma pyrimethamine levels at the time points per individual on pyrimethamine (C) or the combination treatment with pyrimethamine and VPA (D).
Fig. 5.
Fig. 5.. Pharmacodynamics of the drug pyrimethamine in study participants.
(A to D) Gene expression profile of BAF complex molecular targets IL-10, SOCS3, and CBX7 in all participants from pyrimethamine (A), control (B), VPA (C), and the combination treatment arm with pyrimethamine and VPA (D) at 6 hours after first dosing (day 0, t = 6 hours). Graphs represent mean (SEM) fold induction relative to pretreatment level (day 0, t = 0 hours). Cyclophilin A was used as a housekeeping (HK) gene for normalization, and β-actin (B-ACT) was used as a control. P values were calculated using Mann-Whitney U test with * representing P < 0.05 and *** representing P < 0.01.
Fig. 6.
Fig. 6.. Effect of the intervention regimen on the HIV-1 inducible reservoir size.
(A to D) Graphs represent measurements of inducible reservoir size in samples obtained from participants from pyrimethamine (A), VPA (B), control (C), and the combination treatment arm with pyrimethamine and VPA (D) at treatment initiation (day 0, t = 0 hours), 28 days after the end of treatment (day 42), and >1 year after the end of treatment. Isolated CD4+ T cells were activated ex vivo with PMA/ionomycin for 12 hours, and the frequency of CD4+ T cells expressing MS HIV-1 RNA was determined using a TILDA. The dotted horizontal line represents the assay limit of detection.

References

    1. Chun T. W., Engel D., Berrey M. M., Shea T., Corey L., Fauci A. S., Early establishment of a pool of latently infected, resting CD4+ T cells during primary HIV-1 infection. Proc. Natl. Acad. Sci. U.S.A. 95, 8869–8873 (1998). - PMC - PubMed
    1. Chun T. W., Davey R. T. Jr., Ostrowski M., Shawn Justement J., Engel D., Mullins J. I., Fauci A. S., Relationship between pre-existing viral reservoirs and the re-emergence of plasma viremia after discontinuation of highly active anti-retroviral therapy. Nat. Med. 6, 757–761 (2000). - PubMed
    1. Strategies for Management of Antiretroviral Therapy (SMART) Study Group, El-Sadr W. M., Lundgren J., Neaton J. D., Gordin F., Abrams D., Arduino R. C., Babiker A., Burman W., Clumeck N., Cohen C. J., Cohn D., Cooper D., Darbyshire J., Emery S., Fatkenheuer G., Gazzard B., Grund B., Hoy J., Klingman K., Losso M., Markowitz N., Neuhaus J., Phillips A., Rappoport C., CD4+ count–guided interruption of antiretroviral treatment. N. Engl. J. Med. 355, 2283–2296 (2006). - PubMed
    1. Deeks S. G., Shock and kill. Nature 487, 439–440 (2012). - PubMed
    1. Deeks S. G., Archin N., Cannon P., Collins S., Jones R. B., de Jong M., Lambotte O., Lamplough R., Ndung'u T., Sugarman J., Tiemessen C. T., Vandekerckhove L., Lewin S. R.; The International AIDS Society (IAS) Global Scientific Strategy working group , Research priorities for an HIV cure: International AIDS Society Global Scientific Strategy 2021. Nat. Med. 27, 2085–2098 (2021). - PubMed

Publication types