. 2023 Mar 17;9(11):eade2175.
doi: 10.1126/sciadv.ade2175. Epub 2023 Mar 15.

A hotspot for posttranslational modifications on the androgen receptor dimer interface drives pathology and anti-androgen resistance

Affiliations

A hotspot for posttranslational modifications on the androgen receptor dimer interface drives pathology and anti-androgen resistance

Andrea Alegre-Martí et al. Sci Adv. .

Abstract

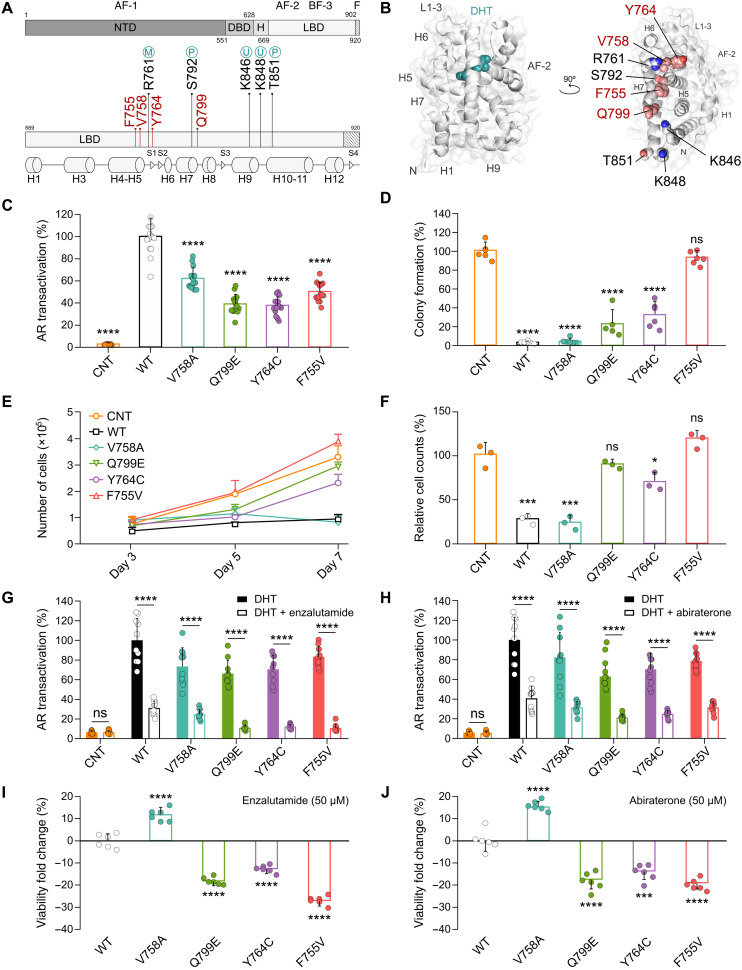
Mutations of the androgen receptor (AR) associated with prostate cancer and androgen insensitivity syndrome may profoundly influence its structure, protein interaction network, and binding to chromatin, resulting in altered transcription signatures and drug responses. Current structural information fails to explain the effect of pathological mutations on AR structure-function relationship. Here, we have thoroughly studied the effects of selected mutations that span the complete dimer interface of AR ligand-binding domain (AR-LBD) using x-ray crystallography in combination with in vitro, in silico, and cell-based assays. We show that these variants alter AR-dependent transcription and responses to anti-androgens by inducing a previously undescribed allosteric switch in the AR-LBD that increases exposure of a major methylation target, Arg761. We also corroborate the relevance of residues Arg761 and Tyr764 for AR dimerization and function. Together, our results reveal allosteric coupling of AR dimerization and posttranslational modifications as a disease mechanism with implications for precision medicine.


Figures

Fig. 1.
Fig. 1.. Mutations at the AR-LBD dimer interface affect cellular phenotypes, transcriptional activity, and response to antiandrogens.
(A) Cartoon of AR domain organization. Physiologically relevant interaction sites [top; activation function-1 (AF-1), AF-2 and binding function-3 (BF-3)], mutated AR-LBD residues (red; middle), and secondary structure elements [bottom; helices (H, cylinders) and β strands (S1 to S4, triangles)] are indicated. Neighboring residues of major PTM sites are shown [methylation (M), phosphorylation (P), and ubiquitination (U)]. (B) Three-dimensional structure of AR-LBD (gray). Note that disease-linked residues (red spheres) and PTM sites (gray spheres) highlighted in (A) form an extended path on the AR-LBD dimer interface. (C) Relative AR transcriptional activity in CNT, WT, and mutant AR-transduced PC3 cells (mean ± SD, n = 3). Differences against WT were calculated using a t test and considered significant at P values <0.1. (#P < 0.1 *P < 0.05, **P < 0.01, ***P < 0.001, and ****P < 0.0001). The same P value guidelines and asterisk significance will be used through this manuscript. (D) Clonogenicity assay quantification in transduced PC3 cells (mean ± SD, n = 3). Representative crystal violet–stained cultures are shown in fig. S1A. (E) Time course of transduced PC3 cells proliferation (mean ± SD, n = 3). Proliferation is completely suppressed with WT AR or V785A but no other mutants. (F) Relative cell counts at day 7 after transduction. (G and H) Effect of anti-androgens on the relative AR transcriptional activity of transduced PC3 cells (mean ± SD, n = 5). (I and J) Viability fold change in response to anti-androgens in transduced cells relative to the CNT cells (mean ± SD, n = 3). Differences against CNT (D and F) between anti-androgen treated and nontreated cells (G and H) or against WT (I and J) were calculated using t tests. ns, not significant.
Fig. 2.
Fig. 2.. The transcriptional profiles of AR-LBD dimerization surface mutants differ from that of the WT receptor.
The results of RNA-seq experiments conducted in triplicate for each cell line are summarized. (A) Differential expression analysis between CNT and AR-transduced cells. Genes with |log2(fold change)| ≥ 1 and P ≤ 0.05 are shown in red. (B) GSEA demonstrates similar signatures of WT and mutant AR. (C) Differentially expressed genes overlap between WT AR and its mutants. The bar plot (top) indicates the number of genes in the intersection between signatures. Vertical lines (bottom) connect the corresponding overlapping signatures. For each WT and mutant AR, signatures are separately given for up- (U) and down-regulated genes (D), and the size of the gene set is indicated (right). (D and E) Principal component analysis (PCA) and heatmap analysis of transcription profiles identifies three groups: (i) CNT, (ii) V785A and WT, and (iii) F755V, Y764C, and Q799E. (F) Volcano plots of AR target genes for WT and mutant AR. Canonical repressed (blue) and activated (red) AR targets are labeled. Note that repression of genes such as MYC, SOX4, FOXA1, and CDH2 is lost in Q799E, Y764C, and F755V but not in V785A. (G) GSEA of the mutant AR signatures against WT AR on prostate cancer gene sets. Note that the V758A signature shows very limited overall enrichment indicating its strong similarity with WT. (H) GSEA of WT and mutant AR against a previously defined PCa malignancy signature (58). Enrichment for up- and down-regulated targets of the malignancy signature drivers forkhead box protein M1 (FOXM1), Centromere Protein F (CENPF), or both are shown separately. Only the F755V, Y764C, and Q799E signatures are enriched in the FOXM1 and/or CENPF regulons. Normalized enrichment score (NES) scale and false discovery rate (FDR) P value thresholds are indicated.
Fig. 3.
Fig. 3.. High-resolution crystal structures of AR-LBD dimer interface mutants reveal local and long-range conformational changes.
(A) Superimposition of current crystal structures of mutant AR-LBD on WT monomeric (1T7T) and dimeric (5JJM) forms of the domain. Secondary structure elements identical in all structures are depicted as a gray cartoon, with DHT as teal spheres and the AF-2-bound peptide (from 5JJM) in red. Large main- and/or side chain conformational changes cluster in four areas (B to E), highlighted by the major secondary structure elements (coral sticks). (B) Dimer interface core lined by H5 and H7, which, in addition to the studied point mutations [Phe755 and Val758 (H5), Tyr764 (S1), and Gln799 (H7)] features mostly residues with nonpolar/aromatic side chains, along with the positively charged Arg761. (C) The more distal part of the dimer interface formed by H3 and L1-3 [Tyr774 and His777 from (B) are shown for orientation]. In this area, several polar residues exhibit noticeable conformational changes. (D) BF-3 pocket, where multiple residues exhibit conformational changes, most notably those from H9. (E) AF-2 pocket, where in addition to the charge-clamp residues, Lys721 and Glu894, known to stabilize bound coregulators at this interaction site, the side chains of both charged (Lys718, Arg727, Lys823, and Glu898) and aliphatic residues (Met735 and Met895) display conformational variability. (F) Sector 1 (teal) comprises 17 residues in and around H5, H7, H8, H9, and H10-11 (Met743, Phe748, Gly751, Arg753, Leu798, Ile800, Thr801, Met808, Leu811, Phe814, Glu838, Ile842, Thr851, Tyr858, Thre861, Lys862, and Leu864), whereas sector 2 (green) features 20 residues mostly from H3, H5, H7, H8, S3, and H10-11 (Arg711, Leu713, Trp719, Ala720, Lys721, Phe726, Leu729, Gln734, Tyr739, Trp742, Gly744, Met746, Ala749, Trp752, Ser754, Leu791, Lys809, Leu813, Asp820, and Arg856). Last, three residues (Gly725 and Ile738 at the AF-2 groove and Phe805 at H7) belong to both sectors (yellow).
Fig. 4.
Fig. 4.. AR-LBD dimer interface mutants display local flexibility differences.
(A to G) Visualization of protein mobility for WT and AR-LBD mutant proteins. Proteins are represented as ribbons sized by temperature factors (B-factors) and colored according to the average B-factors of each residue (i.e., areas with larger atomic displacements appear thicker and are depicted with warmer colors (red, orange, and yellow), whereas those with lower thermal motion are shown thinner and with cold colors (green, blue, and violet). DHT molecules bound inside the LBP pockets are shown as gray spheres with oxygen atoms in red. WT AR-LBD·DHT monomer (A, PDB 1T7T) and dimer (B, PDB 5JJM) are shown for comparison. Note that all mutants exhibit a larger mobility than WT AR-LBD.
Fig. 5.
Fig. 5.. Molecular dynamics study of the WT and mutant AR-LBD structures demonstrate overall domain stability coupled with local changes in flexibility.
(A) Evolution of the RMSD for WT AR-LBD and the studied mutants along four independent MD runs. All structures converge demonstrating global structural stability. (B) Averaged RMSF of the four MD runs calculated for each structure: WT AR-LBD (black), V758A (blue), Y764C (purple), Q799E (green), F755L (violet), and F755V (red) (top plot). The remaining plots show the differences between the WT and mutant RMSF values. Residues with RMSF values higher than +2σ or lower than −2σ (indicating decreased or increased flexibility compared to WT, respectively) are labeled. Only changes with values greater than twice their SDs were considered significant (red lines). Major changes in flexibility around the mutation site were detected only for the V758A mutant. Mutant F755V only shows a small change in this region, while Q799E does not present any changes near the mutated residue but around Asn759 instead, in line with the experimental structure. Note that flexibility in the L5-S1 loop is remarkably higher in V758A, F755V, and Q799E compared to WT (blue). On the contrary, the C-terminal end of H10-11 shows lower relative flexibility in all the mutants. (C) Plots of the differences in average pairwise distances (ΔR¯ij), with ΔR¯ij=R¯ij,WTR¯ij,mut, being R¯ij,WT and R¯ij,mut the average distances between Cα atoms of residues i and j along the MD trajectories of the WT and mutated structures, respectively. Red and blue represent positive and negative ΔR¯ij values, corresponding to residue pairs whose average distances decrease or increase due to the mutation, respectively. Only residue pairs with ΔR¯ij > 2.50 or < −1.40, which represent the most significant distance changes, are shown.
Fig. 6.
Fig. 6.. Point mutations at the AR-LBD dimer interface do not impair homodimer formation, which is even enhanced in the Tyr764Cys mutant.
(A) SDS-PAGE analysis of WT and mutant AR-LBD samples treated with the bifunctional cross-linkers, BMOE or BMB. Note similar intensities of bands corresponding to dimeric AR-LBD in all cases, indicating that homodimer formation is not compromised by any of the studied point mutants. (B) Representative MS/MS spectra identifying BMB-cross-linked tryptic peptides between Cys764 residues from two LBD monomers. (C) Three-dimensional structure of the AR-LBD dimer (PDB 5JJM) in surface representation. Selected interface residues of both monomers [Cys687, Tyr764, and Phe755 (as reference)] are shown as sticks. The DHT molecule is depicted as salmon spheres. (D) SDS-PAGE analysis of AR-LBD(Y764C) behavior under reducing (lanes 2 and 4, +DTT) and nonreducing conditions (lanes 3 and 5, −DTT). Note the spontaneous dimerization in solution when the protein is incubated under nonreducing conditions. (E) Representative MS/MS spectra demonstrating formation of a disulfide bridge between mutant Cys764 residues from two LBD monomers. m/z stands for mass/charge ratio.
Fig. 7.
Fig. 7.. The R761 zone undergoes large conformational rearrangements in AR-LBD point mutants.
(A) Surface and cartoon representation of the AR-LBD·DHT dimer (PDB 5JJM). Residues comprising the core dimer interface are shown as color-coded sticks (oxygen, red; nitrogen, blue; carbon, teal or sky blue). (B) Close-up of the core dimer interface. Interface residues are shown as sticks and labeled. Major interdomain hydrogen bonds are represented as orange dotted lines. (C to H) Close-ups of the R761 zone in the crystal structures of mutant AR-LBD (teal-colored cartoons). The closest crystal neighbor is also shown in all cases (colored dark gray), to highlight major interactions due to the crystal packing. Residues involved in the crystal contacts are represented as color-coded sticks. Note the tighter contacts involving the Arg761 side chain in mutants F755V (F), F755L (G), and Q799E (H) compared to WT (C), V758A (D), and Y764C (E), most notably salt bridges with the Asp829 carboxylate from the neighboring monomer. Distances between the posttranslationally modifiable residues, Arg761 and Ser792, and from both of them to the reference residue, Trp797, are also given.
Fig. 8.
Fig. 8.. Arg761 is more solvent exposed in pathological AR mutations affecting on arginine methylation of the full-length receptor.
(A to F) Surface representation of the AR-LBD pocket spanned by residues Trp752 and Phe755-Val758 (H5), Tyr764 (S1), Arg789-Gln793, Trp797, and Gln799 (H7) and Asn759-Arg761 (loop H5-S1). All residues are shown as teal spheres superimposed by a gray surface to highlight the pocket topography. Note that conformational changes of Arg761 (labeled in red) and surrounding residues remodel this pocket thus increasing solvent accessibility of Ser792 (salmon), a key phosphorylation site by AKT kinase nested at its bottom. (G) Simplified cartoon representation of the Arg761 zone depicting the major displacement of Arg761 triggered by the dimerization mutants (different shades of red) relative to the WT position (gray). The pathological mutations induce a dislodgement of loop H5-S1, best appreciated by the different conformations adopted by the Arg761 side chain: from an intermediate state in V758A and Y764C (dark red, facing the viewer) to a right-oriented, more solvent-exposed position in F755V, F755L and Q799E (in salmon). (H) Western blot analysis of total and monomethylated FL AR fractions in PC3 cell lines expressing transduced WT or point mutants of the receptor. L, total lysate; IP, immunoprecipitated fraction. A monoclonal antibody that specifically recognizes monomethylated arginine residues was used for WB. Monomethylated AR bands were double normalized against the total IP AR and against the monomethylated WT AR band (= 1.00), so that monomethylation levels of AR mutants are not biased by the amount of immunoprecipitated proteins. (I) Relative expression levels of WT and mutant AR-LBD recombinant domains in BL21 Escherichia coli cells.
Fig. 9.
Fig. 9.. AR is preferentially monomethylated in living cells by the PRMT5·MEP50 complex.
(A) Representative PLA images demonstrating AR·PRMT5 physical interactions (red dots). Nuclei were counterstained with 4′,6-diamidino-2-phenylindole (DAPI; blue). PRMT5-silenced cells (si-PRMT5) were compared to nonsilenced cells (si-NS). (B) Quantified PRMT5-AR interactions are shown (mean ± SEM, n = 3). Differences between si-PRMT5 and si-NS cells were calculated using a t test. (C) Whole-cell extracts from (A) were analyzed and quantified for AR, PRMT5, and tubulin expression by immunoblot. (D) Representative images from AR methylation assessed using PLA with anti-AR and pan-methyl antibodies recognizing mono- (MMA) or symmetrically dimethylated arginine residues (SDMA). Red dots correspond to detected MMA and SDMA WT AR, and nuclei counterstained with DAPI (blue). A PRMT5-specific inhibitor was used to verify that the methylation signal was PRMT5-dependent. (E) The number of detected MMA/AR and SDMA/AR is shown (mean ± SEM, n = 3). Differences between catalytically active and inhibited PRMT5 cells were calculated using a t test. (F) Whole-cell extracts from (D) were analyzed and quantified for total AR, MMA-, and SDMA-protein patterns and tubulin expression by immunoblot. Note that, while SDMA can be mediated only by PRMT5 and PRMT9, MMA can be catalyzed by type I and II PRMTs. This explains the larger impact of the PRMT5-specific inhibitor on the SDMA fraction. (G) Model of AR-LBD(Q799E) approaching the active site of the PRMT5·MEP50 methylosome. For simplicity, only a heterotetrameric (PRMT5)2·(MEP50)2 complex is shown (PDB 4GQB). Note that folded substrates such as AR-LBD would interact with two neighboring catalytic subunits, in addition to NTD-MEP50 and DBD-PRMT5 contacts. (H) Diagram of putative interactions between AR domains and the methylosome. (I) Summary of PTMs affecting the AR-LBD. Note that PRMT5 regulates the cascade at different levels, including epidermal growth factor receptor (EGFR/HER1), protein kinase B (AKT), and AR. Phosphorylation (yellow), methylation (blue), and ubiquitination (green) pathways are shown: insulin-like growth factor 1 (IGF-I), insulin-like growth factor 1 receptor (IGF-1R), epidermal growth factor (EGF), epidermal growth factor receptor (HER1, 2 or 3), phosphoinositide 3-kinase (PI3K), mitogen-activated protein kinase 4 (MAPK4), aurora kinase A (AURKA), clonal hematopoiesis of indeterminate potential (CHIP), ring finger protein 6 (RNF6), checkpoint kinase 2 (CHK2), proto-oncogene serine/threonine-protein kinase (PIM-1) and E3 ubiquitin-protein ligase (Siah2).

References

    1. W. D. Tilley, C. M. Wilson, M. Marcelli, M. J. McPhaul, Androgen receptor gene expression in human prostate carcinoma cell lines. Cancer Res. 17, 5382–5386 (1990). - PubMed
    1. E. Estébanez-Perpiñá, C. L. Bevan, I. J. McEwan, Eighty years of targeting androgen receptor activity in prostate cancer: The fight goes on. Cancers 13, 509 (2021). - PMC - PubMed
    1. A. Jiménez-Panizo, P. Pérez, A. M. Rojas, P. Fuentes-Prior, E. Estébanez-Perpiñá, Non-canonical dimerization of the androgen receptor and other nuclear receptors: Implications for human disease. Endocr. Relat. Cancer 26, R479–R497 (2019). - PubMed
    1. X. Yu, P. Yi, R. A. Hamilton, H. Shen, M. Chen, C. E. Foulds, M. A. Mancini, S. J. Ludtke, Z. Wang, B. W. O’Malley, Structural insights of transcriptionally active, full-length androgen receptor coactivator complexes. Mol. Cell 79, 812–823.e4 (2020). - PMC - PubMed
    1. P. L. Shaffer, A. Jivan, D. E. Dollins, F. Claessens, D. T. Gewirth, Structural basis of androgen receptor binding to selective androgen response elements. Proc. Natl. Acad. Sci. U.S.A. 101, 4758–4763 (2004). - PMC - PubMed

Substances