. 2023 Mar;3(3):e713.
doi: 10.1002/cpz1.713.

Interpreting Image-based Profiles using Similarity Clustering and Single-Cell Visualization

Affiliations

Interpreting Image-based Profiles using Similarity Clustering and Single-Cell Visualization

Fernanda Garcia-Fossa et al. Curr Protoc. 2023 Mar.

Abstract

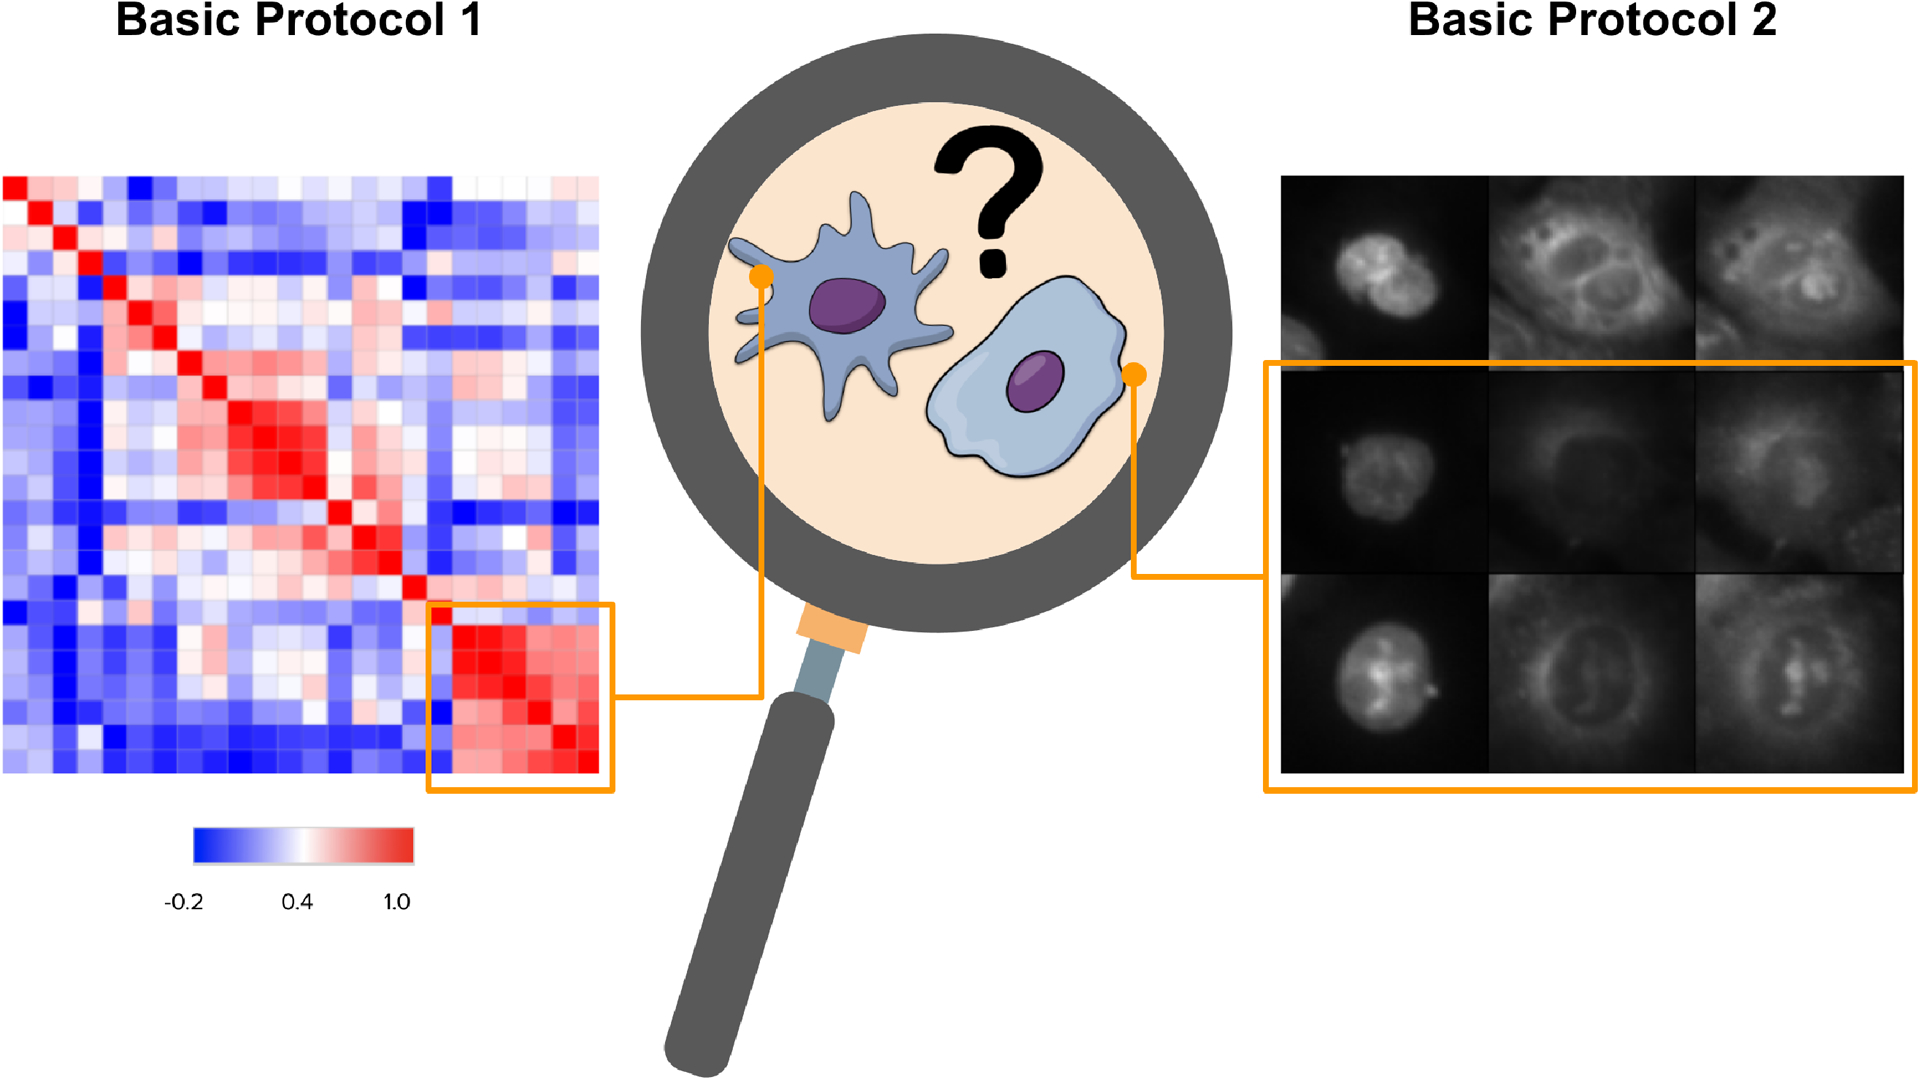
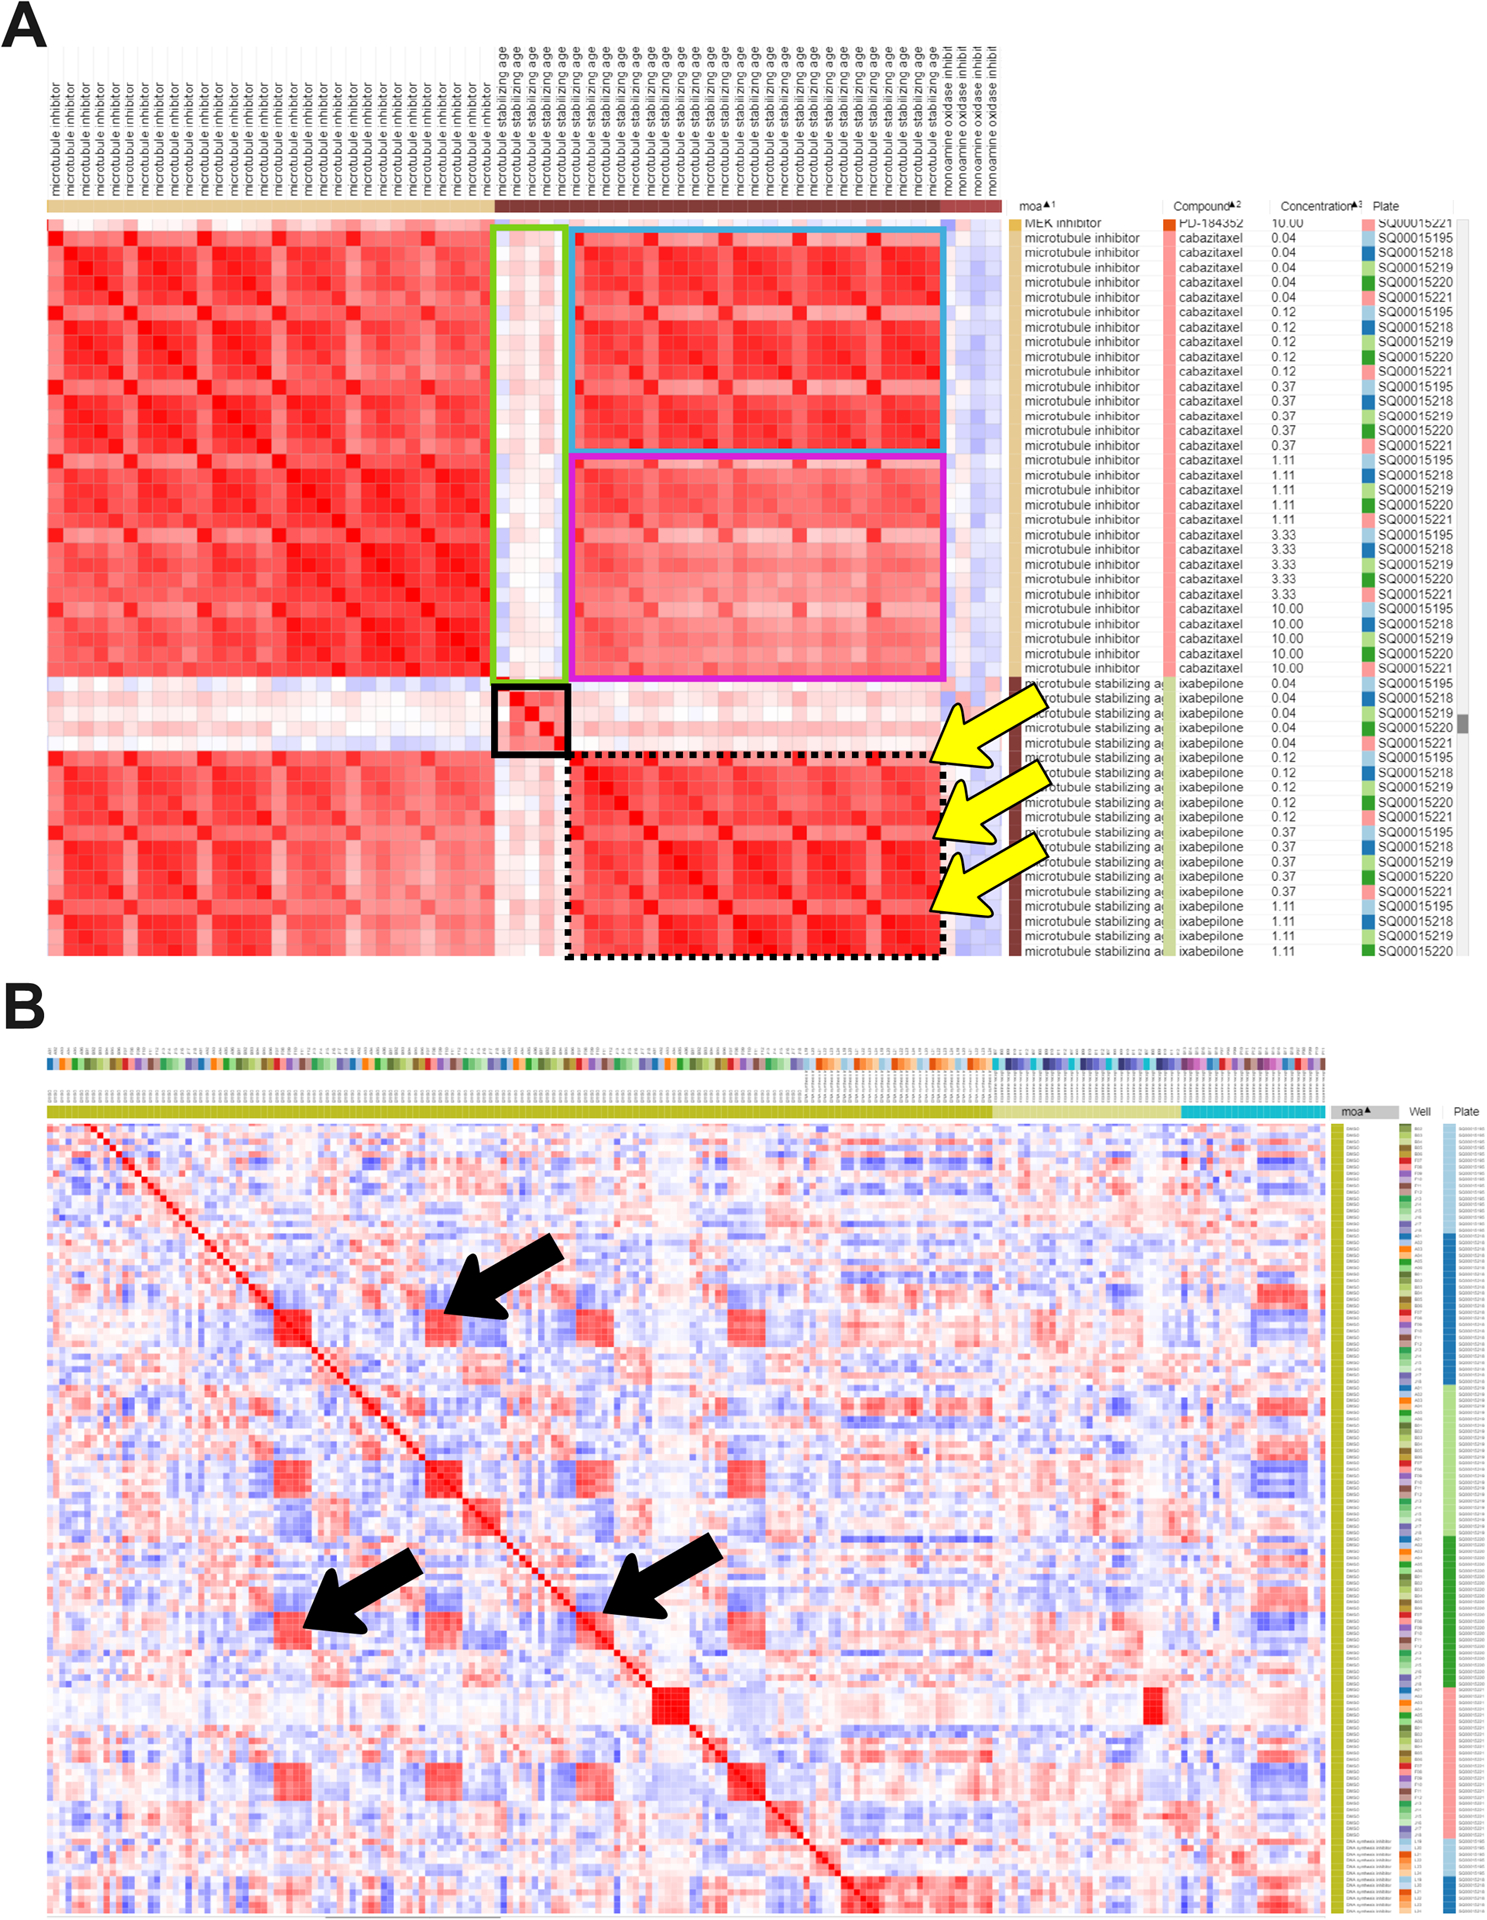
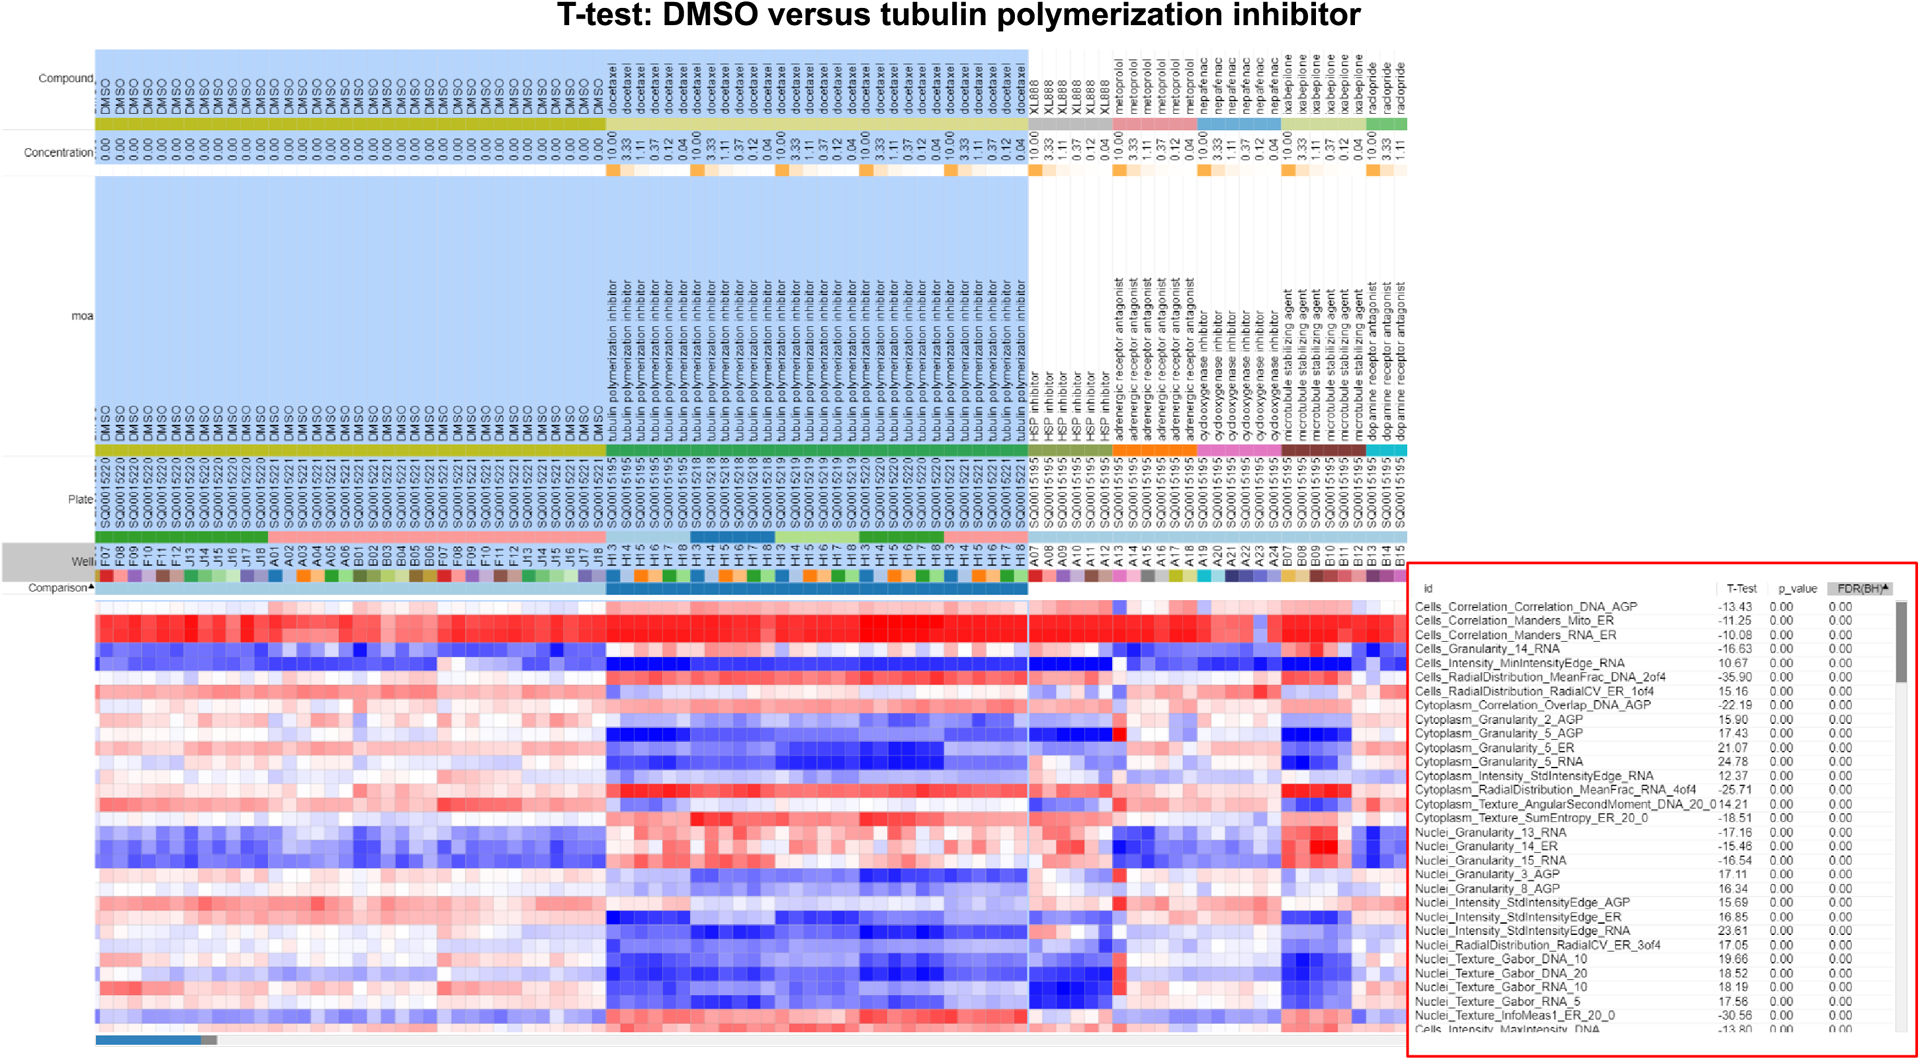
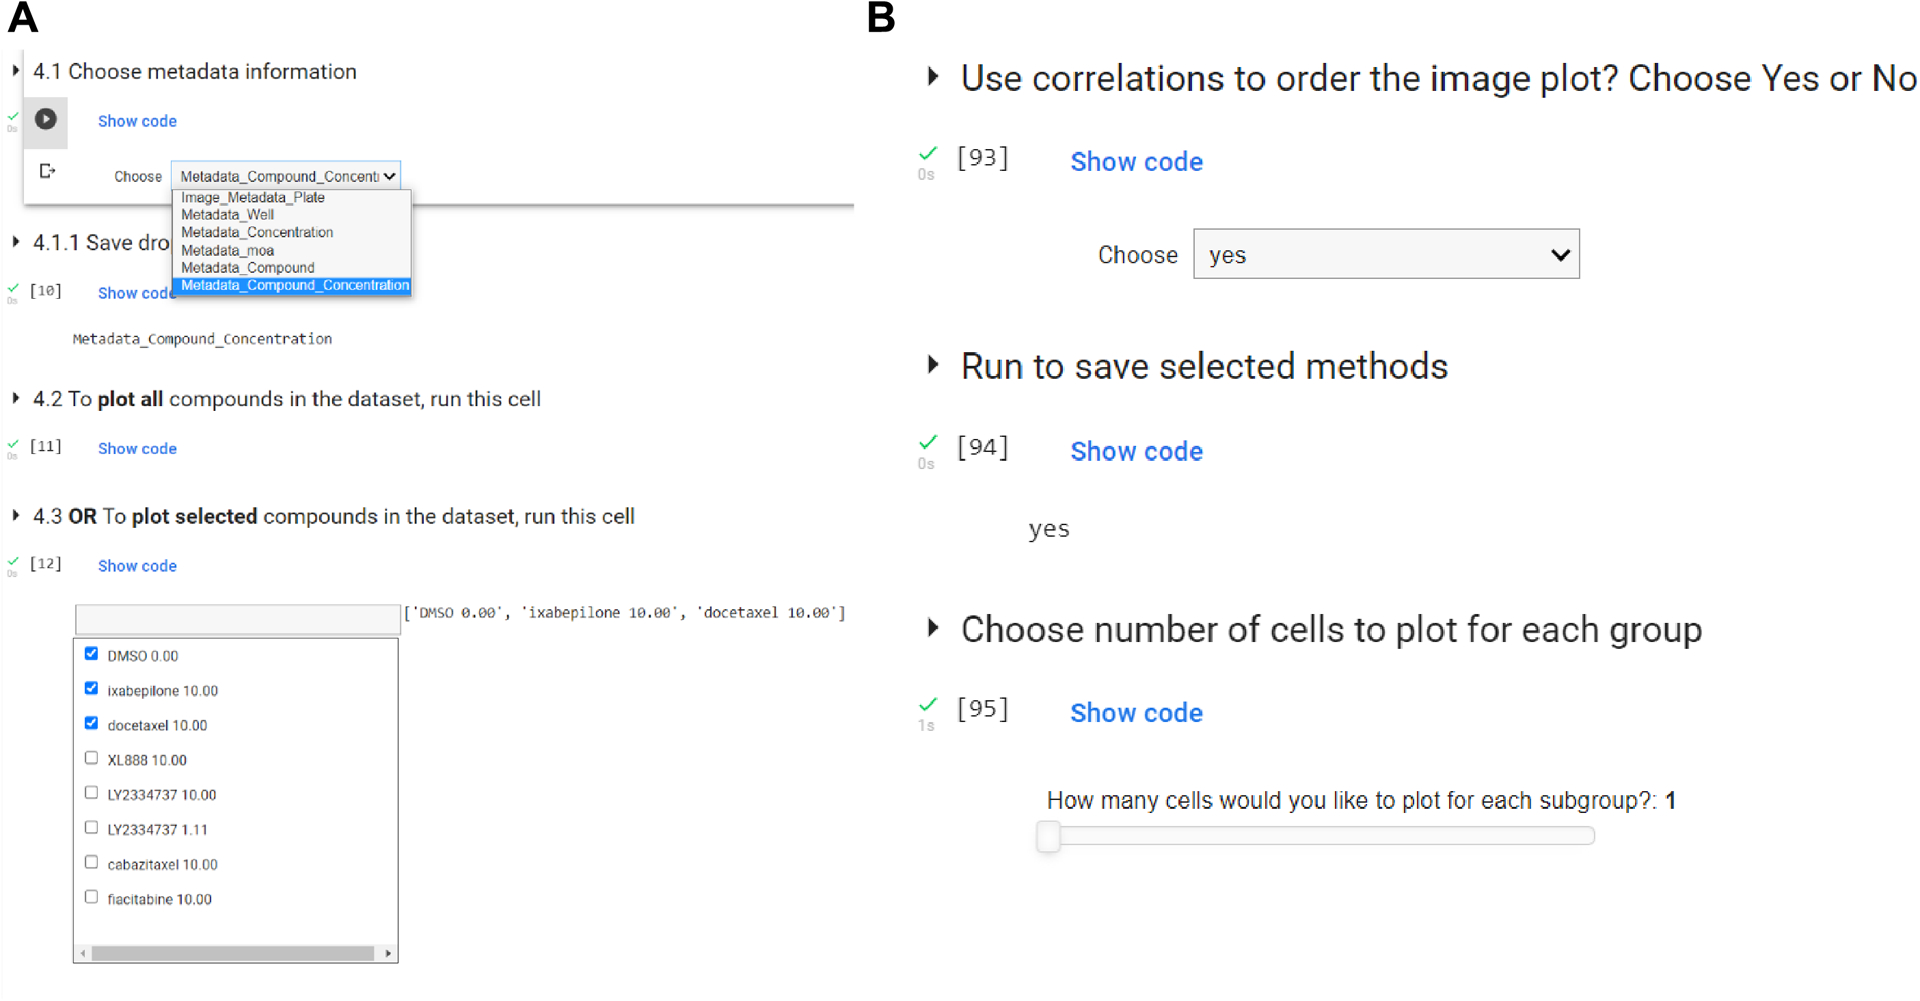
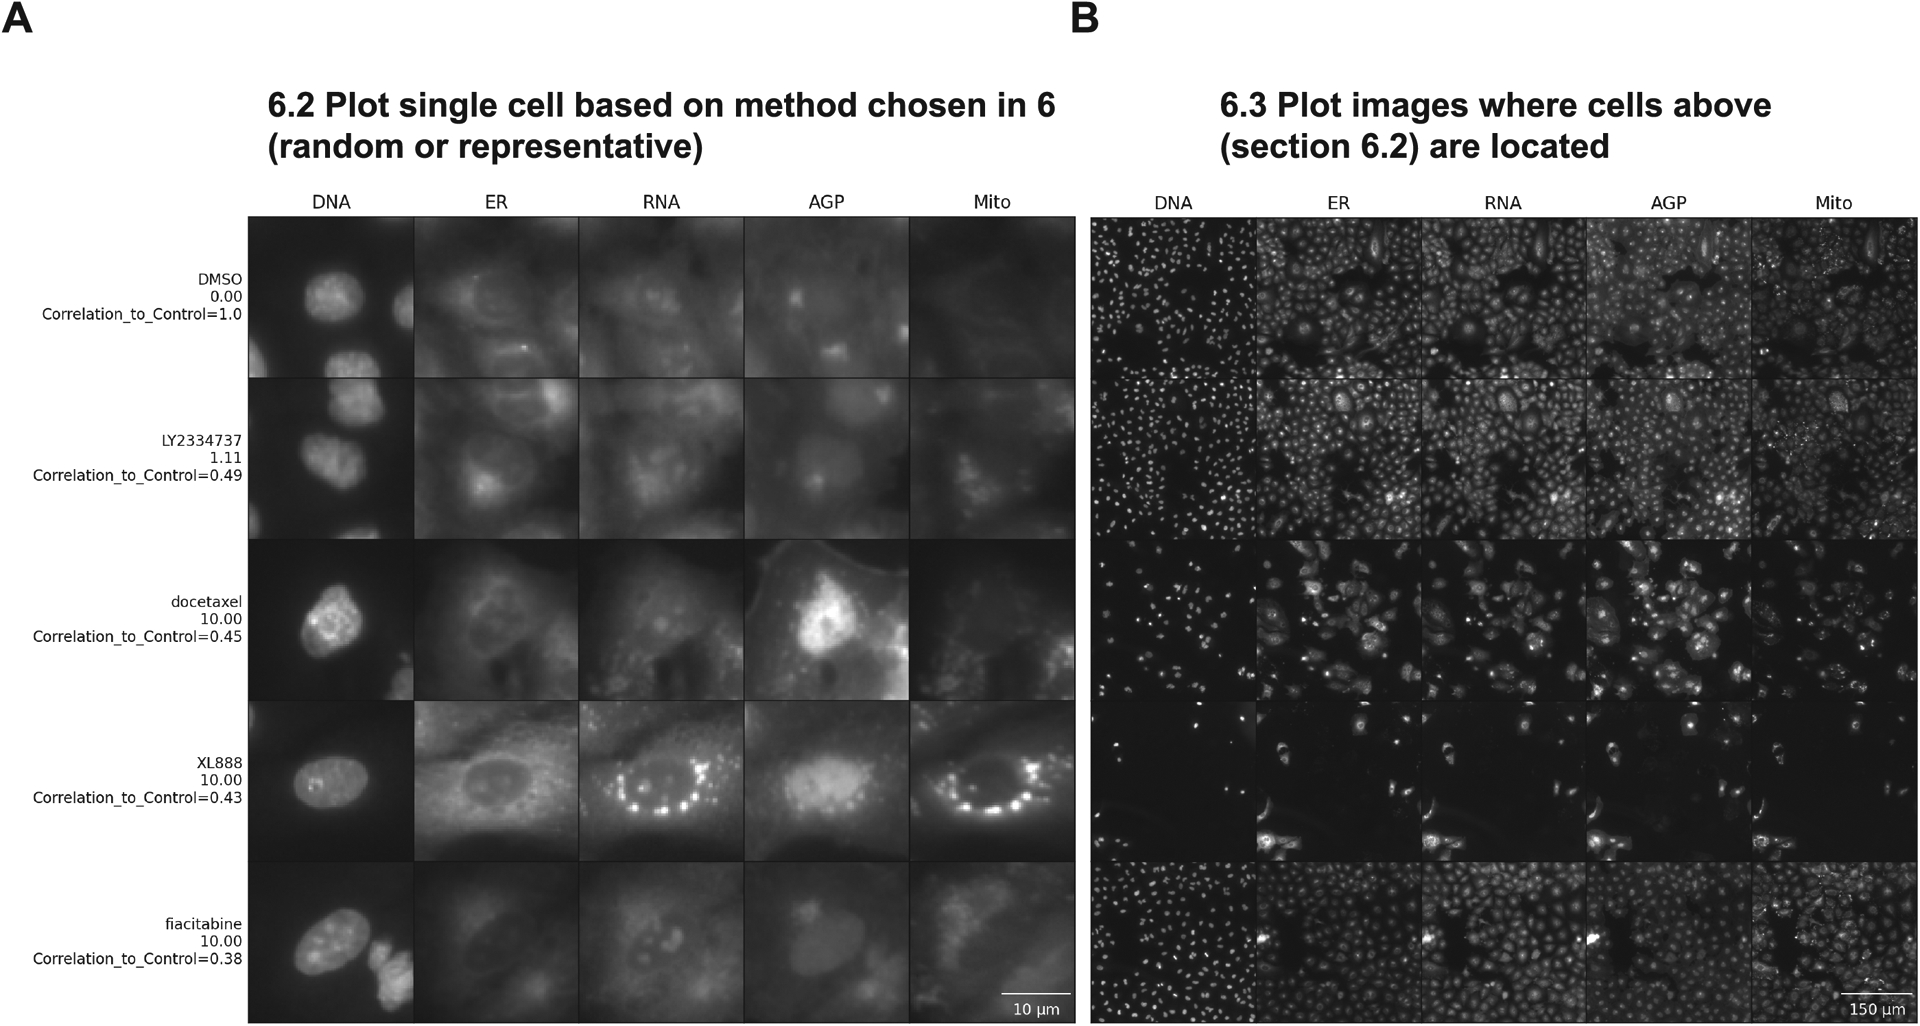
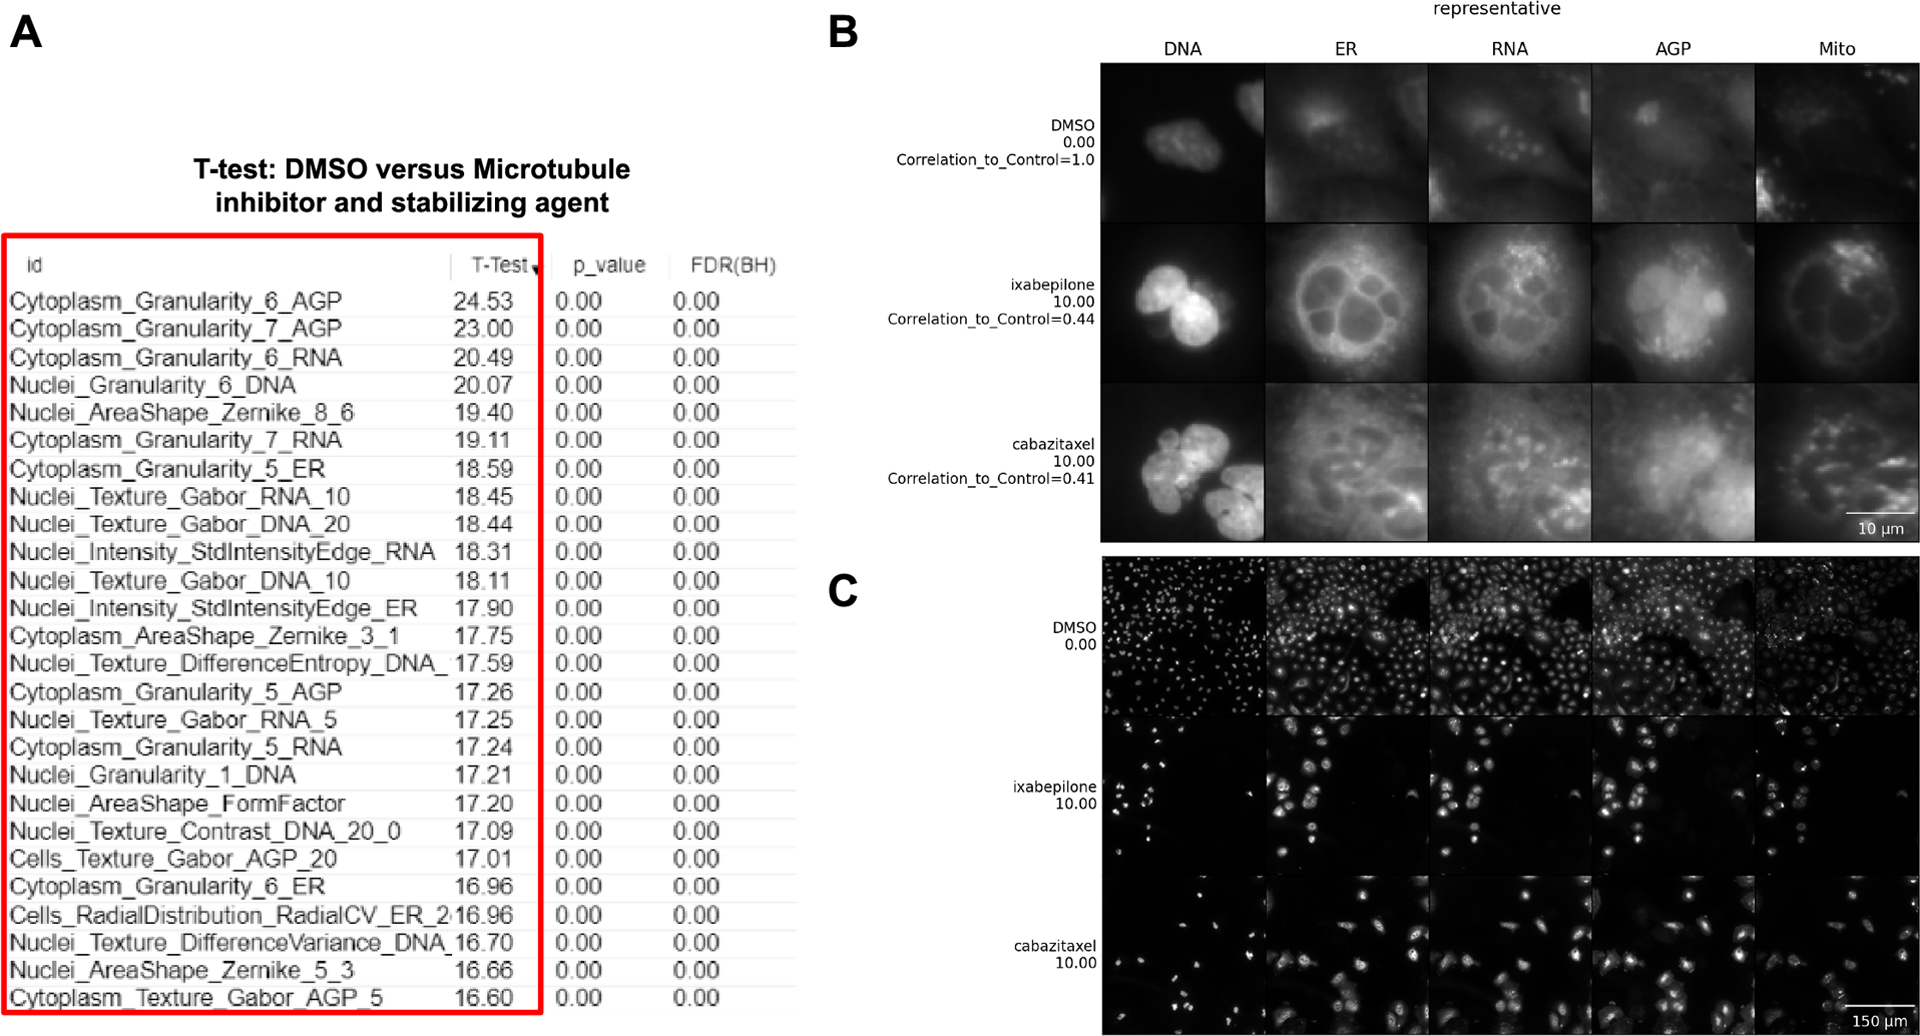
Image-based profiling quantitatively assesses the effects of perturbations on cells by capturing a breadth of changes via microscopy. Here, we provide two complementary protocols to help explore and interpret data from image-based profiling experiments. In the first protocol, we examine the similarity among perturbed cell samples using data from compounds that cluster by their mechanisms of action. The protocol includes steps to examine feature-driving differences between samples and to visualize correlations between features and treatments to create interpretable heatmaps using the open-source web tool Morpheus. In the second protocol, we show how to interactively explore images together with the numerical data, and we provide scripts to create visualizations of representative single cells and image sites to understand how changes in features are reflected in the images. Together, these two tutorials help researchers interpret image-based data to speed up research. © 2023 The Authors. Current Protocols published by Wiley Periodicals LLC. Basic Protocol 1: Exploratory analysis of profile similarities and driving features Basic Protocol 2: Image and single-cell visualization following profile interpretation.

Keywords: Morpheus; high-dimensional data; image-based profiling; morphological analysis; profiling; single-cell visualization.


Conflict of interest statement

CONFLICT OF INTEREST STATEMENT:

SS and AEC serve as scientific advisors for companies that use image-based profiling and Cell Painting (AEC: Recursion, SS: Waypoint Bio, Dewpoint Therapeutics) and receive honoraria for occasional talks at pharmaceutical and biotechnology companies.

Figures

Figure 1 -
Figure 1 -
In Basic Protocol 1, based on sample clustering, biologists can understand the underlying morphology that makes certain samples cluster in a certain way. In Basic Protocol 2, biologists can examine representative cells from each sample.
Figure 2 -
Figure 2 -
Similarity matrix generated in Morpheus. Columns were sorted by MOA, Compound, and then Concentration. (A) A subset of the similarity matrix showing the MOAs “Microtubule inhibitor” and “Microtubule stabilizing agent”. The top left and bottom right large red blocks show similarity of various doses on various plates within the same MOA class; the blocks on the top right and lower left are identical except for rotation, and show the similarity across classes. The small solid black box in the center shows the lowest dose of microtubule-stabilizing agent clusters well across replicates; its relatively poor correlation with the tightly clustered replicates at higher doses (black-dashed box) or any concentrations of microtubule inhibitor (green box) shows it might be below the effective dose of this drug. Higher doses of a microtubule-stabilizing agent, cluster well within and across doses, though a subtle recurring pattern within this block (highlighted by the yellow arrows) indicates that one of the five replicates shows a somewhat different profile than the other four, indicating a possible batch effect or technical anomaly. The effective concentration of a drug is highlighted by the lowest dose of ixabepilone clustering together (black box) but having weak correlations with the highest doses of ixabepilone. The higher doses of the microtubule-stabilizing agent are extremely similar to low concentrations of microtubule inhibitor (blue box) but less similar to higher concentrations of microtubule inhibitor (purple box). (B) Negative control (DMSO) correlation pattern, zoom out view of the similarity matrix. Black arrows highlight artifacts from plate-layout effects; treatments plated in the same or very similar well positions still can show significant similarity even after normalization. This can be alleviated at the experimental level by scrambling positions across plates and/or plating the same treatment in multiple positions spread across an individual plate.
Figure 3 -
Figure 3 -
Features that are driving the differences between the groups. A T-test was performed on DMSO versus tubulin polymerization inhibitor classes using the Marker Selection tool in Morpheus in Step 20. Features that differentiate between DMSO and a tubulin polymerization inhibitor are highlighted using a red box. Highlighted in blue are the columns of the two groups being compared (DMSO and tubulin polymerization inhibitor).
Figure 4 -
Figure 4 -
User’s interactions with the Jupyter Notebook. (A) Demonstration of the dropdown options, and choice box to choose only a subset of the compounds (step 6 of Basic protocol 2). To use new data, add the “Metadata_” prefix to the label columns. (B) More examples of interaction through dropdowns and sliders to choose the number of cells to plot.
Figure 5 -
Figure 5 -
Steps to plot single cells and representative images in order of correlation values. Both images were plotted with rescaled intensity, using the representative method, 1 cell per subgroup, and ordered top to bottom by the correlation values. On the Y-axis we have the compound’s names and concentrations in μM and the X-axis above has the names of stained structures, showing the different fluorescence channels available in this experiment: DNA (nucleus stained with Hoechst 33342, excitation/emission 405/450 nm), ER (endoplasmic reticulum stained with Concanavalin A, excitation/emission 488/525 nm), RNA (nucleoli and cytoplasmic RNA stained with SYTO 14, excitation/emission 488/600 nm), AGP (actin stained with phalloidin, Golgi and plasma membrane stained with wheat germ agglutinin, both acquired with excitation/emission 561/600 nm), and Mito (mitochondria stained with MitoTracker Deep Red, excitation/emission 640/750 nm). For complete details about the Cell Painting procedure, see more at (Bray et al., 2016). (A) Shows a single representative cell for each group in this dataset. Scale bar = 10 μm (B) shows the field of view where each representative cell is located. Scale bar = 150 μm
Figure 6 -
Figure 6 -
Interpretation of data using our Basic Protocols 1 and 2. (A) A marker selection was performed to test what are the features that differentiate DMSO vs Microtubule inhibitors (cabazitaxel 10 μM) and Microtubule stabilizing agents (ixabepilone 10 μM). The red box highlights the features. (B) Single cells are cropped based on an algorithm to retrieve representative cells. Scale bar = 10 μm. (C) Field-of-view where representative single cells are located. DNA (nucleus stained with Hoechst 33342, excitation/emission 405/450 nm), ER (endoplasmic reticulum stained with Concanavalin A, excitation/emission 488/525 nm), RNA (nucleoli and cytoplasmic RNA stained with SYTO 14, excitation/emission 488/600 nm), AGP (actin stained with phalloidin, Golgi and plasma membrane stained with wheat germ agglutinin, both acquired with excitation/emission 561/600 nm), and Mito (mitochondria stained with MitoTracker Deep Red, excitation/emission 640/750 nm). For complete details about the Cell Painting procedure, see more at (Bray et al., 2016). Scale bar = 150 μm.

References

    1. Azarenko O, Smiyun G, Mah J, Wilson L, and Jordan MA 2014. Antiproliferative mechanism of action of the novel taxane cabazitaxel as compared with the parent compound docetaxel in MCF7 breast cancer cells. Molecular cancer therapeutics 13:2092–2103. - PubMed
    1. Belin BJ, Lee T, and Mullins RD 2015. DNA damage induces nuclear actin filament assembly by Formin −2 and Spire-½ that promotes efficient DNA repair. [corrected]. eLife 4:e07735. - PMC - PubMed
    1. Bray M-A, Singh S, Han H, Davis CT, Borgeson B, Hartland C, Kost-Alimova M, Gustafsdottir SM, Gibson CC, and Carpenter AE 2016. Cell Painting, a high-content image-based assay for morphological profiling using multiplexed fluorescent dyes. Nature protocols 11:1757–1774. - PMC - PubMed
    1. Caicedo JC, Cooper S, Heigwer F, Warchal S, Qiu P, Molnar C, Vasilevich AS, Barry JD, Bansal HS, Kraus O, et al. 2017. Data-analysis strategies for image-based cell profiling. Nature methods 14:849–863. - PMC - PubMed
    1. Caridi CP, Plessner M, Grosse R, and Chiolo I 2019. Nuclear actin filaments in DNA repair dynamics. Nature cell biology 21:1068–1077. - PMC - PubMed

LinkOut - more resources