. 2023 May 17;111(10):1609-1625.e6.
doi: 10.1016/j.neuron.2023.02.022. Epub 2023 Mar 14.

Bilirubin gates the TRPM2 channel as a direct agonist to exacerbate ischemic brain damage

Affiliations

Bilirubin gates the TRPM2 channel as a direct agonist to exacerbate ischemic brain damage

Han-Wei Liu et al. Neuron. .

Abstract

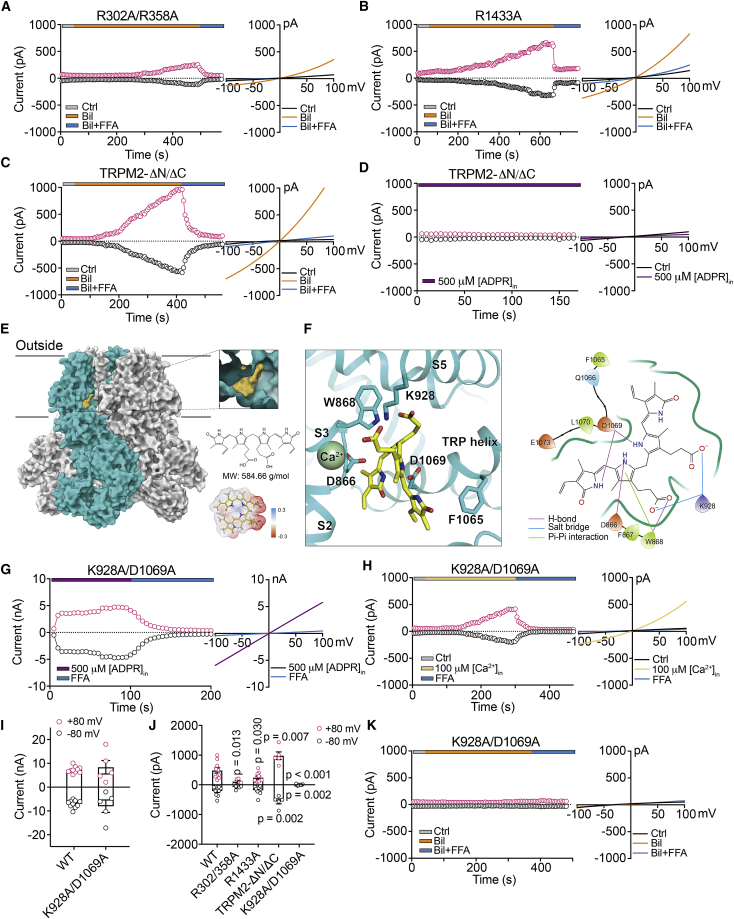
Stroke prognosis is negatively associated with an elevation of serum bilirubin, but how bilirubin worsens outcomes remains mysterious. We report that post-, but not pre-, stroke bilirubin levels among inpatients scale with infarct volume. In mouse models, bilirubin increases neuronal excitability and ischemic infarct, whereas ischemic insults induce the release of endogenous bilirubin, all of which are attenuated by knockout of the TRPM2 channel or its antagonist A23. Independent of canonical TRPM2 intracellular agonists, bilirubin and its metabolic derivatives gate the channel opening, whereas A23 antagonizes it by binding to the same cavity. Knocking in a loss of binding point mutation for bilirubin, TRPM2-D1066A, effectively antagonizes ischemic neurotoxicity in mice. These findings suggest a vicious cycle of stroke injury in which initial ischemic insults trigger the release of endogenous bilirubin from injured cells, which potentially acts as a volume neurotransmitter to activate TRPM2 channels, aggravating Ca2+-dependent brain injury.

Keywords: TRPM2; agonist; hyperbilirubinemia; stroke; volume neurotransmitter.


Conflict of interest statement

Declaration of interests We have filed a patent application for the bilirubin-binding cavity on the TRPM2 channel for developing therapeutics to treat brain injury in stroke and jaundice.

Figures

None
Graphical abstract
Figure 1
Figure 1
Serum bilirubin is elevated in stroke patients and correlated with infarct volume (A) Representative MRI images (diffusion weighted imaging [DWI]) of stroke patients with normal (Normal group) and abnormal (HB group) serum bilirubin levels. The areas indicated by the white arrow are the infarcted brain tissue (2D schematic diagram). (B) Summary data showing TB, DB concentration, and infarct volumes of stroke patients (Normal = 167, HB = 47). (C) Scatter plots by Spearman correlation analysis showing relationships of the TB, DB levels, and infarct volume in stroke patients. (D) Summary plots of serum TB and DB levels of serum tests from previous medical history and after stroke in enrolled patients with HB (n = 26). Gray area represents the reference values for normal bilirubin by clinical biochemistry (TB ≤ 18 μmol/L, DB ≤ 6 μmol/L). Error bars represent means ± SEM; unpaired Student’s t test, paired Student’s t test.
Figure 2
Figure 2
Hyperbilirubinemia exacerbates brain damage in adult ischemia models in vivo (24 h after tMCAO) (A) Representative images of brain sections by 2,3,5-triphenyl-tetrazolium chloride (TTC) staining of tMCAO Trpm2+/+ and Trpm2−/− adult mice with intraperitoneal injection of saline (Ctrl) and bilirubin (Bil). (B) Summary data showing normalized infarct volumes of Ctrl and Bil group in Trpm2+/+ and Trpm2−/− mice (n = 14 vs. 15). (C) Spearman correlation analyses of serum/CSF TB concentration and the infarct volume in tMCAO mice (n = 10–17). In Trpm2+/+ mice, both serum and CSF TB were significantly correlated with the infarct volume, but these correlation were absent in Trpm2−/− mice. (D) Summary data showing serum and CSF UCB concentration of Ctrl and Bil group in Trpm2+/+ and Trpm2−/− animals after tMCAO surgery (n = 14 vs. 15). (E) Comparison of UCB concentration in serum and CSF of Trpm2+/+ mice in the Ctrl and Bil group before and after ischemia-reperfusion injury (n = 14). (F) Summery data showing UCB concentration in serum and CSF of Trpm2−/− mice in Ctrl and Bil group before and after ischemia-reperfusion injury (n = 15). Error bars represent means ± SEM; paired Student’s t test, one-way ANOVA with the post hoc LSD test.
Figure 3
Figure 3
Prolonged application of bilirubin induces neuronal hyperexcitation in vitro (A) Example traces of action potentials (APs) evoked by current injections before and after bilirubin perfusion for 5 and 20 min of cortical neurons from adult Trpm2+/+ and Trpm2−/− mice. (B) The mean number of spikes induced by depolarization steps in 50 pA increments to cortical neurons of Trpm2+/+ and Trpm2−/− mice (n = 9). Data were fitted with the Boltzmann function, showing an increase in the slope factor and a reduction in the current magnitude to evoke 50% of the maximal spikes in Trpm2+/+ but not Trpm2−/− neurons after application of bilirubin for 20 min. (C) Summary plots of the resting membrane potential (Vrest), showing no significant differences between each group (n = 10). (D) Representative recordings of action potential evoked by 2.5 nA current injection in 0.3 ms were compared before and after bilirubin perfusion in Trpm2+/+ and Trpm2−/− cortical neurons. (E and F) Summary plots of the peak-amplitude and half-width from the cell in (D) (n = 10). Error bars represent means ± SEM; one-way ANOVA with the post hoc LSD test.
Figure 4
Figure 4
Bilirubin activates TRPM2 currents independent of intracellular ADPR (A and B) Representative time course of the currents activated by voltage ramps from −100 to +100 mV (500 ms) and the amplitudes measured at +80 mV (strawberry circle) and −80 mV (black circle) are plotted against time after membrane breakthrough. Example ramp current traces before and after bilirubin application and co-application with FFA were transformed into I-V relationships and overlaid on the right panels (in this and subsequent figures), showing TRPM2 currents activated by bilirubin in control solution and in the presence of PJ-34 (10 μM), ADPR (5 μM), ADPR (500 μM), and BAPTA (30 mM) in hTRPM2 transfected HEK-293T cells. (C) Summary data showing the maximum amplitude of currents activated by bilirubin under each of the above conditions (n = 9–11). (D) Representative single-channel recording showing bilirubin (300 nM) directly activated TRPM2 currents (holding potential −40 mV). (E) The representative all-points amplitude histogram of single-channel current amplitude (0.2 pA/bin) before and after perfusing bilirubin. Their distributions were it by single or double-component Gaussian functions with means of −0.04 pA (gray, control) and −0.02 and −2.02 pA (yellow, before and after bilirubin). (F) Statistical results of opening probability (Po) when perfusion of bilirubin and FFA (n = 12). (G) Mean single-channel current amplitudes activated by bilirubin from −80 to +80 mV are plotted against each voltage and fit with linear regression to yield single-channel conductance of 76.29 ± 7.85 pS (n = 4–7). Error bars represent means ± SEM; unpaired Student’s t test, paired Student’s t test.
Figure 5
Figure 5
TRPM2 currents activated by bilirubin derivatives (A) Chemical structure of bilirubin and the derivatives. (B–D) Representative time course and I-V curves of currents at +80 mV (strawberry circle) and −80 mV (black circle) before and after Bild (9 μM), BDS (9 μM), or XAME (9 μM), respectively. (E) Summary data showing the amplitude of maximum currents activated by bilirubin and its derivatives at +80 and −80 mV (n = 6–10). (F) Concentration-response relationships for currents evoked by bilirubin and XAME (n = 4) and fit with the Hill equation (bilirubin: EC50 = 1,917 nM, Hillslope = 1.0; XAME: EC50 = 66.12 nM, Hillslope = 0.77). Error bars represent means ± SEM; unpaired Student’s t test.
Figure 6
Figure 6
Bilirubin activates the TRPM2 channel by binding to a cavity in the transmembrane region near the Ca2+ binding site (A–C) Representative time course of currents at +80 mV (strawberry circle) and −80 mV (black circle) and superimposed I-V curves before and after bilirubin application and FFA co-application from N-terminal ADPR-binding site mutants (R302A/R358A), the C-terminal NUDT9-H domain mutants (R1433A), and truncation mutant (TRPM2-ΔN/ΔC). (D) Representative examples of time course and I-V curves of currents activated by 500 μM ADPR in TRPM2-ΔN/ΔC. (E) Molecular docking showing an overview of bilirubin-bound hTRPM2. A close-up view of the bilirubin-binding site is shown in the inset. Individual TRPM2 subunits are colored cyan and gray whereas bilirubin is highlighted with yellow, respectively. Chemical structure and the EM density of bilirubin are shown. (F) Specific recognition of bilirubin-bound hTRPM2. 3D diagram showing that bilirubin binds a deep cavity of TRPM2 between S3, S5 and TRP helix, Ca2+ is colored green (left panel). 2D diagram showing that bilirubin interacts with TRPM2 through a mixture of hydrogen bonds (H-bonds), salt bridges, and π-π interaction (right panel). (G and H) Representative time course of currents at +80 mV (strawberry circle) and −80 mV (black circle) activated by 500 μM ADPR and 100 μM Ca2+ in K928A/D1069A double mutant. I-V plots are shown in the right panels. (I) Summary plot showing the amplitude of currents activated by ADPR in the WT TRPM2 channel and K928A/D1069A double mutant (n = 5–10). (J) Summary data showing the amplitude of currents activated by bilirubin in WT TRPM2 channel and all mutants in (A)–(C) and (H) (n = 5–10). (K) Representative time course of currents at +80 mV (strawberry circle) and −80 mV (black circle) activated by 9 μM bilirubin in K928A/D1069A double mutant. I-V plots are shown in the right panels. Error bars represent means ± SEM; unpaired Student’s t test.
Figure 7
Figure 7
A23 antagonized the damage of bilirubin by specifically blocking the TRPM2 channel (A and B) Molecular docking showing the specific recognition of BDS (A) and A23 (B)-bound hTRPM2. 3D diagrams showing that BDS and A23 docking to the cavity where bilirubin binds the TRPM2 channel. 2D diagrams showing BDS and A23 interacts with TRPM2 through H-bonds and salt bridges. (C) Representative time course of TRPM2 currents activated by BDS, which was completely antagonized by A23. The I-V plot is shown on the right. (D) When HEK293 cells incubated with A23 for 20 min in advance, BDS failed to activate the TRPM2 channel. (E) Dose-response curves for A23 to block TRPM2 currents evoked by BDS, bilirubin, or ADPR, respectively. The concentration for A23 to produce 50% blockade (IC50) were estimated to be 0.72, 0.92, and 0.83 μM from fits with the Hill equation. (F) Representative immunofluorescence staining results of bilirubin-induced death of cortical neurons in adult Trpm2+/+ brain slices. Prominent calcein-am staining (green) of nuclei marked the population of live neurons and PI staining (purple) of nuclei marked the population of dead neurons. (G) Summary data showing mortality ratio of cortical neurons in (G) (n = 6–11). (H) Immunofluorescence co-localization imaging of neuronal (anti-NeuN), TRPM2 channels (anti-TRPM2), biliverdin reductase (anti-BVR), and heme oxygenase 1 (anti-HO-1). (I) Summary data showing the time course of OGD induced changes in the UCB concentration in brain slices from Trpm2+/+ and Trpm2−/− mice under different conditions (n = 3). Error bars represent means ± SEM; one-way ANOVA with the post hoc LSD test.
Figure 8
Figure 8
D1066A knockin (KI) mice phenocopy TRPM2 knockout mice in attenuating bilirubin-dependent effects on excitability and neurotoxicity in vitro and in vivo (A) Example traces of action potentials (APs) evoked by current injections before and after bilirubin perfusion for 5 and 20 min of cortical neurons from D1066A KI mice. The number of spikes induced by various depolarization steps in 50 pA increments to cortical neurons were counted, averaged, and fitted with the Boltzmann function to show an ablation of bilirubin-dependent upregulation of the intrinsic excitability. (B) Representative recordings of action potential evoked by 2.5 nA current injection in 0.3 ms were compared before and after bilirubin perfusion in D1066A KI cortical neurons. Summary plots of the resting membrane potential (Vrest), peak-amplitude, and half-width showing no significant differences between each group (n = 10). (C) Representative images of brain sections by TTC staining of D1066A KI mice adult with intraperitoneal injection of saline (Ctrl) and bilirubin (Bil). (D) Summary data showing little difference in normalized infarct volumes of the Ctrl and Bil group in D1066A KI mice (n = 9). (E) Summary data showing comparable serum and CSF UCB concentration of the Ctrl and Bil group in D1066A KI mice 24 h after tMCAO surgery (n = 9). (F) Summary data showing the time course of OGD induced changes in UCB concentration from D1066A KI brain slice under different conditions (n = 3). Error bars represent means ± SEM; unpaired Student’s t test, one-way ANOVA with post hoc LSD test.

References

    1. GBD 2015 Neurological Disorders Collaborator Group Global, regional, and national burden of neurological disorders during 1990–2015: a systematic analysis for the Global Burden of Disease Study 2015. Lancet Neurol. 2017;16:877–897. doi: 10.1016/S1474-4422(17)30299-5. - DOI - PMC - PubMed
    1. Libby P., Buring J.E., Badimon L., Hansson G.K., Deanfield J., Bittencourt M.S., Tokgözoğlu L., Lewis E.F. Atherosclerosis. Nat. Rev. Dis. Primers. 2019;5:56. doi: 10.1038/s41572-019-0106-z. - DOI - PubMed
    1. Kamel H., Okin P.M., Elkind M.S., Iadecola C. Atrial fibrillation and mechanisms of stroke: time for a new model. Stroke. 2016;47:895–900. doi: 10.1161/STROKEAHA.115.012004. - DOI - PMC - PubMed
    1. McDonagh A.F. Controversies in bilirubin biochemistry and their clinical relevance. Semin. Fetal Neonatal Med. 2010;15:141–147. doi: 10.1016/j.siny.2009.10.005. - DOI - PubMed
    1. Donnan G.A., Fisher M., Macleod M., Davis S.M. Stroke. Lancet. 2008;371:1612–1623. doi: 10.1016/S0140-6736(08)60694-7. - DOI - PubMed

Publication types