. 2023 Apr 10;33(7):1249-1264.e7.
doi: 10.1016/j.cub.2023.02.051. Epub 2023 Mar 14.

Volume-transmitted GABA waves pace epileptiform rhythms in the hippocampal network

Affiliations

Volume-transmitted GABA waves pace epileptiform rhythms in the hippocampal network

Vincent Magloire et al. Curr Biol. .

Abstract

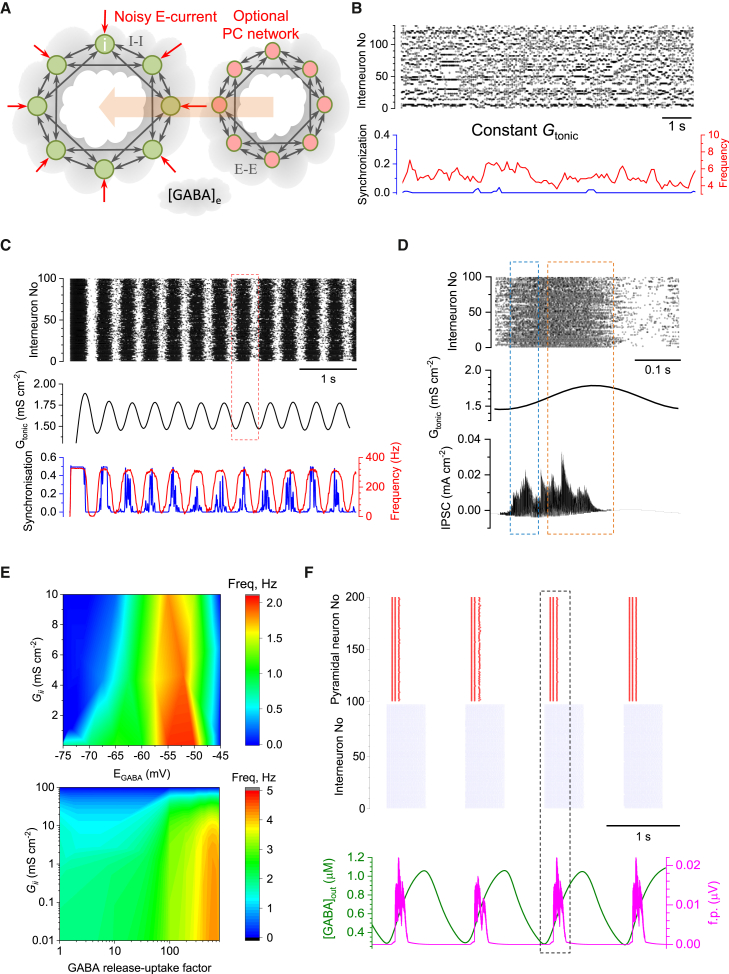
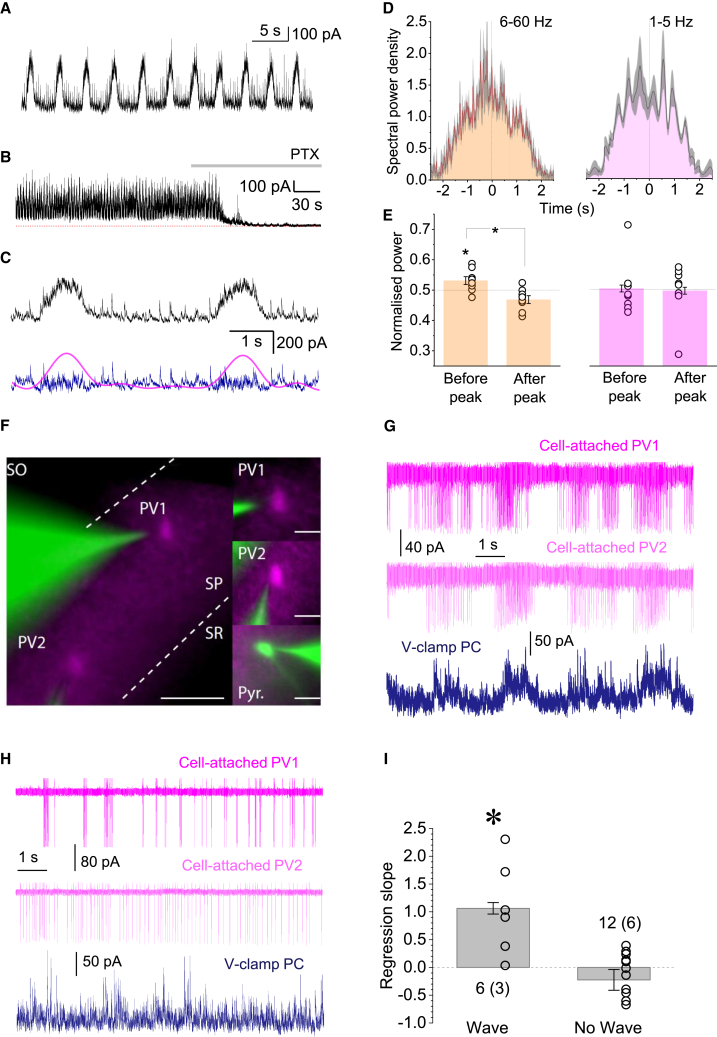
Mechanisms that entrain and pace rhythmic epileptiform discharges remain debated. Traditionally, the quest to understand them has focused on interneuronal networks driven by synaptic GABAergic connections. However, synchronized interneuronal discharges could also trigger the transient elevations of extracellular GABA across the tissue volume, thus raising tonic conductance (Gtonic) of synaptic and extrasynaptic GABA receptors in multiple cells. Here, we monitor extracellular GABA in hippocampal slices using patch-clamp GABA "sniffer" and a novel optical GABA sensor, showing that periodic epileptiform discharges are preceded by transient, region-wide waves of extracellular GABA. Neural network simulations that incorporate volume-transmitted GABA signals point to a cycle of GABA-driven network inhibition and disinhibition underpinning this relationship. We test and validate this hypothesis using simultaneous patch-clamp recordings from multiple neurons and selective optogenetic stimulation of fast-spiking interneurons. Critically, reducing GABA uptake in order to decelerate extracellular GABA fluctuations-without affecting synaptic GABAergic transmission or resting GABA levels-slows down rhythmic activity. Our findings thus unveil a key role of extrasynaptic, volume-transmitted GABA in pacing regenerative rhythmic activity in brain networks.

Keywords: GABA uptake; GAT-1; brain rhythms; epilepsy; extracellular GABA; iGABASnFR2; spiking neural networks; tonic GABA conductance; volume transmission.


Conflict of interest statement

Declaration of interests The authors declare no competing interests.

Figures

Figure 1
Figure 1
Rhythmic fluctuations of extracellular GABA during interictal activity in the hippocampal area CA1 (A) Local field potentials (LFPs, top trace), sniffer-patch single-channel activity (middle), and charge dynamics (bottom) during interictal discharges in hippocampal slices. Gray shade, picrotoxin (PTX) application at the end of trials. See also Figure S1A. (B) Fragment from (A) (between dotted lines), expanded to show the LFP (top, blue) and patch recording (bottom, black) details. High-chloride pipette solution was used to record inward GABAAR-mediated channel openings (Vm = −70 mV). (C) Similar setting to (B), but with low chloride solution to document outward currents (Vm = 0 mV). (D) Averaged time course of charge transfer rate (equal to current; mean ± SEM for slice-average traces, n = 6 slices) at the onset of individual field potential (f.p.) IIE (vertical dashed line, blue trace). Arrow, interictal discharge onset coincides with GABAAR activity reaching ∼35% of its peak. (E) Normalized and absolute charge transfer values recorded in sniffer patches at different [GABA]e (dots, mean ± SEM; n = 4–6 for individual values; gray line, sigmoid best fit). Dashed lines, [GABA]e during resting level (blue) and peak (red) of channel activity recorded. See Figures S1B–S1G for field-potential and single-cell recordings.
Figure 2
Figure 2
Optical registration of [GABA]e dynamics using iGABASnFR2 expressed in hippocampal slices (A) CA1 pyramidal cell expressing iGABASnFR2 with a field pipette electrode (f.p., left) and two imaging ROIs near the cell soma periphery (right, zoomed-in fragment shown by red rectangle on the left; λx2p = 910 nm). (B) One-slice example, fEPSPs (top) and iGABASnFR2 signal (bottom) recorded during interictal spikes. Dotted line, apparent baseline reflecting the resting/equilibrated [GABA]e. See Figure S2A for further detail. (C) Diagram showing 41 interictal spikes aligned with respect to their peak times (top), and the corresponding iGABASnFR2 signals (bottom; false color scale). See Figure S2B for details of field potential recordings. (D) iGABASnFR2 fluorescence increment against increasing [GABA]e in acute hippocampal slice preparation (mean ± SEM; n = 7 slices). Line, best-fit sigmoidal Hill function at E = 0.175; Kd = 1.26 μM, n = 2 (STAR Methods). (E) Summary of LFP and iGABASnFR2 recordings shown in (B) and (C), aligned in time, as indicated: traces and shaded area, mean ± 95% confidence interval (n = 41). (F) Average iGABASnFR2 signal (mean ± SEM, n = 3 hippocampal slices, 5–10 ROIs each) monitored in slices in control conditions, under epileptiform conditions (10 mM [K+]out), and under partial GAT-1 transporter blockade achieved by using sub-saturation concentrations of the blocker NO-711, as indicated. Approximate scale bar for [GABA] in (E) and (F) is derived from data in (D). (G) Experimental diagram: imaging IIE-driven GABA release landscape in CA1 neuropil with high spatiotemporal resolution using astroglia-expressed iGABASnFR2. See Figure S2C for further illustration. (H) Fluorescence landscape of iGABASnFR2 (15 spiral-scans/30 ms average) in baseline conditions (before an IIE; left) and the ΔF/F0 GABA signal landscape immediately after an IIE (right). Average for four consecutive IIEs.
Figure 3
Figure 3
[GABA]e-dependent Gtonic steers rhythmic activity of a modeled interneuron network across a range of parameters (A) Schematic. FS interneuron network model (I-I, GABAergic synaptic connections), with external excitatory inputs (E-current); volume-transmitted [GABA]e signal generating Gtonic; and an optional network of pyramidal cells incorporated (E-E, excitatory connections). (B) Raster plot of interneuronal network spiking (top), network synchronization coefficient (bottom, blue), and time course of average spiking frequency (bottom, red) for simulated network with constant Gtonic value (0.44 mS cm−2). (C) Raster plot as in (B), but with Gtonic driven by [GABA]e (middle) calculated from integrated interneuronal discharges; network synchrony and mean network frequency show clear periodicity (bottom). Key model parameters: cell number N = 100, intra-network peak synaptic conductance Gii = 0.1 mS cm−2; E-currents (Poisson series) with average synaptic conductance gs = 0.02 mS cm−2, decay constant tau = 3 ms, and frequency fs = 100 Hz; GABAAR reversal potential VGABA = −56 mV, GABA release factor Af = 1.35 × 10−7 nS cm−2 ms−1, Gpump = 0.003 ms−1 (STAR Methods). (D) Fragment from (C) (red dotted rectangle) enlarged, with the integrated IPSC time course (bottom). Blue and orange dotted rectangles indicate high-frequency, non-synchronized, and oscillating and synchronized IPSC periods, respectively. (E) Parameter-space heatmaps: rhythm generation over a range of Gii and EGABA (R = 1, top), and Gii and release-uptake factor R (STAR Methods; EGABA = −65 mV, bottom). Deep blue area indicates no detectable rhythmic activity. (F) Top: raster plot for a twinned network (red, pyramidal neurons; blue, interneurons), with weak internetwork (I-E and E-I) and strong intra-network (I-I and E-E) connections. Bottom: time course of field potential (f.p.; simulated for pyramidal neurons at 250 μm from the network, tissue conductance of 100 mS cm−1; STAR Methods) and [GABA]e, as indicated. Key model parameters: N = 200 (100 pyramidal cells and 100 interneurons), Gii = 0.216 mS cm−2, Gee = 0.003 mS cm−2; internetwork peak synaptic conductance Gei = 0.00012 mS cm−2 and Gie = 0.00064 mS cm−2, E-currents (Poisson series) gsi = 0.3 mS cm−2, tau = 3 ms, fs = 20 Hz; I-current (Poisson series) gse = 0.003 mS cm−2, decay constant tau = 3 ms, fs = 20 Hz, VGABA = −58 mV, Af = 2 × 10−7 nS cm−2 ms−1, Gpump = 0.003 ms−1. See Figures S3 and S4 for further exploration of the model parameter space.
Figure 4
Figure 4
Slow wave-like oscillations and synchronization of FS PV+ interneuron spiking activity during GABA waves (A) Trace. Example of GABAAR-mediated currents received by a CA1 pyramidal neuron (voltage-clamp with low intracellular Cl; Vh = 0 mV). (B) Slow, wave-like oscillations as in (A) are readily blocked by the GABAAR antagonist picrotoxin (PTX). (C) Traces as in (A) expanded: raw data (black), and its 2 Hz low-pass (Gtonic; magenta) and high-pass (blue) filtered components. (D) Example, average spectrogram plots (mean ± 95 CI; high and low frequency bands, as indicated); data over multiple IIEs in one slice. (E) Summary of the analysis shown in (D), for n = 7 slices: bar graphs, relative spectral power (bars, mean ± SEM; dots, individual experiments), before and after the Gtonic peak, as indicated. p < 0.05, one-sample (left) and paired-sample (middle) Student’s t test. (F) Illustration of dual cell-attached recordings of FS PV+ interneurons (green, 50 μM Alexa Fluor 488; magenta, tdTomato) and voltage-clamp recording of a CA1 pyramidal cell (50 μM AF488). Scale bars, 50 μm (left) and 20 μm (right). (G) Example time course of spiking activity of two simultaneously recorded FS PV+ cells (top and middle traces), and IPSCs in a pyramidal neuron (bottom, Vhold = +10 mV) in high-K+ solution (10 mM) and 0 Mg2+. Rhythmic network waves are present. (H) Experiment as in (G) but with no detectable rhythmic waves; notations as in (G). (I) Summary. Regression slope (mean ± SEM) between PV+ spiking intensity and synchronization parameter in dual-patch recordings. Samples with rhythmic waves (n = 6 cells in 3 slices) and without (n = 12 cells in 6 slices) are shown; p ∼ 0.038, Kruskal-Wallis non-parametric ANOVA (Z = 2.065; dependent datasets within 3 and 6 slices).
Figure 5
Figure 5
Short photoactivation of FS PV+ interneurons evokes epileptiform burst discharges (A) Simultaneous cell-attached and whole-cell recordings of action potentials (top trace) and GABAAR-mediated IPSCs (bottom) during [GABA]e waves (left) and after application of picrotoxin (PTX). Blue segments indicate pauses in PC spiking before the peaks of IPSCs. See also Figure S5A. (B) Transverse hippocampal slice of PV::Cre × Ai32 mouse (top): green fluorescence shows ChR2 expression in PV+ cells against DAPI (blue) nuclear counterstain (STAR Methods). Images 1–2 (areas indicated by dotted circles above): post hoc identification of a CA3 pyramidal neuron (biocytin-filled, magenta; 1) after a whole-cell recording shown below in (D). (C) Current-clamp recordings from a FS PV+ interneuron activated by a single (left) or repetitive (right) blue light pulses (1 ms, 470 nm). (D) Example of pyramidal neuron IPSCs (gray trace, top; Vhold = +10 mV) and field potentials (black trace, middle): photo-stimulation of FS PV+ cells (blue trace, bottom; 1-ms pulse) triggers large GABAAR currents and epileptiform bursts similar to those occurring spontaneously (e.g., Figure 1). 5 mM K+, 0 Mg2+ solution. See Figures S5B–S5D for further detail. (E) Statistical summary: probability of evoking an interictal event (IIE, mean ± SEM, n = 3–7 slices for individual values) as a function of light stimulation frequency. The occurrence of failures increases with stimulation frequency. The average frequency of spontaneous IIE (0.14 ± 0.03 Hz, n = 7 slices, dotted line) falls within the range of optimal frequencies to entrain the network with light stimuli. Above 0.2 Hz stimulation, the network enters into a refractory state. See Figure S6A for an example.
Figure 6
Figure 6
Optogenetically evoked GABA waves entrain epileptiform burst discharges (A) GABAAR current in pyramidal neurons (Vhold = +10 mV, normal aCSF solution; black trace, top) in response to progressive opto-activation of FS PV+ interneurons (blue, middle), with the IPSC power spectrum density (bottom). Dotted line, end of individual light ramps. (B) Average spectral power density (5–50 Hz interval, n = 18 ramp stimulations). Time window as exemplified by yellow rectangle in (A) near light intensity peaks (dotted line). (C) Tests in epileptogenic tissue (0 Mg2+ and 5 mM K+ aCSF): GABAAR current in pyramidal neurons (black trace, top) and local field potentials (middle) during opto-activation (blue trace), with power spectrum density (bottom). Note that interictal bursts occur toward the end of the stimulation ramp (vertical dotted line). See Figure S6B for further recording detail and Figures S7A and S7B for enforced rhythm entraining reproduced by the neural network model. (D) Average of spectral power density for time window exemplified by yellow rectangle in (C); notations as in (B).
Figure 7
Figure 7
GABA uptake rate controls rhythmic activity of interneuronal networks (A) Raster plots of interneuron spiking (dots; for presentation clarity, 6,000 randomly selected spike events shown only) and time course of Gtonic at different GABA uptake rates (red lines), as indicated. Key model parameters: cell number N = 1,500, intra-network peak synaptic conductance Gii = 0.096 mS cm−2; E-currents (Poisson series) with average synaptic conductance gs = 0.05 nS, decay constant tau = 3 ms, and frequency fs = 20 Hz; GABAAR reversal potential VGABA = −53 mV, GABA release factor Af = 10−8 nS cm−2 ms−1, Gpump = 0.004 ms−1 (see STAR Methods for further detail). Gtonic scale (bottom panel) applies throughout. (B) Examples of interictal spiking recorded in slice, under basal conditions (0 Mg2+ and 5 mM [K+], base), and during subsequent bath applications of the GABA uptake blocker NO-711 at increasing concentrations, as indicated. See Figure S7C for an example containing CA1 pyramidal cell IPSC recording. (C) Average frequency of interictal events (mean ± SEM, n = 6 slices), normalized to the baseline value, in baseline conditions and during NO-711 application, as indicated.

References

    1. Ben-Ari Y., Gaiarsa J.L., Tyzio R., Khazipov R. GABA: a pioneer transmitter that excites immature neurons and generates primitive oscillations. Physiol. Rev. 2007;87:1215–1284. - PubMed
    1. van der Zeyden M., Oldenziel W.H., Rea K., Cremers T.I., Westerink B.H. Microdialysis of GABA and glutamate: analysis, interpretation and comparison with microsensors. Pharmacol. Biochem. Behav. 2008;90:135–147. - PubMed
    1. Overstreet L.S., Westbrook G.L. Synapse density regulates independence at unitary inhibitory synapses. J. Neurosci. 2003;23:2618–2626. - PMC - PubMed
    1. Scanziani M. GABA spillover activates postsynaptic GABA(B) receptors to control rhythmic hippocampal activity. Neuron. 2000;25:673–681. - PubMed
    1. Loo D.D.F., Eskandari S., Boorer K.J., Sarkar H.K., Wright E.M. Role of Cl- in electrogenic Na+-coupled cotransporters GAT1 and SGLT1. J. Biol. Chem. 2000;275:37414–37422. - PubMed

Publication types

Substances