. 2023 Apr;616(7958):790-797.
doi: 10.1038/s41586-023-05939-3. Epub 2023 Mar 15.

Lactate regulates cell cycle by remodelling the anaphase promoting complex

Affiliations

Lactate regulates cell cycle by remodelling the anaphase promoting complex

Weihai Liu et al. Nature. 2023 Apr.

Abstract

Lactate is abundant in rapidly dividing cells owing to the requirement for elevated glucose catabolism to support proliferation1-6. However, it is not known whether accumulated lactate affects the proliferative state. Here we use a systematic approach to determine lactate-dependent regulation of proteins across the human proteome. From these data, we identify a mechanism of cell cycle regulation whereby accumulated lactate remodels the anaphase promoting complex (APC/C). Remodelling of APC/C in this way is caused by direct inhibition of the SUMO protease SENP1 by lactate. We find that accumulated lactate binds and inhibits SENP1 by forming a complex with zinc in the SENP1 active site. SENP1 inhibition by lactate stabilizes SUMOylation of two residues on APC4, which drives UBE2C binding to APC/C. This direct regulation of APC/C by lactate stimulates timed degradation of cell cycle proteins, and efficient mitotic exit in proliferative human cells. This mechanism is initiated upon mitotic entry when lactate abundance reaches its apex. In this way, accumulation of lactate communicates the consequences of a nutrient-replete growth phase to stimulate timed opening of APC/C, cell division and proliferation. Conversely, persistent accumulation of lactate drives aberrant APC/C remodelling and can overcome anti-mitotic pharmacology via mitotic slippage. In sum, we define a biochemical mechanism through which lactate directly regulates protein function to control the cell cycle and proliferation.


Conflict of interest statement

Conflict of Interest Statement. J.Z. is co-founder and board director of Crimson Biopharm Inc. and Geode Therapeutics Inc. E.T.C is co-founder of Matchpoint Therapeutics and Aevum Therapeutics. All other authors have no competing interests.

Figures

Extended Data Figure 1:
Extended Data Figure 1:. Molecular consequences of elevated lactate on UBE2C and APC/C.
(a) Hypothesis that high lactate concentration can directly regulate cellular processes. (b) Outline of the principle that TPP can reveal lactate mediated changes in protein thermostability through acquired protein-protein interactions. (c) Acute treatment of native HEK proteomes with lactate following cell lysis and dilution. (d) Stable abundance of lactate in HEK cellular lysates over 15 min incubation period used for TPP experiment. n=6 cell replicates. (e) TPP workflow to assess proteome-wide changes in protein thermostability following lactate treatment. (f) Thermostability changes to UBE2C in HEK293 and HCT116 cell lysates following treatment with lactate, as determined by western blotting. Representative blot from three experiments shown. (g) Lack of observable thermostability changes to UBE2C in HCT116 cell lysates following treatment with D-lactate or pyruvate. Representative blot from three experiments shown. (h) Effect of acute (15 min) elevation of lactate on UBE2C protein abundance in cellular lysates. Representative blot from two experiments shown. (i) Effect of acute (15 min) elevation of lactate on post-translational modifications of UBE2C. (j) IP of pro-metaphase APC(CDC27) following lactate treatment without addition of exogenous UBE2C demonstrates lactate-mediated binding of UBE2C, cyclin B1, and securin to pro-metaphase APC/C. Representative blot from two experiments shown. (k) IP of UBE2C following lactate treatment demonstrates lactate-mediated binding of UBE2C to APC/C as determined by blotting for APC4. Representative blot from two experiments shown. (l) IP of pro-metaphase APC(CDC27) following 5 mM and 10 mM lactate treatment to determine effect on binding of UBE2C, cyclin B1, and securin to pro-metaphase APC/C. (m) IP of pro-metaphase APC(CDC27) following D-lactate (left) or pyruvate (right) treatment demonstrates no effect on binding of UBE2C, cyclin B1, and securin to pro-metaphase APC/C. (n) IP-MS of APC(CDC27) following D-lactate or pyruvate treatment demonstrates lack of effect on binding of Cyclin B1, CDK1, and CDK2. n = 4 cell replicates. (o) Quantification of phosphorylation on APC/C, and APC/C interacting proteins, following cell lysate incubation with 15 mM lactate. n = 8 cell replicates. (p) Effect of acute (15 min) elevation of lactate on post-translational modifications of APC/C, and APC/C interacting proteins. n = 8 cell replicates. (q) SUMO1 (top) and APC4 (bottom) immunoblot of immunopurified APC4 following lactate treatment in intact cells for 4 h. Representative blot from two experiments shown. Data are mean ± s.e.m.
Extended Data Figure 2:
Extended Data Figure 2:. Characterization of lactate-dependent APC4 SUMOylation.
(a) Effect of 15 min lactate treatment on total SUMO2/3 content in cellular lysates. Representative blot from two experiments shown. (b) Experimental design for identification of protein SUMOylation that is elevated in response to lactate. See Methods for details. (c) Quantification of differential SUMOylation of 860 proteins following treatment of HCT116 cell lysates with 15 mM lactate for 15 min. 16 proteins exhibiting significant lactate-dependent elevation in SUMOylation are highlighted. n = 3 cell replicates. (d) Sequencing of APC4 gene locus in APC4 KO HeLa S3 and HCT116 cells. In both cases, the relevant region of exon 29 is shown highlighting nucleotide differences (#) to WT sequence (black) and frameshift mutations that elicited KO (blue squares). In HeLa S3 cells the highlighted region indicates two distinct frame shift mutations. (e) APC4 KO cells exhibit abnormal mitosis. Method for defining abnormal mitosis described in the Methods section. (f) Sequencing of APC4 in HeLa S3 expressing lentiviral WT and mutant constructs containing WT sequence APC4 K772 & K798, and mutant R772 & R798. (g) Sequencing of APC4 in HCT116 expressing lentiviral WT and mutant constructs containing WT sequence APC4 K772 & K798, and mutant R772 & R798. (h) APC4 immunoblot of HeLa S3 and HCT116 WT, APC4 KO, and APC4 KO cells re-expressing WT APC4 or APC4 K772/798R. Representative blot from three experiments shown. (i) IP of APC(CDC27) following lactate treatment in cell lysates demonstrates lactate-mediated binding of cyclin B1 and securin to pro-metaphase APC/C requires APC4 SUMO2/3 targets K772 and K798. Representative blot from three experiments shown. (j) CRISPR depletion of SENP1 in three proliferative human cell lines. sgC: guide control. Representative blot from two experiments shown. (k) SUMO2/3 (top) and APC4 (bottom) immunoblot of immunopurified APC4 following lactate treatment in cells for 4 hrs in WT and SENP1KO cells indicates lack of additive effect, suggesting the modalities operate in series. Representative blot from four experiments shown. (l) Densitometry quantification immunoblot replicates from panel k immunopurified APC4 following lactate treatment in WT and SENP1KO cells indicates lack of additive effect, suggesting the modalities operate in series. n = 4 cell replicates. (m) SENP1 residues predicted as favorable for zinc binding according to ZincBind algorithm using SENP1 structure PDB 2XPH. (two-tailed Student’s t-test for pairwise comparisons in l). ANOVA analyses were subjected to Bonferroni’s post hoc test. Data are mean ± s.e.m.
Extended Data Figure 3:
Extended Data Figure 3:. Characterization of lactate and zinc binding to SENP1.
(a) 1H-15N TROSY HSQC spectrum of SENP1419–644 +/− zinc binding, highlighting all active site regions. (b) Intensity reduction in SENP1 resonances as a function of residue number after addition of 100 μM zinc to SENP1. (c) Structure of SENP1 (PDB ID 2IYC) color-coded as a heatmap according to peak intensity reduction caused by the addition of 100 μM zinc (cyan = no intensity reduction, red = maximum intensity reduction). (d) 1H-15N TROSY HSQC spectra of SENP1419–644 + 100 μM zinc and +/− 1 mM L-lactate, highlighting active site residues. (e) 1H-15N HSQC spectrum of human SENP1 catalytic domain comparing WT protein to C535S mutant. Spectral shifts differentiating WT and C535S SENP1 that match assignment to C535 in annotated spectra are highlighted. (f) MS determination and quantification of SENP1 cysteines that coordinate zinc. Method reports on stoichiometry of zinc binding with individual cysteines based on differential labelling with iodoacetamide (IAM). See Methods for details. (g) Quantification of zinc binding to human SENP1 cysteines by MS ± 1 mM lactate. Stoichiometry of zinc labelling of cysteines determined as described in Extended Data Fig. 3f, n = 5 independent samples. (h) 1H-15N HSQC spectrum of human WT SENP1 ± ZnSO4 in the presence or absence of 0.5 mM L-lactate, D-lactate, or pyruvate. Active site residues where L-lactate+zinc induced CSPs are observed are highlighted. (i) 1H-15N NMR spectra regions of WT SENP1 comparing L-lactate+zinc induced active site CSPs to D-lactate and pyruvate. (j) 1H-15N HSQC spectrum of human WT SENP1 ± 0.5 mM lactate. Regions of the spectrum where L-lactate+zinc induced CSPs in the active site are highlighted showing none of these CSPs occur in the absence of zinc. (one-way ANOVA for multiple comparisons in g. ANOVA analyses were subjected to Bonferroni’s post hoc test). Data are mean ± s.e.m.
Extended Data Figure 4:
Extended Data Figure 4:. Characterization of functional effects of lactate and zinc on SENP family.
(a) Effect of ZnSO4 on recombinant human SENP1 deSUMOylation activity. n = 6; 7.5 nM n = 5 independent samples. (b) Effect of lactate on zinc-mediated inhibition of recombinant SENP1 deSUMOylation activity. n = 6; 120 nM zinc n = 4 independent samples. (c) Effect of MgCl2 and CaCl2 on recombinant human SENP1 deSUMOylation activity. n = 6; 500 nM CaCl2 n = 5 independent samples. (d) Effect of lactate on recombinant human SENP1 deSUMOylation activity. n = 6 independent samples. (e) Effect of ZnSO4 and lactate on recombinant human SENP2, SENP3, SENP5, SENP6, and SENP7 deSUMOylation activity. n shown in panel and indicate independent samples. (f) Sequence alignment of human SENP family active site regions highlighting residues invoked in SENP1 co-ordination of lactate-zinc complex (C535 and N556). (g) SUMO2/3 (top) and APC4 (bottom) immunoblot of immunopurified APC4 following lactate treatment in cellular lysates in the presence of EDTA to chelate zinc, including supplementation with Mg2+ to control for effects of EDTA on Mg2+ chelation. Representative blot from three experiments shown. (h) SUMO2/3 (top) and APC4 (bottom) immunoblot of immunopurified APC4 following ZnSO4 treatment in cellular lysates demonstrate that elevation of zinc stabilizes APC4 SUMOylation. Representative blot from three experiments shown. (i) SUMO2/3 (top) and APC4 (bottom) immunoblot of immunopurified APC4 following treatment with sub-optimal zinc and lactate in cellular lysates. Representative blot from four experiments shown. (j) Densitometry quantification immunoblot replicates from panel i of immunopurified APC4 following suboptimal zinc treatment in the presence or absence of lactate. n=4 cell replicates. (k) Sequencing of SENP1 in HCT116 expressing lentiviral WT and mutant constructs containing WT sequence N556, and mutant A556. Blue region highlights silent PAM mutation, red region highlights N556A mutation. (l) Densitometry of immunopurified APC4 following lactate treatment in cellular lysates from SENP1 WT and N556A HCT116 cells, related to Figure 3k. (m) Effect of lactate on zinc-mediated inhibition of recombinant human SENP1 deSUMOylation activity in the presence of 20 mg/ml albumin. n = 3 independent samples. (two-tailed Student’s t-test for pairwise comparisons in l, one-way ANOVA for multiple comparisons in a,j,l,m). ANOVA analyses were subjected to Bonferroni’s post hoc test. Data are mean ± s.e.m.
Extended Data Figure 5:
Extended Data Figure 5:. Timing and effects of lactate accumulation on cell cycle and proliferation.
(a) Schematic of metabolic flux to anabolic precursors tied to lactate production, pathways predicted to increase flux in response to growth demand in G1/S/G2 phase. (b) Outline of experiment to monitor relationship between lactate abundance and cell cycle phases in proliferative cells. Double thymidine block and release synchronized cells at the G1/S interface as described in Methods. (c) Parallel tracking of securin and cyclin B1 abundance (top), cell cycle phase (middle), and intracellular lactate abundance (bottom) in WT and APC4 K772/798R HCT116 cells. n = 6 cell replicates; 12 hr APC4 K772/798R n = 5; lactate abundance n = 6; 6 hr WT n =5. Representative blot from three experiments shown. (d) MS quantification of proteins involved in lactate production and lactate abundance in asynchronous HCT116 cells and 0h, 6h, and 12h post-DTB release. n=4 cell replicates. (e) MS quantification of lysine lactylation in asynchronous HCT116 cells and 0h, 6h, and 12h post-DTB release. n=4 cell replicates. (f) Abundance of PDHe1α and PDHe1α phosphorylation on residue Ser293 tracked during cell cycle following DTB release. as = asynchronous. Representative blot from three experiments shown. (g) CD8+ T cells stimulated with IL-2 and anti-CD28 for 24 h with cell cycle and intracellular lactate abundance monitored. Lactate abundance n = 4; cell cycle n = 6 cell replicates. (h) Model for lactate accumulation mediating timed remodeling of APC/C to facilitate mitotic progression. (i) ΔCt quantification of bacterial LMO mRNA expression in HCT116 cells relative to β-actin. n = 3 cell replicates. (j) Cells expressing LMO, or treatment of cells with 25 mM DCA, lowers peak intracellular lactate abundance achieved upon mitotic entry. n = 6 cell replicates (k) Negative correlation between intracellular lactate abundance and doubling time in 707 human proliferative cancers. See Methods for details. (l) Proliferation rate of WT and APC4 K772/798R HeLa S3 and HCT116 cells. Cells lacking APC4 SUMOylation sites exhibit a significantly lower proliferation rate. n = 4 cell replicates. (m) Exposure of asynchronous HCT116 cells to 1% O2 for 24 hours lowers levels of securin and cyclin B1. Representative blot from three experiments shown. (n) Proliferation rate of WT, APC4 K772/798R, and LMO-expressing HCT116 cells cultured at 1% O2. N = 5 cell replicates. (two-tailed Student’s t-test for pairwise comparisons in c,j, one-way ANOVA for multiple comparisons in g, two-sided Pearson R in k, two-way ANOVA for multiple comparisons involving two independent variables in l,n). ANOVA analyses were subjected to Bonferroni’s post hoc test.
Extended Data Figure 6:
Extended Data Figure 6:. Effect of lactate accumulation on cyclin B1, securin, and mitotic exit.
(a) Model for putative role of chronic lactate elevation on APC/C dependent processes in proliferative cells. (b) Intracellular lactate concentration in asynchronous HeLa S3 (n=6), DLD1 (n=5), and HCT116 (n=5) cells. n indicates cell replicate number. (c) Treatment of asynchronous human proliferative cells with elevated lactate at 15 and 25 mM for 4 hours lowers levels of securin and cyclin B1. Representative blot from three experiments shown. (d) mRNA transcript abundance of human FOXK1 (n=3) and FOXK2 (n=4) in HCT116 cells following engineered overexpression (oe). n designates cell replicates. (e) Effect of forced overexpression on abundance of cyclin B1 and securin in asynchronous HCT116 cells. Representative blot from two experiments shown. f) Treatment of asynchronous human proliferative cells with elevated glucose for 4 hours has no effect on levels of securin and cyclin B1. Representative blot from two experiments shown. (g) Treatment of asynchronous human proliferative APC4 K772/798R cells with 25 mM lactate for 4 hours has no effect on securin or cyclin B1 abundance. Representative blot from three experiments shown. (h) Lactate mediated depletion of securin and cyclin B1 is lost upon treatment with the proteasome inhibitor MG132. Representative blot from three experiments shown. (i) Treatment of asynchronous HCT116 cells with 15 mM lactate for 4 hours lowers levels of securin and cyclin B1 in the presence of the LDH inhibitor GSK2837808A. Representative blot from two experiments shown. (j) Effect of treatment of asynchronous human proliferative cells with 1 μM oligomycin A for 24 hours on abundance of securin and cyclin B1 in WT and APC4 K772/798R cells. Representative blot from three experiments shown. (k) Effect of treatment of asynchronous human proliferative cells with 5 mM αCHCA for 24 hours on abundance of securin and cyclin B1 in WT and APC4 K772/798R cells. Representative blot from three experiments shown. (two-tailed Student’s t-test for pairwise comparisons in d). Data are mean ± s.e.m.
Extended Data Figure 7:
Extended Data Figure 7:. Persistent lactate elevation drives mitotic slippage through aberrant APC/C activation.
(a) Treatment of cells with an inhibitor of microtubule assembly nocodazole (sync.) for 14 hours to arrest in pro-metaphase leads to accumulation of cyclin B1. Exposure of arrested WT cells to lactate for the last 12 hours of nocodazole exposure stimulates depletion of cyclin B1 in the presence of nocodazole. (b) Treatment of HCT116 or HeLa S3 cells with an inhibitor of microtubule assembly nocodazole (sync.) for 14 hours to arrest in pro-metaphase leads to accumulation of cyclin B1. Co-exposure of arrested WT cells to 1 μM oligomycin A stimulates depletion of cyclin B1 in the presence of nocodazole. Arrested APC4 K772/798R cells treated with oligomycin A exhibit no oligomycin A dependent effect. (c) Treatment of HCT116 or HeLa S3 cells with an inhibitor of microtubule assembly nocodazole (sync.) for 14 hours to arrest in pro-metaphase leads to accumulation of cyclin B1. Co-exposure of arrested WT cells to 5mM αCHCA stimulates depletion of cyclin B1 in the presence of nocodazole. Arrested APC4 K772/798R cells treated with αCHCA exhibit no αCHCA dependent effect. (d) Treatment of cells with an inhibitor of microtubule assembly nocodazole for 14 hours to arrest in pro-metaphase. Quantification of WT cells exhibiting chromosome mis-segregation following treatment with lactate for the last 12 hours of nocodazole exposure. n = 30 individual cell replicates. (e) Treatment of cells with an inhibitor of microtubule assembly nocodazole for 14 hours to arrest in pro-metaphase. Quantification of APC4 K772/798R cells exhibiting chromosome mis-segregation following treatment with lactate for the last 12 hours of nocodazole exposure. n = 30 individual cell replicates. (f,g) Treatment of (f) WT cells and (g) APC4 K772/798R with an inhibitor of microtubule assembly nocodazole for 14 hours to arrest in pro-metaphase. Rate of mitotic progression was determined by timelapse microscopy following exposure of cells to lactate for the last 12 hours of nocodazole incubation. Analysis represents time in mitotic arrest beginning with nuclear envelope breakdown (NEBD) to DNA decondensation. n = 30 individual cell replicates. (two-tailed Student’s t-test for pairwise comparisons in d). Data are mean ± s.e.m.
Figure 1:
Figure 1:. Lactate regulates the APC/C protein interactions.
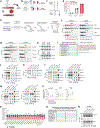
(a) HEK proteome distribution of thermostability changes following treatment with 15 mM lactate and 25 mM lactate. See Table S1 for raw data. Integrated Δ thermostability calculated as the sum difference in non-denatured protein across the entire temperature curve. (b) Top 10 proteins exhibiting elevated thermostability following treatment with 15 and 25 mM lactate in HEK lysates. Integrated Δ thermostability calculated as the sum difference in non-denatured protein across the entire temperature curve. (c) Lactate mediated thermostability changes to UBE2C following treatment with 15 and 25 mM lactate in HEK lysates, as determined by TPP-MS. (d) Lactate mediated thermostability changes to UBE2C following treatment with lactate in HeLa S3 lysates, as determined by immunoblotting. Representative blot from three experiments shown. (e) Workflow for isolation of pro-metaphase APC/C. (f) IP of pro-metaphase APC(CDC27) following 15 mM lactate treatment in cell lysates in the presence of exogenous UBE2C demonstrates lactate-mediated binding of UBE2C, cyclin B1, and securin to pro-metaphase APC/C. Representative blot from three experiments shown. (g) IP-MS of APC(CDC27) following 15 mM lactate treatment in cell lysates demonstrates lactate-mediated binding of cyclin B1, CDK1, and CDK2. n = 8 cell replicates. (h) IP-MS of APC(CDC27) following lactate treatment in cell lysates demonstrates lack of effect on interaction with MCC. n = 8 cell replicates. (i) Model of APC/C remodeling to accommodate UBE2C binding following exposure to elevated lactate. Schematics based on published structures of APC/C in closed and open conformations,. (two-tailed Student’s t-test for pairwise comparisons in g). Data are mean ± s.e.m.
Figure 2:
Figure 2:. Lactate regulates APC/C composition through SUMOylation of APC4.
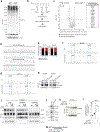
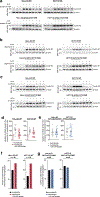
(a) IP-MS of APC(CDC27) following lactate treatment in cell lysates. n = 8 cell replicates. (b) MS quantification of change in SUMO2/3 (SUMO) associated with APC/C protein(s) following exposure to lactate in cell lysates. n = 8 cell replicates. (c) SUMO2/3 immunoblot of immunopurified APC(CDC27) following lactate treatment in cell lysates. Immunoreactive band indicated at the M.W. of SUMOylated APC4. Representative blot from three experiments shown. (d) SUMO2/3 immunoblot of immunopurified APC4 following lactate treatment in cell lysates. Representative blot from two experiments shown. (e) SUMO2/3 immunoblot of immunopurified APC4 following lactate treatment in intact cells for 4 h. (right panel) Densitometry analysis of immunoblots. NaL: sodium lactate; LA: lactic acid. Representative blot from four experiments shown. (f) SUMO2/3 immunoblot of immunopurified APC4 following D-lactate, pyruvate, or L-lactate treatment in cell lysates. Representative blot from three experiments shown. (g,h) SUMO2/3 immunoblot of immunopurified APC4 from (g) HCT116 & (h) HeLa S3 WT, KO, and cells engineered to express APC4 lacking lysine at residue 772 and 798, all conditions are following lysate treatment with 15 mM lactate. (i) IP of pro-metaphase APC(CDC27) following lactate treatment in cell lysates demonstrates lactate-mediated binding of UBE2C to pro-metaphase APC/C requires APC4 SUMO2/3 targets K772 and K798. Representative blot from three experiments shown. (j) Model of APC/C remodeling to accommodate UBE2C binding following lactate-mediated stabilization of SUMO2/3 on APC/C. Schematics based on published structures of APC/C in closed and open conformations, with and without SUMOylation. (two-tailed Student’s t-test for pairwise comparisons in b, one-way ANOVA for multiple comparisons in e). ANOVA analyses were subjected to Bonferroni’s post hoc test. Data are mean ± s.e.m.
Figure 3:
Figure 3:. Lactate forms a complex with zinc in the SENP1 active site to inhibit APC4 deSUMOylation.
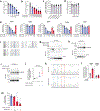
(a) SUMO2/3 immunoblot of immunopurified APC4 from WT and SENP1KO cells. Representative blot from four experiments shown. (b) IP of pro-metaphase APC(CDC27) in WT and SENP1KO cells in the presence of exogenous UBE2C. Representative blot from three experiments shown. (c) Molecular model of favorable binding mode of zinc in the human SENP1 active site. (d) Intensity reduction as a function of residue number after addition of 100 μM zinc and 1 mM L-lactate to SENP1, compared to zinc alone. (e) SENP1 (2IYC) color-coded according to peak intensity reduction caused by lactate-potentiated zinc-binding compared to zinc alone. (f) Quantification of effect of lactate, D-lactate, or pyruvate on zinc binding to SENP1 cysteines by MS. zinc alone n=9; zinc+lactate n = 5; other n = 4 independent samples. (g) IC50 of zinc on SENP1 deSUMOylation activity in the presence and absence of lactate. n = 6 independent samples. (h) Effect of monocarboxylates on zinc-mediated inhibition of SENP1 deSUMOylation activity. n = 6; pyruvate n =5 independent samples. (i) Molecular model of favorable binding mode of lactate and zinc in the human SENP1 active site. (j) Effect of ZnSO4 ± lactate on recombinant human WT and N556A SENP1 deSUMOylation activity. n = 5 independent samples. (k) SUMO2/3 immunoblot of immunopurified APC4 following lactate treatment in cellular lysates from SENP1 WT and N556A HCT116 cells. Representative blot from three experiments shown. (one-way ANOVA for multiple comparisons in f,h,j). ANOVA analyses were subjected to Bonferroni’s post hoc test. Data are mean ± s.e.m.
Figure 4:
Figure 4:. Lactate-mediated elevation of APC4-SUMO stimulates mitotic exit and proliferation.
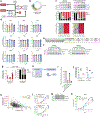
(a) Parallel tracking of securin and cyclin B1 abundance (top), cell cycle phase (middle), and intracellular lactate abundance (bottom) in WT and APC4 K772/798R Hela S3 cells. Cell cycle phase WT n = 3 cell replicates; APC4 K772/798R n = 6 cell replicates; lactate abundance n = 6; WT 2h & WT 8h n = 5. Representative blot from three experiments shown. (b) Mitotic progression beginning with nuclear envelope breakdown (NEBD) to metaphase plate alignment and from metaphase plate alignment to anaphase onset was quantified in WT and APC4 K772/798R cells by timelapse microscopy. HCT116 n = 51; APC4 K772/798R n = 53; HeLa S3 n = 50; APC4 K772/798R = 49 individual cell replicates. (c) Parallel tracking of securin, cyclin B1, and phosphorylated histone H3 (phos-H3S10) abundance in WT, APC4 K772/798R, LMO expressing, and 25 mM DCA treated cells. Representative blot from three experiments shown. (d,e) Mitotic progression, beginning with NEBD to metaphase plate alignment and from metaphase plate alignment to anaphase onset, was quantified in WT, (d; n = 53) LMO expressing and (e) 25 mM DCA treated cells by timelapse microscopy. HeLa S3 n = 46; HeLa S3 + DCA = 49; HCT116 n = 48; HCT116 + DCA n = 48 individual cell replicates. (f,g) Proliferation rate of WT and APC4 K772/798R HCT116 cells treated (f) ± 10 mM DCA (n=6) (g) ± expression of LMO (n=3). n designates cell replicates. (h) Mechanistic model of lactate regulation over cell cycle via inhibition of SENP1. (two-tailed Student’s t-test for pairwise comparisons in a,b,d,e. two-way ANOVA for multiple comparisons involving two independent variables in f,g). ANOVA analyses were subjected to Bonferroni’s post hoc test. Data are mean ± s.e.m.

Comment in

  • Learning the metabolic language of cancer.
    Perez M, Meier JL. Perez M, et al. Nature. 2023 Apr;616(7958):670-671. doi: 10.1038/d41586-023-01024-x. Nature. 2023. PMID: 37072546 No abstract available.
  • Lactate fuels mitosis.
    Dai X, Wei W. Dai X, et al. Mol Cell. 2023 May 18;83(10):1549-1551. doi: 10.1016/j.molcel.2023.04.013. Mol Cell. 2023. PMID: 37207623 Free PMC article.

References

    1. Warburg O. On the origin of cancer cells. Science 123, 309–314, doi: 10.1126/science.123.3191.309 (1956). - DOI - PubMed
    1. Koppenol WH, Bounds PL & Dang CV Otto Warburg’s contributions to current concepts of cancer metabolism. Nature reviews. Cancer 11, 325–337, doi: 10.1038/nrc3038 (2011). - DOI - PubMed
    1. Wang T, Marquardt C. & Foker J. Aerobic glycolysis during lymphocyte proliferation. Nature 261, 702–705, doi: 10.1038/261702a0 (1976). - DOI - PubMed
    1. Brand K, Leibold W, Luppa P, Schoerner C. & Schulz A. Metabolic alterations associated with proliferation of mitogen-activated lymphocytes and of lymphoblastoid cell lines: evaluation of glucose and glutamine metabolism. Immunobiology 173, 23–34, doi: 10.1016/S0171-2985(86)80086-9 (1986). - DOI - PubMed
    1. Munyon WH & Merchant DJ The relation between glucose utilization, lactic acid production and utilization and the growth cycle of L strain fibroblasts. Exp Cell Res 17, 490–498, doi: 10.1016/0014-4827(59)90069-2 (1959). - DOI - PubMed

Publication types