. 2023 May 11;61(5):2202226.
doi: 10.1183/13993003.02226-2022. Print 2023 May.

Monocyte migration profiles define disease severity in acute COVID-19 and unique features of long COVID

Affiliations

Monocyte migration profiles define disease severity in acute COVID-19 and unique features of long COVID

Nicholas A Scott et al. Eur Respir J. .

Abstract

Background: COVID-19 is associated with a dysregulated immune response but it is unclear how immune dysfunction contributes to the chronic morbidity persisting in many COVID-19 patients during convalescence (long COVID).

Methods: We assessed phenotypical and functional changes of monocytes in COVID-19 patients during hospitalisation and up to 9 months of convalescence following COVID-19, respiratory syncytial virus or influenza A. Patients with progressive fibrosing interstitial lung disease were included as a positive control for severe, ongoing lung injury.

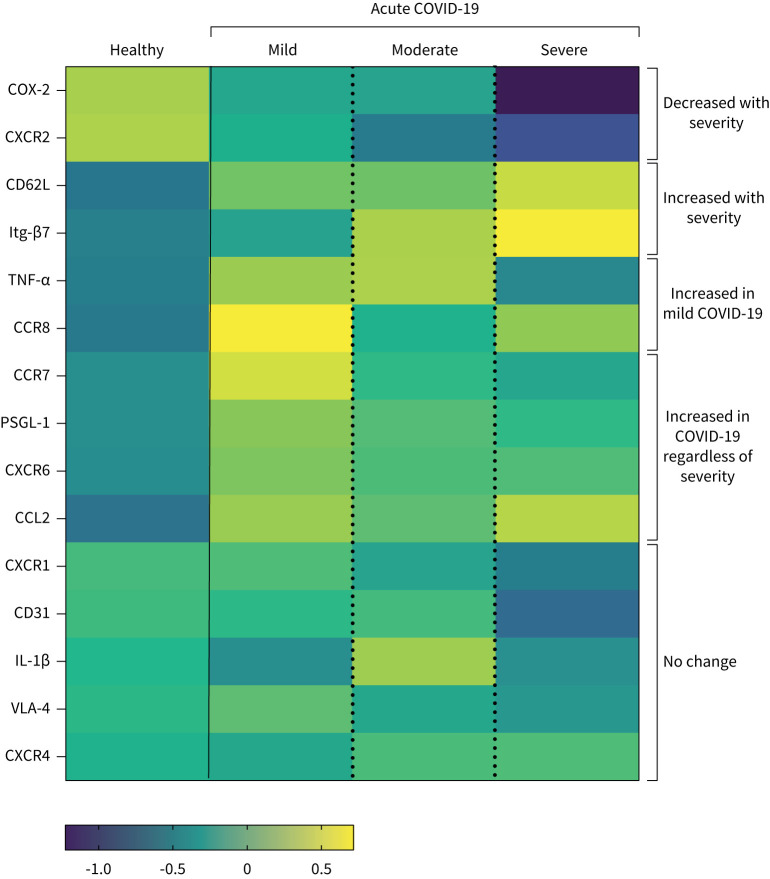
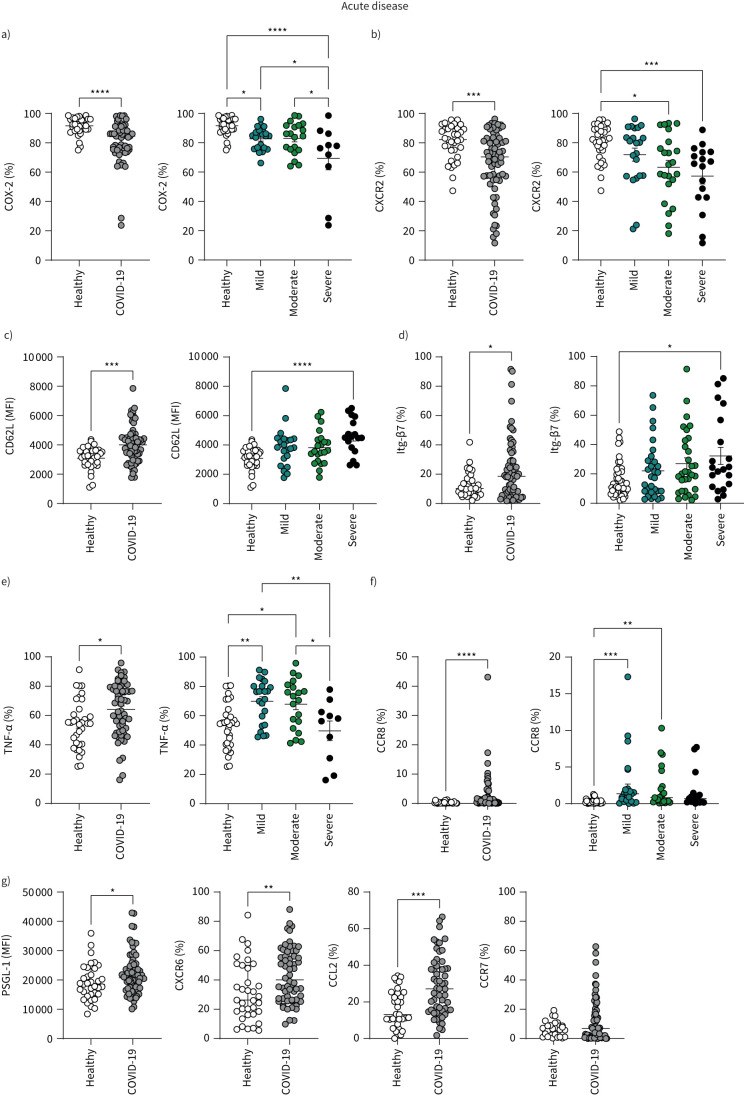
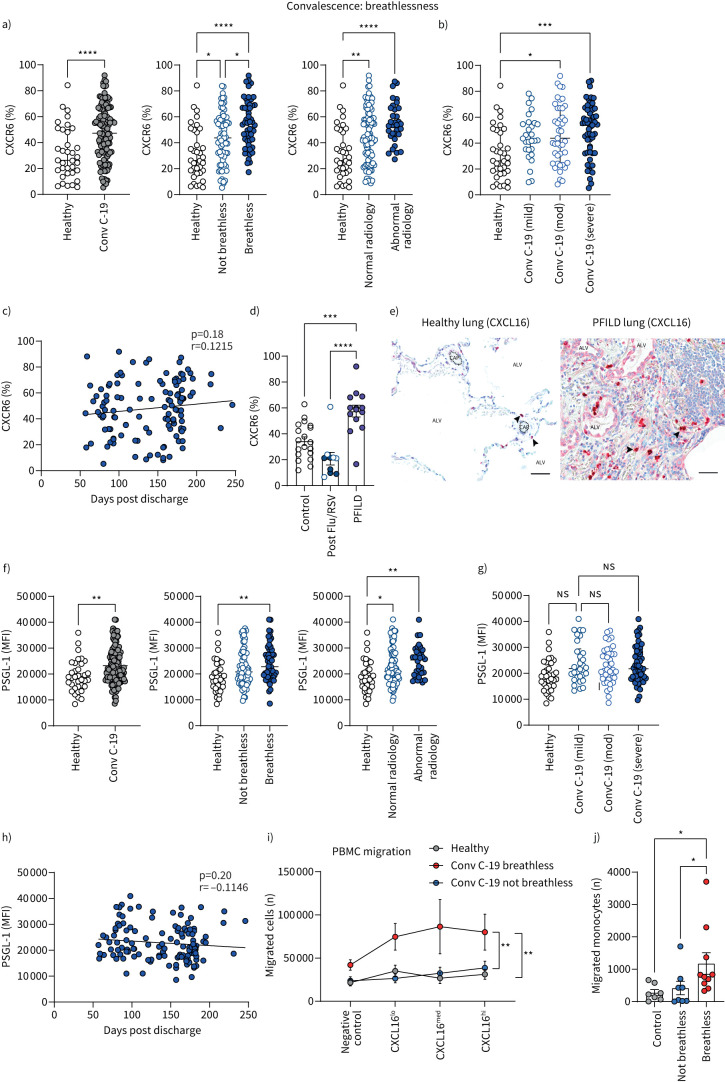
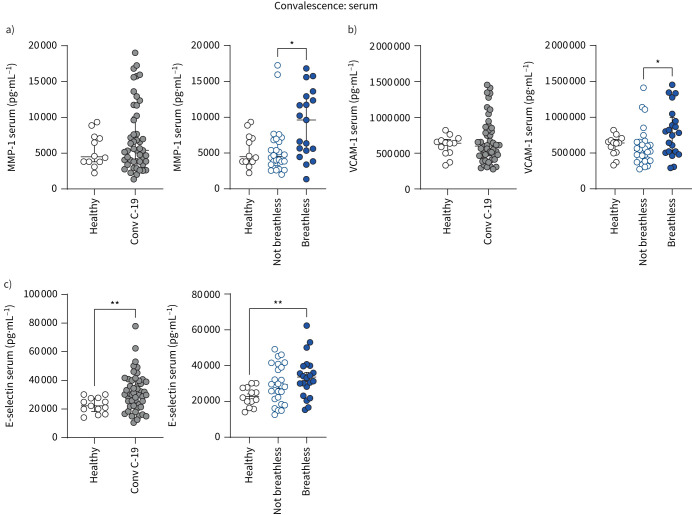
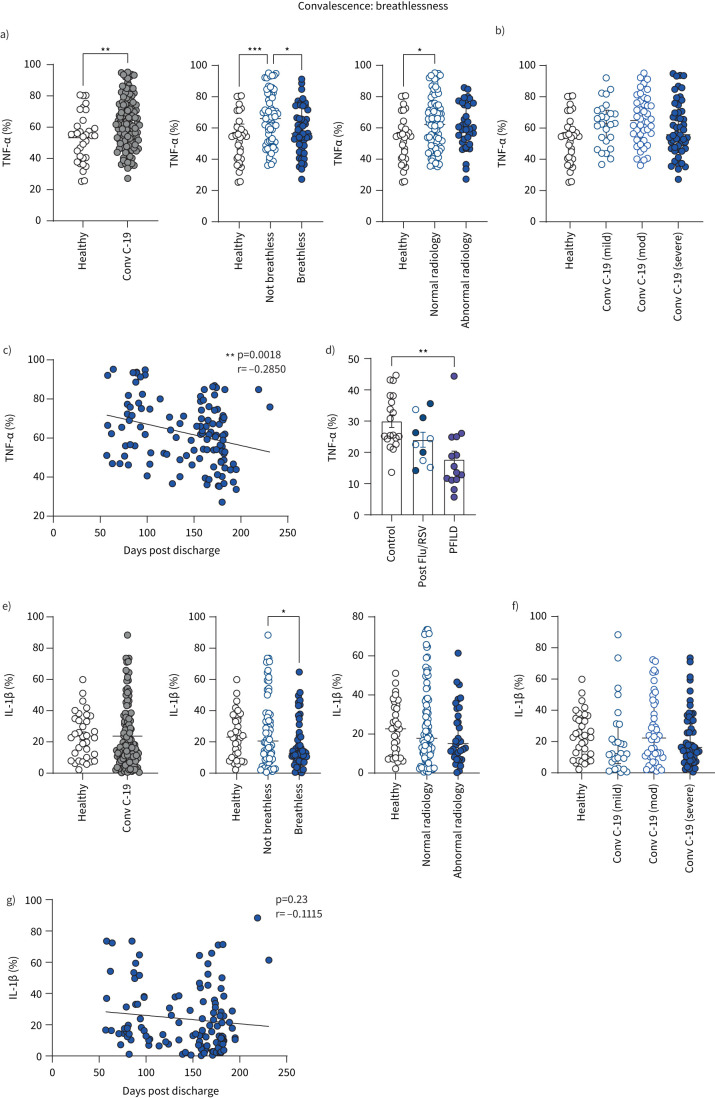
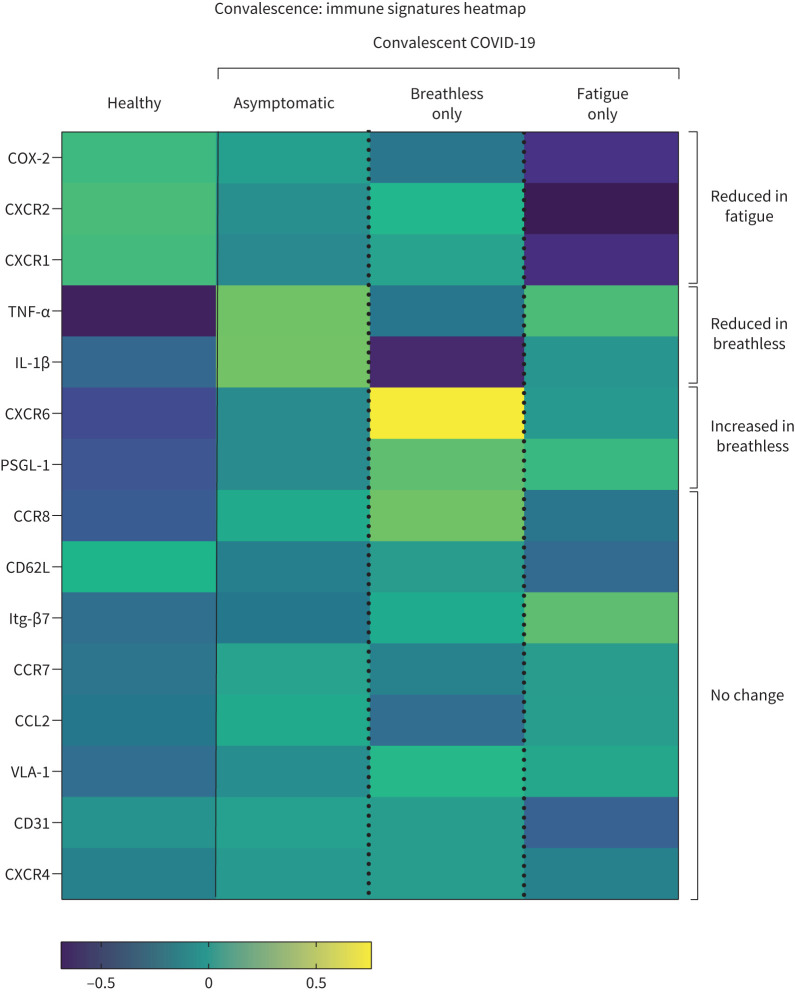
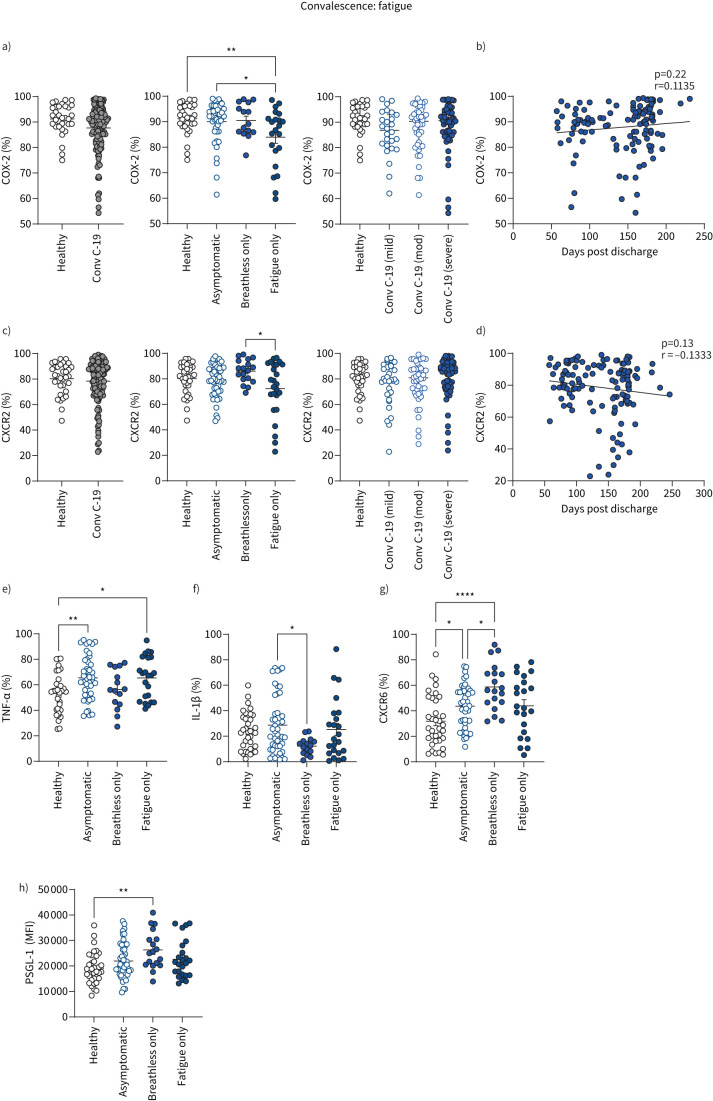
Results: Monocyte alterations in acute COVID-19 patients included aberrant expression of leukocyte migration molecules, continuing into convalescence (n=142) and corresponding with specific symptoms of long COVID. Long COVID patients with unresolved lung injury, indicated by sustained shortness of breath and abnormal chest radiology, were defined by high monocyte expression of C-X-C motif chemokine receptor 6 (CXCR6) (p<0.0001) and adhesion molecule P-selectin glycoprotein ligand 1 (p<0.01), alongside preferential migration of monocytes towards the CXCR6 ligand C-X-C motif chemokine ligand 16 (CXCL16) (p<0.05), which is abundantly expressed in the lung. Monocyte CXCR6 and lung CXCL16 were heightened in patients with progressive fibrosing interstitial lung disease (p<0.001), confirming a role for the CXCR6-CXCL16 axis in ongoing lung injury. Conversely, monocytes from long COVID patients with ongoing fatigue exhibited a sustained reduction of the prostaglandin-generating enzyme cyclooxygenase 2 (p<0.01) and CXCR2 expression (p<0.05). These monocyte changes were not present in respiratory syncytial virus or influenza A convalescence.

Conclusions: Our data define unique monocyte signatures that define subgroups of long COVID patients, indicating a key role for monocyte migration in COVID-19 pathophysiology. Targeting these pathways may provide novel therapeutic opportunities in COVID-19 patients with persistent morbidity.


Conflict of interest statement

Conflict of interest: G. Lindergard is co-founder and scientific advisory board member of Gritstone Bio Inc., which is a public company that develops therapeutic vaccines for the treatment of cancer and infectious diseases, including COVID-19. The other authors declare that they have no competing interests.

Figures

FIGURE 1
FIGURE 1
Summary of distinct monocyte profiles in patients with acute COVID-19. Heatmap of indicated immune parameters by row. Each column represents average (mean) Z-scores for each parameter calculated from individual values of expression by monocytes from healthy individuals or patients with mild, moderate or severe COVID-19 as separate groups. Heatmap was generated as a visual guide, using a subset of individuals from each group to include all individuals per group with results for every immune parameter analysed (i.e. individuals where samples were used for surface staining for all migration molecules, and microbial stimulation assays for cytokine and COX-2 readouts). Healthy individuals, n=25; mild COVID-19, n=13; moderate COVID-19, n=14; severe COVID-19, n=7.
FIGURE 2
FIGURE 2
Monocyte profiles of patients with acute COVID-19. Summary graphs showing data from healthy individuals and all COVID-19 patients. Patients with COVID-19 were also stratified into mild, moderate and severe disease groups. a) Frequencies of CD14+ monocytes expressing COX-2 following lipopolysaccharide (LPS) stimulation, from healthy individuals (n=32) and all patients with acute COVID-19 (n=56). Disease stratification: mild (n=23), moderate (n=20) and severe (n=10). b) Frequencies of CD14+ monocytes expressing CXCR2 from healthy individuals (n=34) and all patients with acute COVID-19 (n=66). Disease stratification: mild (n=22), moderate (n=23) and severe (n=17). c) CD14+ monocyte L-selectin (CD62L) expression levels as determined by mean fluorescence intensity (MFI) in healthy individuals (n=33) and all patients with acute COVID-19 (n=65). Disease stratification: mild (n=22), moderate (n=22) and severe (n=17). d) Frequencies of CD14+ monocytes expressing integrin β7 (Itg-β7) from healthy individuals (n=35) and all patients with acute COVID-19 (n=67). Disease stratification: mild (n=23), moderate (n=23) and severe (n=16). e) Frequencies of CD14+ monocytes producing TNF-α following LPS stimulation, from healthy individuals (n=34) and all patients with acute COVID-19 (n=55). Disease stratification: mild (n=23), moderate (n=20) and severe (n=10). f) Frequencies of CD14+ monocytes expressing CCR8 from healthy individuals (n=33) and all patients with acute COVID-19 (n=66). Disease stratification: mild (n=22), moderate (n=23) and severe (n=17). g) CD14+ monocyte expression levels of PSGL-1 and frequencies of monocytes expressing CXCR6, CCL2 and CCR7 in healthy individuals (PSGL-1: n=35; CXCR6: n=35; CCL2: n=33; CCR7: n=31) and all patients with acute COVID-19 (PSGL-1: n=66; CXCR6: n=60; CCL2: n=57; CCR7: n=66). Graphs show individual patient data with bar representing mean±sem (a, c, e) or median±interquartile range (b, d, f, g). Comparison of groups was carried out using unpaired t-test (a, c, e: healthy versus COVID-19), Mann–Whitney test (b, d, f, g: healthy versus COVID-19), one-way ANOVA with Holm–Sidak post hoc test (a, c, e: COVID-19 severity) or Kruskal–Wallis with Dunn's post hoc test (b, d, f: COVID-19 severity). *: p≤0.05; **: p≤0.01; ***: p≤0.001; ****: p≤0.0001.
FIGURE 3
FIGURE 3
Serum profiles of patients with acute COVID-19. Levels of systemic a) CCL5, CXCL2, CXCL16; b) soluble CD31 (sCD31); c) VCAM-1, CXCL1, CXCL10; and d) MMP-1 were measured in the serum from healthy individuals (n=13) and COVID-19 patients (n=24) using Luminex assays. a, d) Patients with COVID-19 were also stratified into mild (n=11) and moderate/severe disease (n=13). Graphs show individual patient data with bars representing mean±sem. Comparison of groups was carried out using unpaired t-test (b, c: healthy versus COVID-19) or one-way ANOVA with Holm–Sidak post hoc test (a, d: COVID-19 severity). *: p≤0.05; **: p≤0.01; ***: p≤0.001.
FIGURE 4
FIGURE 4
Monocyte migratory profiles of patients with long COVID with unresolved lung injury. a) Frequencies of CD14+ monocytes expressing CXCR6 from healthy individuals (n=35) and all convalescent COVID-19 patients (Conv C-19) (n=127). Patients with convalescent COVID-19 were also stratified into breathless (n=52), not breathless (n=71), normal radiology (n=91) and abnormal radiology (n=33). b) Patients with convalescent COVID-19 were also stratified into mild (n=28), moderate (n=43) or severe (n=56) disease referring to their acute COVID-19 severity during previous hospital admission. c) Correlation of CXCR6 (percentage of monocytes expressing CXCR6) with number of days since hospital discharge in all convalescent COVID-19 patients (n=122). d) Frequencies of CD14+ monocytes expressing CXCR6 in a different cohort of healthy individuals (n=19), all convalescent influenza A (flu)/respiratory syncytial virus (RSV) patients (n=10) and all progressive fibrosing interstitial lung disease (PFILD) patients (n=14). Patients with convalescent flu/RSV were stratified into breathless (n=5, filled circles) and not breathless (n=5, open circles) within the same group. e) Human lung tissue sections. Healthy human lung (left): alveoli can be seen with occasional CXCL16-expressing immune cells (black arrows) proximal to capillaries (dashed lines). Right shows human idiopathic pulmonary fibrosis lung, with extracellular matrix replacing normal lung architecture. CXCL16-expressing immune cells are present within blood vessels (black arrows). CXCL16 is also seen in the epithelium of damaged alveoli and stromal cells. Counterstained with toluidine blue. Scale bars: 50 µm. ALV: alveoli; CAP: capillary. f) CD14+ monocyte expression level of PSGL-1 as determined by mean fluorescence intensity (MFI) from healthy individuals (n=35) and all convalescent COVID-19 patients (n=130). Patients with convalescent COVID-19 were also stratified into breathless (n=54), not breathless (n=74), normal radiology (n=95) and abnormal radiology (n=32). g) Patients with convalescent COVID-19 were also stratified into mild (n=30), moderate (n=43) or severe (n=57) disease, referring to their acute COVID-19 severity during previous hospital admission. h) Correlation of PSGL-1 (levels of expression as determined by MFI) with number of days since hospital discharge in all convalescent COVID-19 patients (n=130). i) Numbers of migrated peripheral blood mononuclear cells (PBMCs) as counted in the bottom of a Boyden chamber in media only (negative control), 0.1 µg·mL−1 CXCL16 (CXCL16lo), 0.5 µg·mL−1 CXCL16 (CXCL16med) and 1 µg·mL−1 CXCL16 (CXCL16hi) following 4 h incubation, starting with 2×10⁵ cells in the top chamber in all cases (healthy controls: n=10; breathless convalescent COVID-19: n=10; not breathless convalescent COVID-19: n=10). Graph shows combined patient data with mean±sem of each group, under each condition. j) Numbers of migrated monocytes identified by flow cytometry as CD45+ live CD19CD3CD66bHLA-DR+CD64+CD14+ from migrated cells in the bottom of a Boyden chamber in CXCL16hi conditions (1 µg·mL−1 CXCL16) (healthy controls: n=7; breathless convalescent COVID-19: n=10; not breathless convalescent COVID-19: n=8). All graphs other than c and i show individual patient data with bars representing median±interquartile range. Comparison of groups was carried out using Mann–Whitney test (a, f: healthy versus convalescent COVID-19), Kruskal–Wallis with Dunn's post hoc test (a, b, d, f, g, j), Spearman's rank correlation coefficient test (c, h) or one-way ANOVA with repeated measures and Holm–Sidak post hoc test (i). *: p≤0.05; **: p≤0.01; ***: p≤0.001; ****: p≤0.0001.
FIGURE 5
FIGURE 5
Serum profiles of patients with long COVID with unresolved lung injury. Levels of systemic a) MMP-1, b) VCAM-1 and c) E-selectin were measured in the serum from healthy individuals (n=12) and convalescent COVID-19 (Conv C-19) patients (n=48) using Luminex assays. Patients with convalescent COVID-19 were also stratified into breathless (MMP-1: n=19; VCAM-1: n=21; E-selectin: n=21) and not breathless (MMP-1: n=26; VCAM-1: n=28; E-selectin: n=26). Graphs show individual patient data with bars representing mean±sem (c) or median±interquartile range (a, b). Comparison of groups was carried out using unpaired t-test (c: healthy versus convalescent COVID-19), Mann–Whitney test (a, b: healthy versus convalescent COVID-19), one-way ANOVA with Holm–Sidak post hoc test (c: breathlessness) or Kruskal–Wallis with Dunn's post hoc test (a, b: breathlessness). *: p≤0.05; **: p≤0.01.
FIGURE 6
FIGURE 6
Monocyte cytokine profiles of patients with long COVID-19 with unresolved lung injury. a) Frequencies of CD14+ monocytes producing TNF-α from healthy individuals (n=33) and all convalescent (Conv C-19) COVID-19 patients (n=122). Patients with convalescent COVID-19 were also stratified into breathless (n=49), not breathless (n=67), normal radiology (n=87) and abnormal radiology (n=35). b) Patients with convalescent COVID-19 were also stratified into mild (n=26), moderate (n=44) or severe disease (n=52), referring to their acute COVID-19 severity during previous hospital admission. c) Correlation of TNF-α (percentage of monocytes producing TNF-α) with number of days since hospital discharge in all convalescent COVID-19 patients (n=117). d) Frequencies of CD14+ monocytes producing TNF-α in a different cohort of healthy individuals (n=19), all convalescent influenza A (flu)/respiratory syncytial virus (RSV) patients (n=10) and all progressive fibrosing interstitial lung disease (PFILD) patients (n=14). Patients with convalescent flu/RSV were stratified into breathless (n=5, filled circles) and not breathless (n=5, open circles) within the same group. e) Frequencies of CD14+ monocytes producing IL-1β from healthy individuals (n=34) and all convalescent COVID-19 patients (n=122). Patients with convalescent COVID-19 were also stratified into breathless (n=49), not breathless (n=68), normal radiology (n=87) and abnormal radiology (n=34). f) Patients with convalescent COVID-19 were also stratified into mild (n=26), moderate (n=44) or severe (n=52) disease, referring to their acute COVID-19 severity during previous hospital admission. g) Correlation of IL-1β (percentage of monocytes producing IL-1β) with number of days since hospital discharge in all convalescent COVID-19 patients (n=118). All graphs show individual patient data with bars representing mean±sem (a, b) or median±interquartile range (e, f). Comparison of groups was carried out using unpaired t-test (a: healthy versus convalescent COVID-19), Mann–Whitney test (e: healthy versus convalescent COVID-19), one-way ANOVA with Holm–Sidak post hoc test (a, b), Kruskal–Wallis with Dunn's post hoc test (d, e, f), Pearson correlation coefficient test (c) or Spearman's rank correlation coefficient test (g). *: p≤0.05; **: p≤0.01; ***: p≤0.001.
FIGURE 7
FIGURE 7
Summary of distinct monocyte profiles in subsets of patients with long COVID. Heatmap of indicated immune parameters by row. Each column represents average (mean) Z-scores for each parameter calculated from individual values of expression by monocytes from healthy individuals or convalescent COVID-19 patients without breathlessness or fatigue (asymptomatic), with breathlessness but not fatigue (breathless) and with fatigue but not breathlessness (fatigue) as separate groups. Heatmap was generated as a visual guide, using a subset of individuals from each group to include all individuals per group with results for every immune parameter analysed (i.e. individuals where samples were used for surface staining for all migration molecules, and microbial stimulation assays for cytokine and COX-2 readouts). Healthy individuals (n=25), asymptomatic (n=29), breathless (n=13), fatigue (n=16).
FIGURE 8
FIGURE 8
Monocyte profiles of patients with long COVID with fatigue. Summary graphs showing data from healthy individuals and all convalescent COVID-19 patients. a) Frequencies of CD14+ monocytes expressing COX-2 from healthy individuals (n=32) and all convalescent COVID-19 (Conv C-19) patients (n=121). Patients with convalescent COVID-19 were also stratified into asymptomatic (no breathlessness or fatigue: n=45), breathless only (breathless but not fatigued: n=15) or fatigue only (fatigued but not breathless: n=22) and into mild (n=26), moderate (n=44) or severe (n=52) disease, referring to acute COVID-19 severity during previous hospital admission (for all convalescent patients). b) Correlation of COX-2 (percentage of monocytes expressing COX-2) with number of days since hospital discharge, in all convalescent COVID-19 patients (n=122). c) Frequencies of CD14+ monocytes expressing CXCR2 from healthy individuals (n=34) and all convalescent COVID-19 patients (n=133). Patients with convalescent COVID-19 were also stratified into asymptomatic (n=51), breathless only (n=18) or fatigue only (n=25) and into mild (n=30), moderate (n=44) or severe (n=59) disease, referring to acute COVID-19 severity during previous hospital admission (for all convalescent patients). d) Correlation of CXCR2 (percentage of monocytes expressing CXCR2) with number of days since hospital discharge in all convalescent COVID-19 patients (n=128). e) Frequency of CD14+ monocytes producing TNF-α in healthy individuals (n=33) and convalescent COVID-19 patients stratified into asymptomatic (n=45), breathless only (n=15) or fatigue only (n=23). f) Frequency of CD14+ monocytes producing IL-1β in healthy individuals (n=34) and convalescent COVID-19 patients stratified into asymptomatic (n=45), breathless only (n=15) or fatigue only (n=23). g) Frequency of CD14+ monocytes expressing CXCR6 in healthy individuals (n=35) and convalescent COVID-19 patients stratified into asymptomatic (n=45), breathless only (n=19) or fatigue only (n=22). h) CD14+ monocyte levels of expression of PSGL-1 as determined by mean fluorescence intensity (MFI) in healthy individuals (n=35) and convalescent COVID-19 patients stratified into asymptomatic (n=50), breathless only (n=18) or fatigue only (n=24). All graphs show individual patient data with bars representing mean±sem. Comparison of groups was carried out using unpaired t-test (a, c: healthy versus convalescent COVID-19), one-way ANOVA with Holm–Sidak post hoc test (a, c, e-h: long COVID symptoms, original severity) or Pearson correlation coefficient test (b, d). *: p≤0.05; **: p≤0.01; ***: p≤0.001; ****: p≤0.0001.

Comment in

  • Long COVID: clues about causes.
    Liew F, Efstathiou C, Openshaw PJM. Liew F, et al. Eur Respir J. 2023 May 11;61(5):2300409. doi: 10.1183/13993003.00409-2023. Print 2023 May. Eur Respir J. 2023. PMID: 36958743 Free PMC article.

References

    1. World Health Organization . World Health Organization (COVID-19) Dashboard. https://covid19.who.int/ Date last accessed: 13 April 2023.
    1. Huang C, Wang Y, Li X, et al. . Clinical features of patients infected with 2019 novel coronavirus in Wuhan, China. Lancet 2020; 395: 497–506. doi: 10.1016/s0140-6736(20)30183-5 - DOI - PMC - PubMed
    1. Mann ER, Menon M, Knight SB, et al. . Longitudinal immune profiling reveals key myeloid signatures associated with COVID-19. Sci Immunol 2020; 5: eabd6197. doi:10.1126/sciimmunol.abd6197 - DOI - PMC - PubMed
    1. Melms JC, Biermann J, Huang H, et al. . A molecular single-cell lung atlas of lethal COVID-19. Nature 2021; 595: 114–119. doi:10.1038/s41586-021-03569-1 - DOI - PMC - PubMed
    1. Szabo PA, Dogra P, Gray JI, et al. . Longitudinal profiling of respiratory and systemic immune responses reveals myeloid cell-driven lung inflammation in severe COVID-19. Immunity 2021; 54: 797–814. doi:10.1016/j.immuni.2021.03.005 - DOI - PMC - PubMed