Review
. 2023 Aug;33(3):336-386.
doi: 10.1016/j.zemedi.2023.01.005. Epub 2023 Mar 13.

Overview of Ultrasound in Dentistry for Advancing Research Methodology and Patient Care Quality with Emphasis on Periodontal/Peri-implant Applications

Affiliations
Review

Overview of Ultrasound in Dentistry for Advancing Research Methodology and Patient Care Quality with Emphasis on Periodontal/Peri-implant Applications

Amanda Rodriguez Betancourt et al. Z Med Phys. 2023 Aug.

Abstract

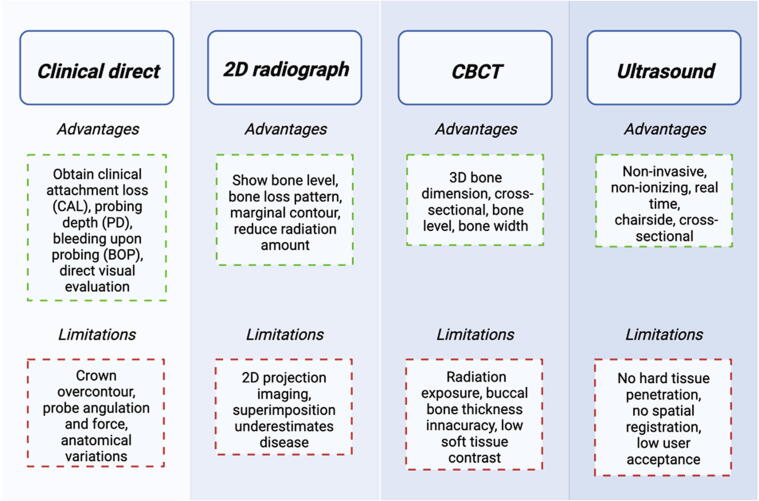
Background: Ultrasound is a non-invasive, cross-sectional imaging technique emerging in dentistry. It is an adjunct tool for diagnosing pathologies in the oral cavity that overcomes some limitations of current methodologies, including direct clinical examination, 2D radiographs, and cone beam computerized tomography. Increasing demand for soft tissue imaging has led to continuous improvements on transducer miniaturization and spatial resolution. The aims of this study are (1) to create a comprehensive overview of the current literature of ultrasonic imaging relating to dentistry, and (2) to provide a view onto investigations with immediate, intermediate, and long-term impact in periodontology and implantology.

Methods: A rapid literature review was performed using two broad searches conducted in the PubMed database, yielding 576 and 757 citations, respectively. A rating was established within a citation software (EndNote) using a 5-star classification. The broad search with 757 citations allowed for high sensitivity whereas the subsequent rating added specificity.

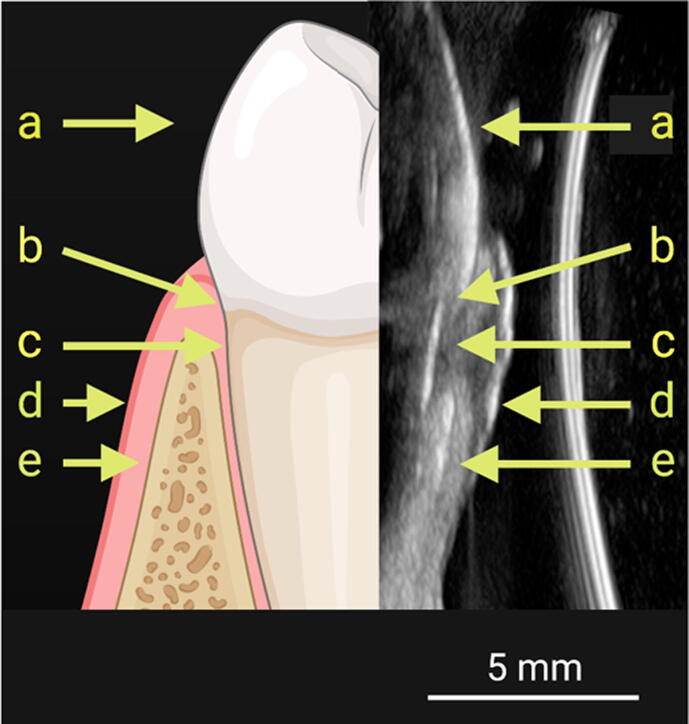
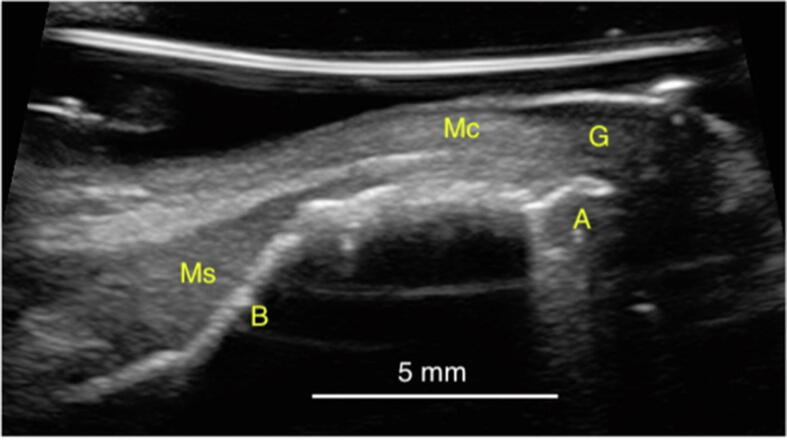
Results: A critical review of the clinical applications of ultrasound in dentistry was provided with a focus on applications in periodontology and implantology. The role of ultrasound as a developing dental diagnostic tool was reviewed. Specific uses such as soft and hard tissue imaging, longitudinal monitoring, as well as anatomic and physiological evaluation were discussed.

Conclusions: Future efforts should be directed towards the transition of ultrasonography from a research tool to a clinical tool. Moreover, a dedicated effort is needed to introduce ultrasonic imaging to dental education and the dental community to ultimately improve the quality of patient care.

Keywords: Dental; Diagnosis; Imaging; Implant; Periodontal; Ultrasound.


Figures

Figure 1
Figure 1
Clinical measurements of inflammation. Panels (a) and (b) show clinical attachment loss (CAL), gingival margin (GM) and probing depth (PD). Panel (c) shows bleeding on probing around natural tooth structure.
Figure 2
Figure 2
Left: Common image plane orientations used in dentistry. Right: Anatomical locations with respect to relative proximity within the mouth and to teeth or implants. The space/location between adjacent teeth is called interproximal. Facing an individual tooth, one differentiates the left versus the right interproximal space as mesial or distal. The mesial side is the one that is closer to the midline, whereas the side farther away from the midline is thus called distal.
Figure 3
Figure 3
Diagnostic tools currently available in dentistry. So called (clinical) direct measurements are recognized, invasive, gold standard with potential for user bias. Radiographs yield projection images of, limited-view, oral sections at high spatial resolution. Cone beam CT is an advanced imaging technique for excellent, full-mouth, 3D depiction of bone, roots, and crowns. Ultrasound is an excellent, high-contrast, soft tissue imaging technique without ionizing radiation. Note that, despite ultrasound being available, its use in dentistry is still rare.
Figure 4
Figure 4
Application specific intraoral ultrasound transducer. Linear array, 128 elements, 18 MHz center frequency. Left: Front view (top: A) without protective sheath and (bottom: B) with sheath for clinical use. Right: In situ sagittal positioning for imaging across the gingiva to the crown.
Figure 5
Figure 5
Left: Tooth illustration with annotated features: (a) crown, (b) cementoenamel junction, (c) root, (d) soft tissue, and (e) bone. The right image is a cross-sectional ultrasound view of a tooth along with the supporting structures. The image orientation is mirrored to the illustration and the same features are labeled. Note: All shown images are, unless otherwise stated, recorded using the transducer in Table 3, using second harmonic (12/24 MHz) compound imaging. The ultrasound wave originates on the right side and images the tooth, root, bone, and soft tissue similarly to Figure 4.
Figure 6
Figure 6
Example image for blood flow visualization using color flow mode of a peri-implantitis case from an occlusal view. Red and blue hue pixels are superimposed to gray B-mode pixels, where detected velocities exceed a wall filter setting. Typically, velocities towards the transducer are labeled as positive and depicted in red/yellow. Blue/cyan pixels are labeled as negative and away from the transducer. Annotations: implant (Imp), buccal (B), palatal (P), occlusal (O), apical (A) soft tissue (ST), crestal bone (CB).
Figure 7
Figure 7
Examples of ultrasonography for imaging in dentistry. While the diagnostic assessment offers the general utility, other uses are attractive due to the non-ionizing and real-time characteristics of ultrasound, those include dynamic assessment, intraoperative and longitudinal healing assessment.
Figure 8
Figure 8
Top: In situ B-mode image of mucosa covering maxillary suture (E: epithelium 270 μm, HE: hypo-echoic 149 µm, SE: subepithelium 630 μm). Bottom: Tissue mimicking Zerdine® Hydrogel from CIRS with additional epithelial layer.
Figure 9
Figure 9
Periodontal ultrasound phantom based on an off-the-shelf CBCT phantom plus a tissue mimicking periodontal and peri-implant, soft tissue layer Zerdine® Hydrogel (CIRS Inc., Norfolk VA, USA).
Figure 10
Figure 10
The texture of B-mode images can change for changing tissues. Muscle (Ms), mucosa (Mc) and gingiva (G) exhibit different brightness and texture in the example shown. Note: Jawbone (B) and abutment (A) are shown by their surface reflections.
Figure 11
Figure 11
Anatomical soft and hard tissue assessment for implant placement. Left: Occlusal, mid edentoulous crest, B-mode image showing the bone, and soft tissue. Middle: Annotations of hard tissue (bone crest, BC) and soft tissue (sufficient tissue release, STR). Right: enlarged area of middle panel (green frame) of landmarks for presurgical assessment crestal, e.g., crestal soft tissue height (CSTH) and crestal bone surface (CBS).
Figure 12
Figure 12
Anatomical soft and hard tissue assessment for implant planning. Left: B-mode image showing the sagittal facial bone contour and surface quality and soft tissue composition/locations. Soft tissue thins toward the crest (right side of the image), becoming thicker progressively toward left, i.e., the apical direction. Thickness has clinical implications for surgical tissue management. The muscle layer location and tension, which could impede wound stability, can be evaluated on ultrasound. Middle: Annotations of hard and soft tissue and landmarks for presurgical assessment, soft tissue surface (STS), bone crest (BC), and bone. Right: Enlarged area of middle panel (green frame) soft tissue thickness (STT), crestal soft tissue height (CSTH), and bone crest (BC).
Figure 13
Figure 13
Demonstration of ultrasound imaging modes (B-mode, Color Velocity, and Color Power) for three clinical cases: Peri-implantitis case (top), Peri-implant mucositis (middle), and Peri-implant health (bottom). Color velocity and color power change with relative blood velocity and tissue perfusion, respectively, and thus potentially serve as a quantitative indicator for the degree of inflammation. Color velocity images displayed red and blue colors, correspond to the velocity (speed) of the blood flows. Color Power displayed as a single hue of red and shows the amount of blood flowing within the images in the field of view. Note differences of amount of blood flow between the healthy, mucositis and peri-implantitis cases.
Figure 14
Figure 14
Examples of early wound stability assessment with ultrasound in a 10-day guided bone regeneration follow-up. Top (sagittal/facial view): Left: B-mode with (top to bottom) annotations of soft tissue, membrane (hyperechoic line beneath the soft tissue), bone graft, bone crest (BC, hyperechoic line beneath bone graft), and muscle (M). Middle left: Same B-mode image, but with high-lighted regions to verify sufficient tissue stress release (STR) and stable biomaterials (Stable Bm). Middle right: Same B-mode image but with color flow to verify sufficient tissue perfusion (TP) displayed as red and blue colors, corresponding to velocity (speed) which the blood flows at. Right: Same B-mode image but with color power to verify TP displayed as a single hue of red and shows the amount of blood flowing within the color field of view. Bottom: Same principal images, now recorded from the occlusal view. In addition to the previous elements, now the surgical incision line is also shown (left). Adjacent to it one can find the wound edge (middle left). Its healing progress can be monitored using color flow (middle right) and color power (right). Near the incision line, both, color flow and power display a zone without detectable blood flow.
Figure 15
Figure 15
An example of longitudinal use of ultrasound. Stage I, diagnostic tool for periodontal disease - bone crest location, spatial dimension, and inflammation quantification. Stage II, wound healing monitoring after extraction and socket preservation procedure - soft and hard tissue assessment. Stage III, intraoperative use for implant position for predictable treatment outcome. Stage IV, monitoring tool for healing assessment and multiple time point follow-up. Stage V, monitoring tool for continued assessment can aid in early intervention of disease to avoid tissue and eventual implant loss.
Figure 16
Figure 16
Intraoperative assessment during implant placement. Top: Sagittal/midfacial B-mode images. Left: Raw ultrasound image for unobstructed view. Middle: Added annotations for soft tissue thickness (STT) and mucosal margin (MM), both relative to bone crest (BC). Adequate STT and MM can ensure functional and aesthetic outcomes. Also shown is the implant-platform-bone crest interface (IPBCI), which is the distance between the buccal bone surface and the drill, thus is informs the surgeon about the buccal bone width. Bottom: Transverse view of the same case. Tissue layers are illustrated for the viewer to appreciate their texture differences on ultrasound as well as their spatial extent. Note: Vertical dashed lines in the Raw B-mode image indicate the relative position of the sagittal and transverse views. Also note that the curvature of the jawbone can lead to fenestration for incorrect angulation of the implant drill. The faint echo of the drill in the transverse view is annotated. Here the drill remains inside the bone but is close enough to the cortical bone, i.e., the bone surface, to be seen on ultrasound.
Figure 17
Figure 17
Anatomical ultrasound B-mode image (24 MHz) of a peri-implantitis case (crown removed). Left: Intraoperative photograph of clinical case of peri-implantitis. Top-right: Moderate bone loss around the implant seen as exposed threads and peri-implantitis lesion (PL) on a sagittal-disto-facial view. The crestal bone surface does not approach the implant at a right-angle, which suggests an infrabony defect. Other anatomical references include: implant abutment (Abt), crown (C), crestal bone (CB), gingiva (G), implant (I), mucosa (Mc), soft tissue (ST), and. Bottom-right: Same general view, but on the mesial side of the implant. Bone loss is seen here as well, but the crestal bone approaches the implant at a right-angle, hence not suggesting an infrabony defect in the mesial side.
Figure 18
Figure 18
Envisioned potential clinical workflow for the use of ultrasonography in periodontal dentistry. The benign nature of ultrasound allows for longitudinal use. The timescale by which soft tissue heals or is expected to heal may also benefit from repeat diagnostic ultrasound scans. Note that not all ultrasound uses would be expected to be longitudinal.

References

    1. Ko T.J., Byrd K.M., Kim S.A. The Chairside Periodontal Diagnostic Toolkit: Past, Present, and Future. Diagnostics (Basel) 2021;11(6) - PMC - PubMed
    1. Nguyen K.T., Pacheco-Pereira C., Kaipatur N.R., Cheung J., Major P.W., Le L.H. Comparison of ultrasound imaging and cone-beam computed tomography for examination of the alveolar bone level: A systematic review. PLoS One. 2018;13(10):e0200596. - PMC - PubMed
    1. Abdinian M., Aminian M., Seyyedkhamesi S. Comparison of accuracy between panoramic radiography, cone-beam computed tomography, and ultrasonography in detection of foreign bodies in the maxillofacial region: an in vitro study. J Korean Assoc Oral Maxillofac Surg. 2018;44(1):18–24. - PMC - PubMed
    1. Vanderstuyft T., Tarce M., Sanaan B., Jacobs R., de Faria Vasconcelos K., Quirynen M. Inaccuracy of buccal bone thickness estimation on cone-beam CT due to implant blooming: An ex-vivo study. J Clin Periodontol. 2019;46(11):1134–1143. - PubMed
    1. Chan H.L., Kripfgans O.D. Ultrasonography for diagnosis of peri-implant diseases and conditions: a detailed scanning protocol and case demonstration. Dentomaxillofac Radiol. 2020;49(7):20190445. - PMC - PubMed

LinkOut - more resources