Meta-Analysis
. 2023 Mar 15;14(1):1438.
doi: 10.1038/s41467-023-36983-2.

An integrated single cell and spatial transcriptomic map of human white adipose tissue

Affiliations
Meta-Analysis

An integrated single cell and spatial transcriptomic map of human white adipose tissue

Lucas Massier et al. Nat Commun. .

Abstract

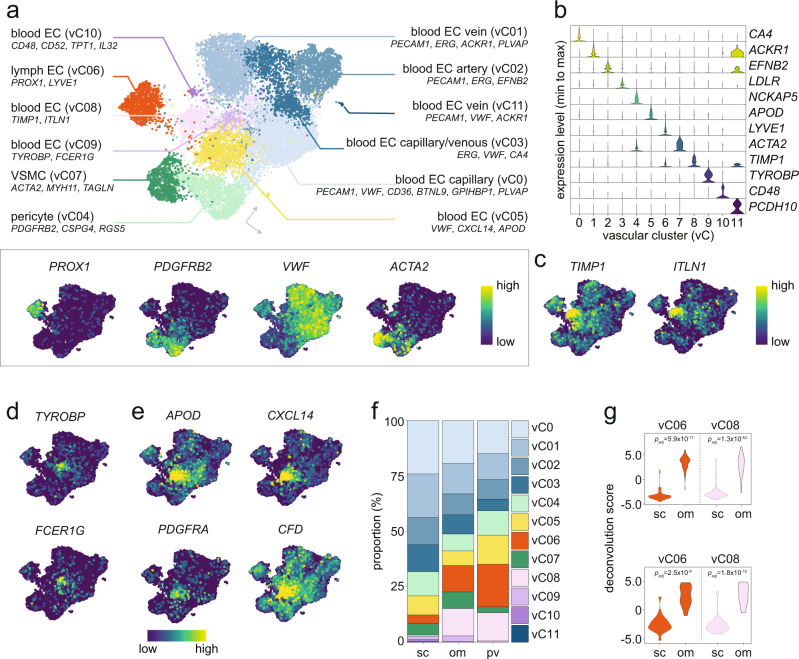
To date, single-cell studies of human white adipose tissue (WAT) have been based on small cohort sizes and no cellular consensus nomenclature exists. Herein, we performed a comprehensive meta-analysis of publicly available and newly generated single-cell, single-nucleus, and spatial transcriptomic results from human subcutaneous, omental, and perivascular WAT. Our high-resolution map is built on data from ten studies and allowed us to robustly identify >60 subpopulations of adipocytes, fibroblast and adipogenic progenitors, vascular, and immune cells. Using these results, we deconvolved spatial and bulk transcriptomic data from nine additional cohorts to provide spatial and clinical dimensions to the map. This identified cell-cell interactions as well as relationships between specific cell subtypes and insulin resistance, dyslipidemia, adipocyte volume, and lipolysis upon long-term weight changes. Altogether, our meta-map provides a rich resource defining the cellular and microarchitectural landscape of human WAT and describes the associations between specific cell types and metabolic states.


Conflict of interest statement

P.L.S. and N.B. are scientific consultants to 10x Genomics, which holds IP rights to the spatial transcriptomics technology. None of the other authors have any conflict of interest to report.

Figures

Fig. 1
Fig. 1. A meta-map to define human WAT composition.
a For each included cohort, number (n) and gender of subjects, age (years) and body mass index (BMI) ranges (min–max) as well as number of objects (cells/nuclei), method (single-nucleus Seq [snSeq], single-cell Seq [scSeq] or spatial transcriptomics [STx]) and Jaccard index are displayed. Massier et al. #1–4 refer to data generated for the present meta-analysis and gray bars (n/a) indicate that no information was obtained. Boxes for age and BMI represent a range (min–max), boxplots are presented as interquartile range plus median and Tukey whiskers. Summarizing statistics are displayed in the right panels as mean ± S.D. b Network displaying nodes (subclusters from each study) and edges (marker gene overlap). Data were distributed into four major classes and named based on prominent marker genes. Node sizes are reflecting cluster proportions. The displayed network does not include results from Hildreth et al., as data from this study overlapped poorly with the others. c, d Cell class proportions comparing c) methods (snSeq vs. scSeq) and d depots (subcutaneous [sc] WAT vs. omental [om] vs. perivascular [pv]). Note that adipocytes are only available by snSeq. Data are shown as mean ± S.D. Statistical differences were calculated by two-sided Mann–Whitney U test between sc (n = 10) and om (n = 4) WAT or scSeq (n = 6) and snSeq (n = 8). Because of fewer cases, no statistics were calculated for adipocytes and pvWAT. e K-nearest-neighbor batch-effect test (kBET) and adjusted Rand index (ARI) for raw or integrated data using the indicated methods displayed according to method, depot, and cohort. BBKNN batch balanced k-nearest neighbors, scVI single-cell variational inference, rPCA reciprocal principal component analysis. Source data are provided as a Source data file.
Fig. 2
Fig. 2. Analyses of the WAT immune cell panorama reveal novel subtypes.
a Nomenclature (upper panel) and expression patterns of selected marker genes (lower panel) for T, NKT, and NK cells (lyC0-10). b Proportions (%) of T, NKT, and NK cells (lyC0-10) in subcutaneous (sc), omental (om), and perivascular (pv) WAT depots. c The enrichment of lyC0 in omental and lyC03 in subcutaneous WAT was supported by deconvolution of bulk transcriptomic data from Arner et al. (left panel) and Krieg et al. (right panel). p values were calculated by two-sided Wilcoxon signed-rank test. d Same visualization as a, but for monocytes and macrophages. e Selected marker gene expression profiles for omental-enriched myC08 and myC12. f Same visualizations as b, but for monocytes and macrophages. g Same as c, but for myC07, myC08, and myC12. DC dendritic cells, diff differentiated, LAM lipid-associated macrophages, MMe metabolic-regulated macrophages, Mo monocytes, Mox redox-regulatory metabolic macrophages, NK natural killer cells, NKT natural killer T cells, Th helper T cells, TREG regulatory T cells, TRM tissue-resident memory T cells. Source data are provided as a Source data file.
Fig. 3
Fig. 3. The vascular cell class contains mixed and intermediate cell states.
a, b Nomenclature and visualizations of selected marker genes for vascular cells (vC0-11), including a UMAPs and b violin plots. ce Multiple UMAPs of marker genes for three subtypes of blood ECs (vC08, vC09, and vC05, respectively). f The proportions (%) of different vascular subtypes in subcutaneous (sc), omental (om), and perivascular (pv) WAT depots. g The proportion of vC06 and vC08 in sc and om depots was supported by deconvolution of bulk transcriptomic data from Arner et al.. (upper panel) and Krieg et al. (lower panel). p values were calculated by two-sided Wilcoxon signed-rank test. EC endothelial cells, VSMC vascular smooth muscle cells. Source data are provided as a Source data file.
Fig. 4
Fig. 4. FAPs display different levels of commitment in human WAT.
a Nomenclature and proportions for subcutaneous FAPs (sfC0-16) including a UMAP with selected marker genes (left panel) and a stacked bar chart displaying the proportion (%) of different subtypes in subcutaneous white adipose tissue (WAT) (right panel). b, c Selected FAP marker gene expression profiles displayed in UMAPs. d Pseudo-time trajectory analysis initiated from the CD55/PI16-enriched cell cluster (sfC02). Two main trajectories were discovered: route 1 (upper) and route 2 (lower). eg CD55+ positive human adipose-derived stem cells were e analyzed by flow-cytometry and f imaged before/after adipogenic induction in vitro. Nuclei are stained by Hoechst (blue) and lipid droplets by BODIPY (green). Experiment was repeated three times with similar results. Scale bar is 20 μm. g deconvolution of bulk RNAseq data from these cells shows how the expression of marker genes for FAP subtypes in panel a vary during adipogenesis (colors are matched in a and g). h Heat map displaying similarities (Jaccard index) of gene expression profiles between inguinal WAT from mice (P1.1 to P4) and subcutaneous FAPs (sfC0-16). Note that human cells displaying overlap with mouse FAPs are only found in route 1. Explanatory legend is visualized in j. i Same as a, but for omental FAPs (ofC0-14). j Same as in h; but for comparisons of subcutaneous and omental human FAPs. k Flow cytometric analysis of CD55+, APOD+, CD74+, and EZR+ FAPs from stromal vascular cells (CD45, CD31 and CD34+) of subcutaneous and omental WAT, respectively. Percentages represent the frequency of all gated live single cells in the representative sample. APC adipose precursor cell, CPA committed preadipocytes, FAP fibroblast and adipogenic progenitor cells, MSL mesothelial-like cells. Source data are provided as a Source data file.
Fig. 5
Fig. 5. Adipocyte snSeq data display inconsistent marker gene overlaps in WAT.
a Single-nucleus sequencing (snSeq) data from Emont et al. (#1) and Massier et al. (#1) were analyzed according to top marker genes for adipocytes, FAPs, vascular, and immune cells, respectively. In comparison with other cell classes, adipocyte marker genes displayed lower fold-changes (left panel) and a limited overlap (right panel). b Representative examples of adipocyte marker genes in subcutaneous WAT displaying overlap between the indicated studies. c Dendrograms of snSeq, bulk RNAseq of isolated mature adipocytes (from the FANTOM5 atlas, and Harms et al.) and spatial transcriptomics (STx) (upper panel). Comparisons of scSeq, snSeq, bulk RNAseq, and STx data of subcutaneous white adipose tissue from the same individual (lower panel). d Heatmap of adipocyte marker genes with a >50-fold enrichment in adipocytes vs. other tissues included in the FANTOM 5 atlas. Results are shown for each study as well as for the combined snSeq data after integration. e Same as in d, but for genes with discordant expression (∣Δz-score∣>5) comparing STx and snSeq data. Source data are provided as a Source data file.
Fig. 6
Fig. 6. FAPs send multiple signals which are received by M2-like macrophages.
a Incoming and outgoing interaction strengths for FAPs/adipocyte, vascular, myeloid, and lymphoid cells in subcutaneous (upper panels) and omental (lower panels) WAT. Selected cell types are indicated. b Subcutaneous (upper) and omental (lower) cell-cell communication predictions for clusters identified in Supplementary Fig. 6a. Lines indicate interactions between cell types where the strength is proportional to the line width and the color defines the sending subpopulation. c Violin plots for selected marker genes enriched in the Mox cluster (myC15). d Contribution of each ligand-receptor (L-R) pair to the overall cell-cell communication strength. Blue bars are strongly contributed by Mox (myC15). e Predicted cell-cell interactions for the indicated L-R pairs. Line widths and colors indicate signaling strengths and sending subpopulations, respectively. Cell types are in numerical order as shown in the left-most panel. Note that the myeloid and lymphoid clusters ends with mast cells and B cells, respectively. Source data are provided as a Source data file.
Fig. 7
Fig. 7. WAT contains niches populated by specific sets of cells.
a Representative sections from two subjects displaying areas densely populated by myeloid cells (left panels). The indicated regions are magnified where the hematoxylin & eosin stain is shown in the middle and the Visium slide myeloid score is shown. Deconvolution scores for myeloid subpopulations in the inlay regions are shown in the right panels. Boxplots are presented as interquartile range plus median and Tukey whiskers; scale bar is 100 µm. b Representative immunostaining of human subcutaneous white adipose tissue incubated with antibodies targeting LAM marker proteins TREM2 and CD9, respectively. Nuclei were stained with Hoechst. The experiment was repeated three times with similar results. Scale bar is 100 μm. c Pair-wise correlation heatmap displaying within-spot associations between cellular subpopulations. Full heatmap is shown in Supplementary Fig. 7b. d Representative sections displaying the distributions of selected subpopulations of FAPs (sfC08 and −12), myeloid (myC02), and vascular cells (vC01). Scale bar is 500 µm. e Representative immunostaining of human subcutaneous white adipose tissue incubated with antibodies targeting the sfC12 marker protein SLIT2 as well as the endothelial protein CD31. Nuclei were stained with Hoechst. The experiment was repeated seven times with similar results. Scale bar is 50 μm in the merged panel and 10 μm in the inlay. Source data are provided as a Source data file.
Fig. 8
Fig. 8. Deconvolution of transcriptomic data reveals cluster-specific clinical associations.
a Bulk transcriptomic data from eight cohorts were retrieved, the distribution in age, BMI, and HOMA-IR are shown in the left panel. Summary statistics are detailed in the right panels. b Heatmap displaying the association between individual cell types (denoted by numbers and color according to the classification in Figs. 2–4) with: anthropometric measures, HOMA-IR, circulating levels of HDL-cholesterol, triglycerides, and leptin (all in the fasted state), fat cell volume as well as adipocyte lipolysis (basal, isoprenaline-stimulated and isoprena-stimulated/basal). Three main clusters (A–C) were identified where cluster A and B are magnified in the right panel. c Representative Forest plots displaying the associations between individual measures and cell types. Data are shown as correlations with 95% confidence intervals for each study and summarized using both common and random effects models. For all displayed data, p values were <0.0001. d Stability of clusters A and B were determined in the two indicated cohorts where WAT bulk transcriptomes were generated before and two years following bariatric surgery. e Effects of weight loss induced by bariatric surgery in two cohorts. Panels display deconvolution scores for the indicated cell subpopulations. p values were calculated by two-sided paired sample t test (n = 15; Petrus et al. and n = 37; Kerr et al.) and boxplots are presented as interquartile range plus median and Tukey whiskers with individual, paired data points. Source data are provided as a Source data file.

References

    1. Sakers A, De Siqueira MK, Seale P, Villanueva CJ. Adipose-tissue plasticity in health and disease. Cell. 2022;185:419–446. doi: 10.1016/j.cell.2021.12.016. - DOI - PMC - PubMed
    1. Shao M, et al. De novo adipocyte differentiation from Pdgfrbeta(+) preadipocytes protects against pathologic visceral adipose expansion in obesity. Nat. Commun. 2018;9:890. doi: 10.1038/s41467-018-03196-x. - DOI - PMC - PubMed
    1. Schwalie PC, et al. A stromal cell population that inhibits adipogenesis in mammalian fat depots. Nature. 2018;559:103–108. doi: 10.1038/s41586-018-0226-8. - DOI - PubMed
    1. Hepler C, et al. Identification of functionally distinct fibro-inflammatory and adipogenic stromal subpopulations in visceral adipose tissue of adult mice. Elife. 2018;7:e39636. doi: 10.7554/eLife.39636. - DOI - PMC - PubMed
    1. Dong H, et al. Identification of a regulatory pathway inhibiting adipogenesis via RSPO2. Nat. Metab. 2022;4:90–105. doi: 10.1038/s42255-021-00509-1. - DOI - PMC - PubMed

Publication types