. 2023 Apr;616(7955):113-122.
doi: 10.1038/s41586-023-05795-1. Epub 2023 Mar 15.

Spatial epigenome-transcriptome co-profiling of mammalian tissues

Affiliations

Spatial epigenome-transcriptome co-profiling of mammalian tissues

Di Zhang et al. Nature. 2023 Apr.

Abstract

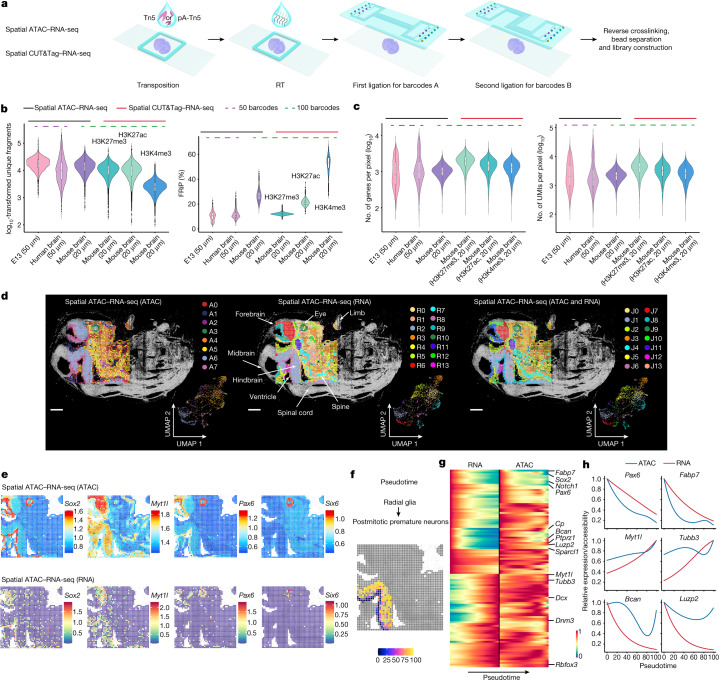
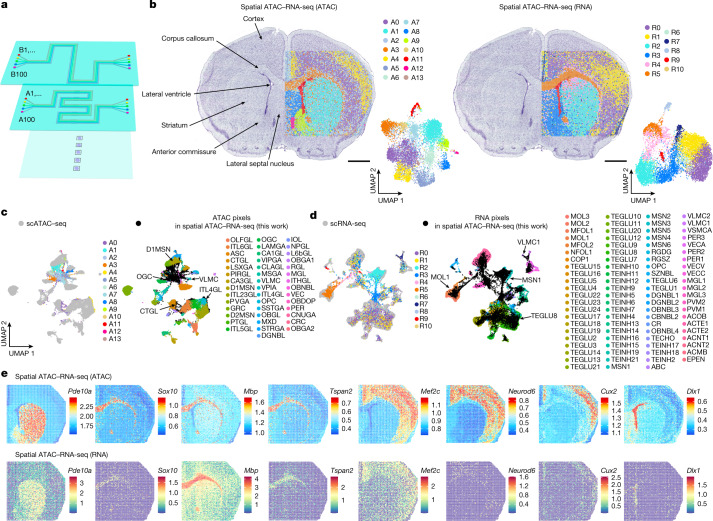
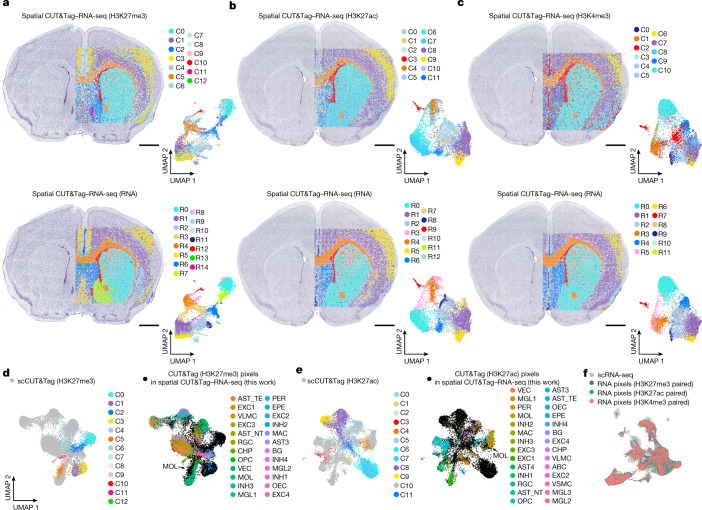
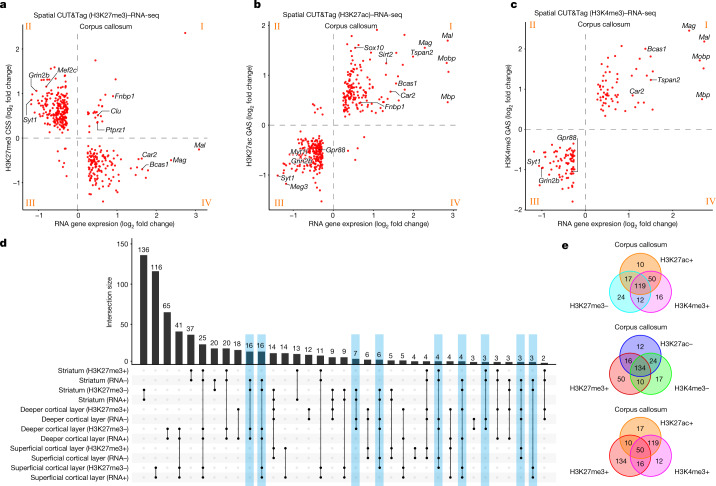
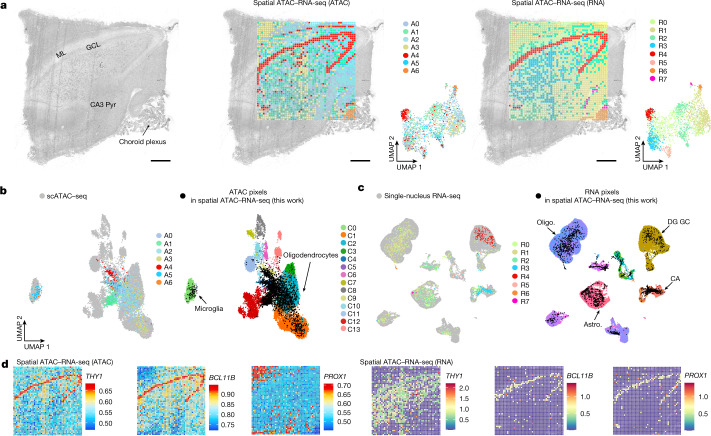
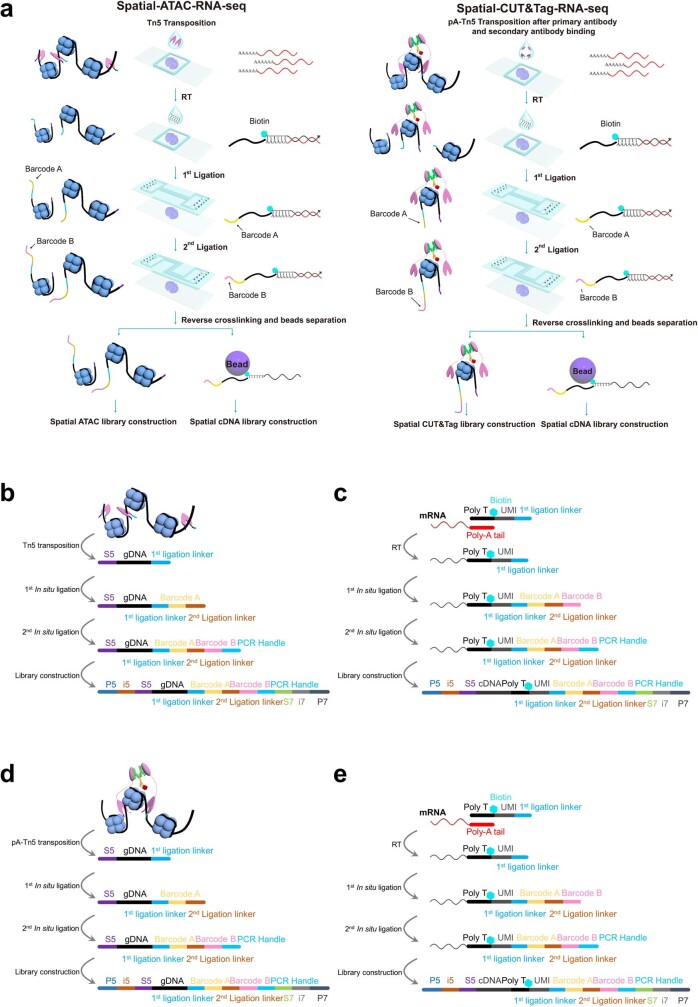
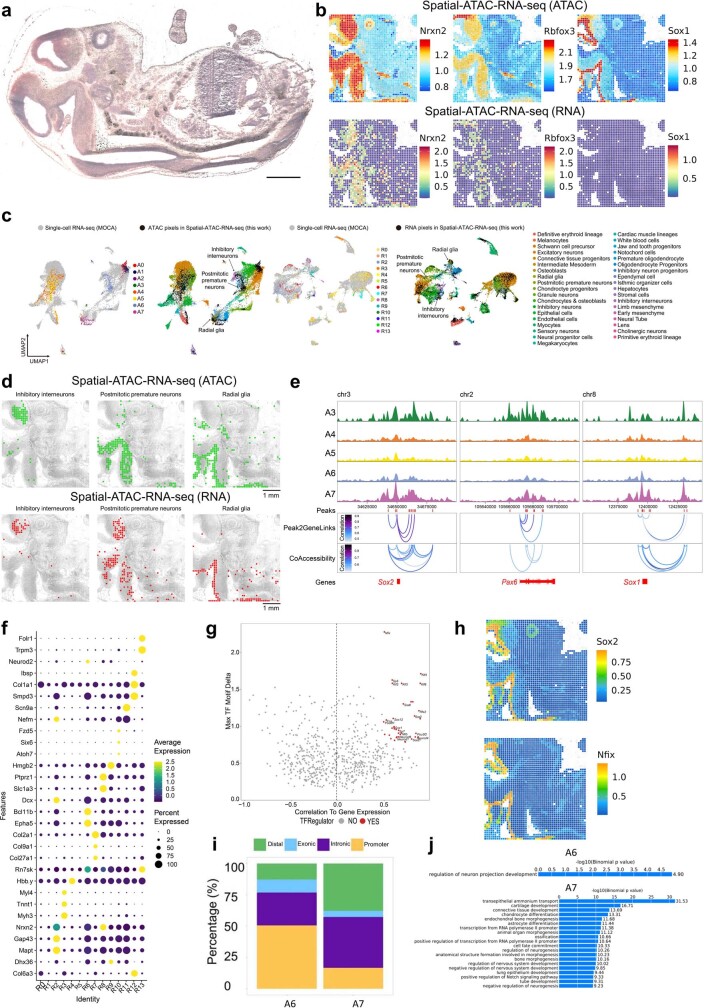
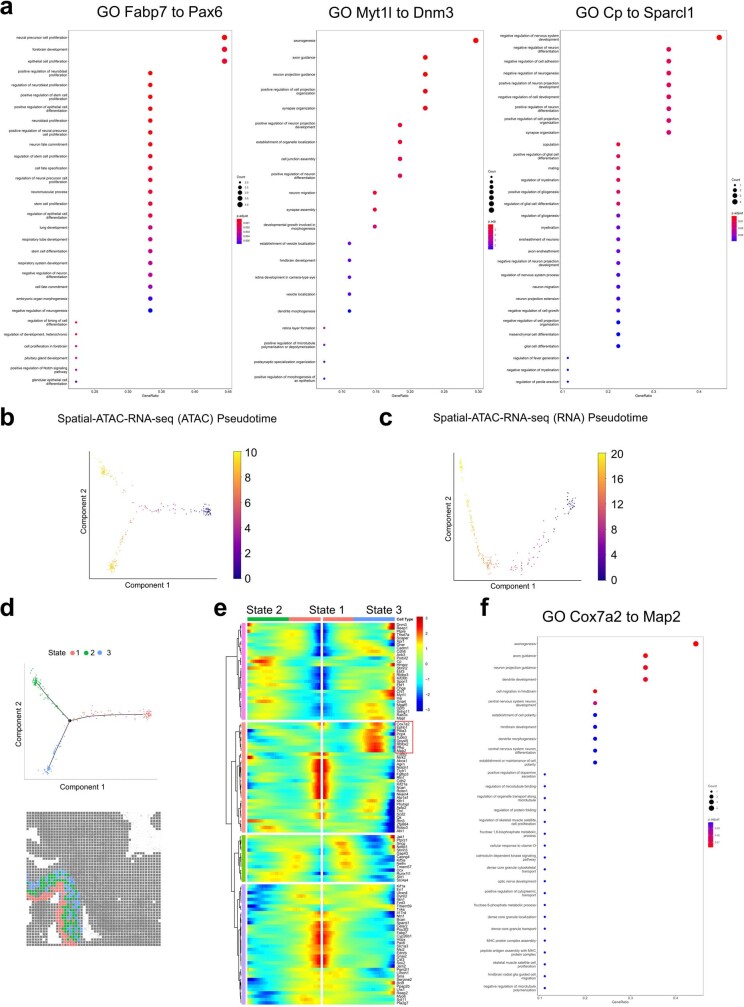
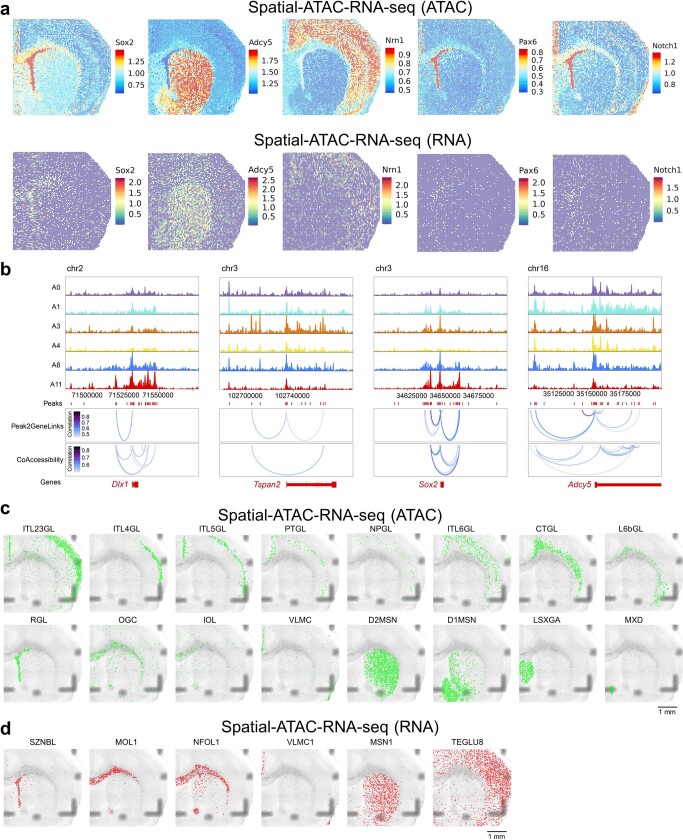
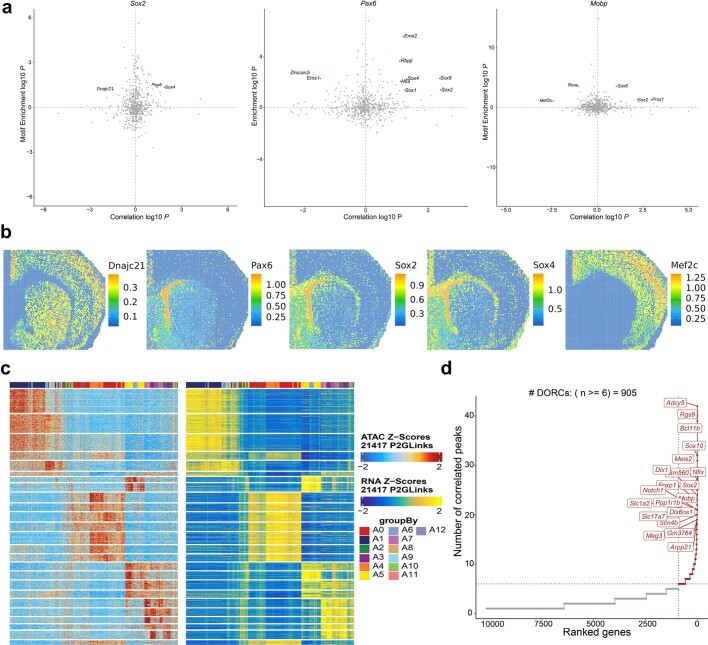
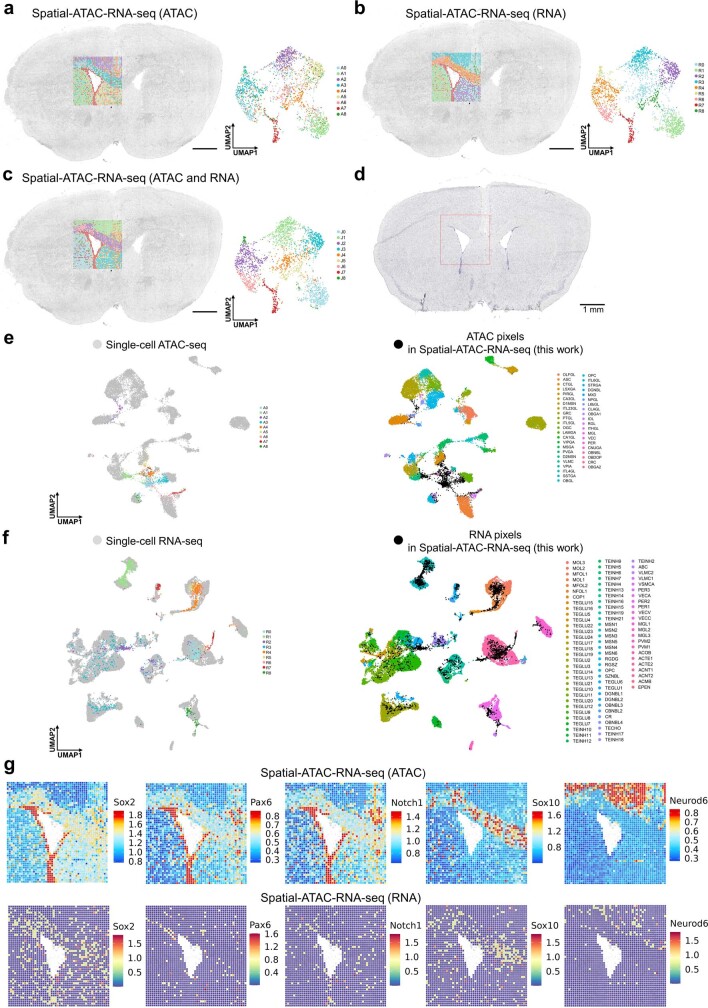
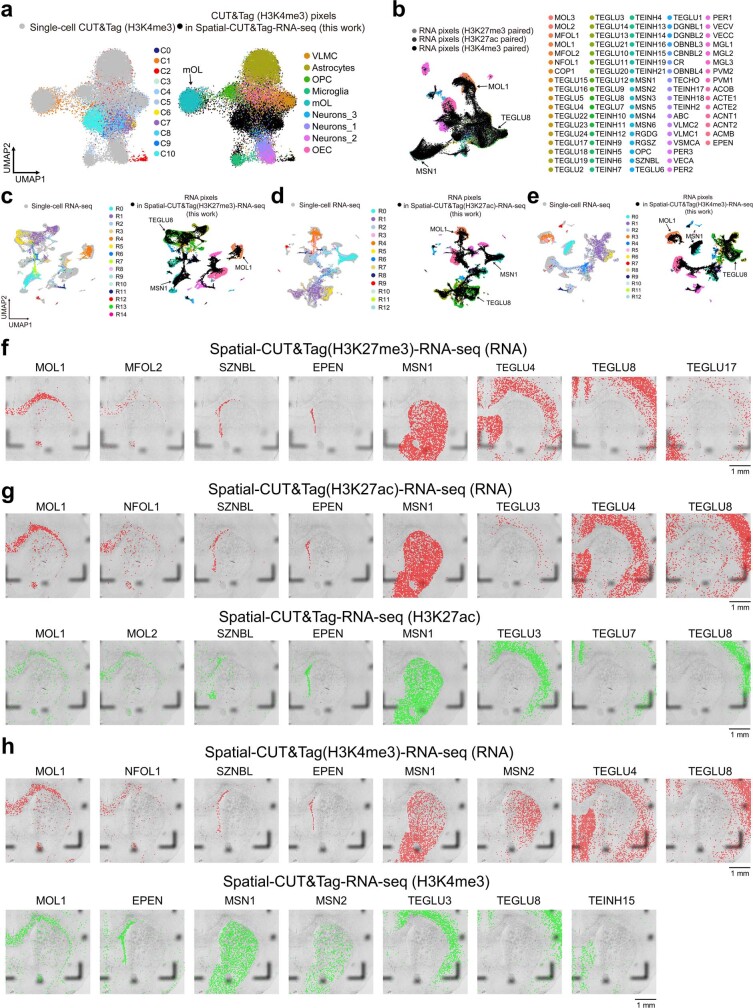
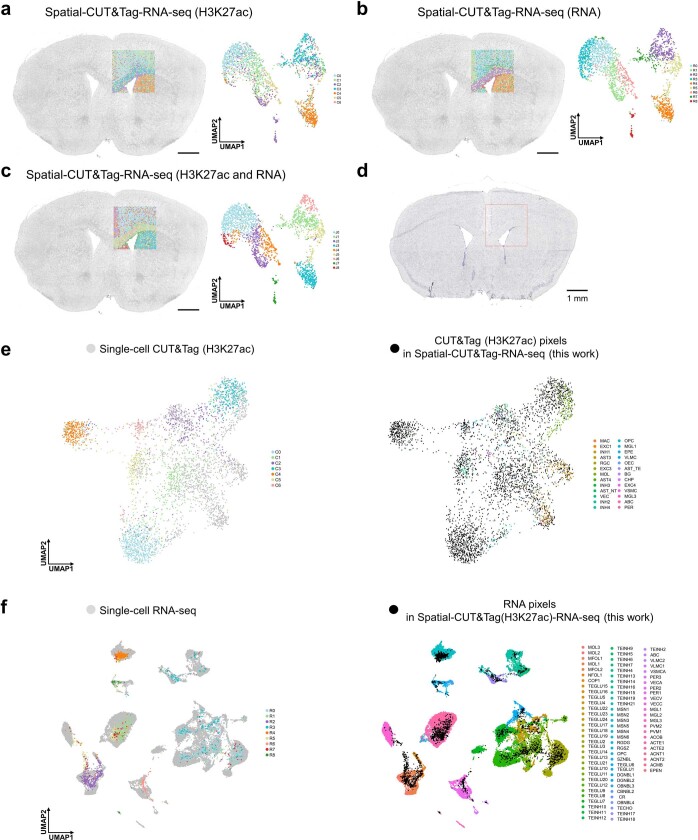
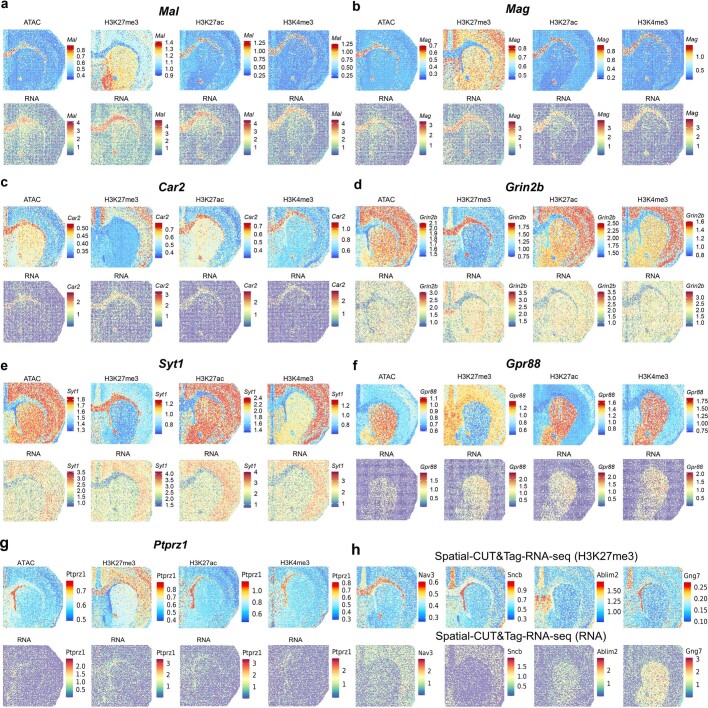
Emerging spatial technologies, including spatial transcriptomics and spatial epigenomics, are becoming powerful tools for profiling of cellular states in the tissue context1-5. However, current methods capture only one layer of omics information at a time, precluding the possibility of examining the mechanistic relationship across the central dogma of molecular biology. Here, we present two technologies for spatially resolved, genome-wide, joint profiling of the epigenome and transcriptome by cosequencing chromatin accessibility and gene expression, or histone modifications (H3K27me3, H3K27ac or H3K4me3) and gene expression on the same tissue section at near-single-cell resolution. These were applied to embryonic and juvenile mouse brain, as well as adult human brain, to map how epigenetic mechanisms control transcriptional phenotype and cell dynamics in tissue. Although highly concordant tissue features were identified by either spatial epigenome or spatial transcriptome we also observed distinct patterns, suggesting their differential roles in defining cell states. Linking epigenome to transcriptome pixel by pixel allows the uncovering of new insights in spatial epigenetic priming, differentiation and gene regulation within the tissue architecture. These technologies are of great interest in life science and biomedical research.


Conflict of interest statement

R.F., D.Z. and Y.D. are inventors of a patent provisional disclosure related to this work. R.F. is scientific founder and advisor of IsoPlexis, Singleron Biotechnologies and AtlasXomics. The interests of R.F. were reviewed and managed by Yale University Provost’s Office in accordance with the university’s conflict of interest policies. The remaining authors declare no competing interests.

Figures

Fig. 1
Fig. 1. Design and evaluation of spatial epigenome–transcriptome cosequencing with E13 mouse embryo.
a, Schematic workflow. b, Comparison of number of unique fragments and fraction of reads in peaks (FRiP) in spatial ATAC–RNA-seq and spatial CUT&Tag–RNA-seq. c, Gene and UMI count distribution in spatial ATAC–RNA-seq and spatial CUT&Tag–RNA-seq. Number of pixels in E13, 2,187; in human brain, 2,500; in mouse brain (ATAC), 9,215; in mouse brain (H3K27me3), 9,752; in mouse brain (H3K27ac), 9,370; in mouse brain (H3K4me3), 9,548. Box plots show the median (centre line), the first and third quartiles (box limits) and 1.5× interquartile range (whiskers). d, Spatial distribution and UMAP of all clusters for ATAC, RNA and joint clustering of ATAC and RNA data. Overlay of clusters with the tissue image shows that spatial clusters precisely match anatomic regions. Pixel size, 50 µm; scale bars, 1 mm. e, Spatial mapping of GAS and gene expression for selected marker genes in different clusters for ATAC and RNA in spatial ATAC–RNA-seq. f, Pseudotime analysis from radial glia to postmitotic premature neurons visualized at the spatial level. g, Heatmaps delineating gene expression and GAS for marker genes. h, Dynamic changes in GAS and gene expression across pseudotime.
Fig. 2
Fig. 2. Spatial chromatin accessibility and transcriptome co-profiling of P22 mouse brain.
a, Design of microfluidic chips for 100 × 100 barcodes with 20-μm channel size. b, Spatial distribution and UMAP of all clusters for ATAC and RNA in spatial ATAC–RNA-seq of mouse brain. Pixel size, 20 µm; scale bars, 1 mm. c, Integration of ATAC data and scATAC-seq data from mouse brain. d, Integration of RNA data and scRNA-seq data from mouse brain. e, Spatial mapping of GAS and gene expression for selected marker genes in different clusters for ATAC and RNA in spatial ATAC–RNA-seq. A list of abbreviation definitions can be found in Supplementary Table 1.
Fig. 3
Fig. 3. Spatial histone modification and transcriptome co-profiling of P22 mouse brain.
ac, Spatial distribution and UMAP of all clusters for H3K27me3 and RNA (a), H3K27ac and RNA (b) and H3K4me3 and RNA (c) in mouse brain. Pixel size, 20 µm; scale bars, 1 mm. d, Integration of H3K27me3 data with scCUT&Tag (H3K27me3) data from mouse brain. e, Integration of H3K27ac data with scCUT&Tag (H3K27ac) data from mouse brain. f, Integration of RNA data in spatial CUT&Tag (H3K27me3)–RNA-seq, spatial CUT&Tag (H3K27ac)–RNA-seq and spatial CUT&Tag (H3K4me3)–RNA-seq with scRNA-seq data from mouse brain.
Fig. 4
Fig. 4. Region-specific epigenetic regulation of gene expression.
ac, Correlation of H3K27me3 CSS and RNA gene expression (a), H3K27ac GAS and RNA gene expression (b) and H3K4me3 GAS and RNA gene expression (c) in corpus callosum. d, Upset plot of H3K27me3 CSS and RNA gene expression in striatum and deeper and superficial cortical layers; –, low CSS or gene expression; +, high CSS or gene expression. e, Venn diagrams showing high (+) or low (–) CSS/GAS for different histone modifications in corpus callosum with common RNA marker genes. Source Data
Fig. 5
Fig. 5. Spatial chromatin accessibility and transcriptome co-profiling of human hippocampus.
a, Brightfield image, spatial distribution and UMAP of all clusters based on ATAC and RNA in the human hippocampus. ML, molecular layer; Pyr, pyramidal neurons. Pixel size, 50 μm, scale bars, 1 mm. b, Integration of our ATAC data with scATAC-seq data from human hippocampus. c, Integration of our RNA data with snRNA-seq data from human brain. d, Spatial mapping of GAS and gene expression for selected marker genes in different clusters for ATAC and RNA. Oligo, oligodendrocytes; astro, astrocytes; DG, dentate gyrus.
Extended Data Fig. 1
Extended Data Fig. 1. Workflow of spatial-ATAC-RNA-seq and spatial-CUT&Tag-RNA-seq.
a, Schematic workflow of spatial-ATAC-RNA-seq and spatial-CUT&Tag-RNA-seq. b–c, Chemistry workflow of ATAC (b) and RNA (c) in spatial-ATAC-RNA-seq. d–e, Chemistry workflow of CUT&Tag (d) and RNA (e) in spatial-CUT&Tag-RNA-seq.
Extended Data Fig. 2
Extended Data Fig. 2. Further analysis of spatial-ATAC-RNA-seq for E13 mouse embryo.
a, H&E image from an adjacent tissue section of E13 mouse embryo. b, Spatial mapping of GAS and gene expression for selected marker genes in spatial-ATAC-RNA-seq. c, Integration of scRNA-seq data from E13.5 mouse embryos with ATAC and RNA data in spatial ATAC-RNA-seq. MOCA, Mouse Organogenesis Cell Atlas. d, Spatial mapping of cell types identified by label transfer from scRNA-seq to ATAC (top) and RNA (bottom). e, Genome track visualization of marker genes with peak-to-gene links for distal regulatory elements and peak co-accessibility. f, The expression level and the percentage of pixels in all clusters (marker genes for each cluster) for RNA data in spatial-ATAC-RNA-seq. g, Dot plot showing the identification of positive TF regulators. h, Spatial mapping of deviation scores for selected TF motifs. i, Annotation of marker peaks in different clusters. j, GREAT enrichment analysis of marker peaks in different clusters (Binomial and hypergeometric tests).
Extended Data Fig. 3
Extended Data Fig. 3. Further pseudotime analysis of radial glia and postmitotic premature neurons in spatial-ATAC-RNA-seq.
a, GO enrichment analysis for genes from Fig. 1g. b,c, Pseudotime analysis from radial glia to postmitotic premature neurons with GAS (b) and gene expression (c). d, Monocle2 analyses showing different states in (b). e, Heatmap of different states along the pseudotime trajectory. f, GO analysis of genes in red box of (e) (One-sided version of Fisher’s exact test, p-value was adjusted for multiple comparisons by Benjamini & Hochberg method).
Extended Data Fig. 4
Extended Data Fig. 4. Further analysis of spatial-ATAC-RNA-seq for P22 mouse brain.
a, Spatial mapping of gene activity scores and gene expression for selected marker genes in spatial-ATAC-RNA-seq. b, Genome track visualization of marker genes with peak-to-gene links for distal regulatory elements and peak co-accessibility. c, Spatial mapping of cell types identified by label transfer from scATAC-seq to ATAC data. IT: intratelencephalic. PT: pyramidal tract. NP: near-projecting. CT: corticothalamic. L: layer. d, Spatial mapping of cell types identified by label transfer from scRNA-seq to RNA data.
Extended Data Fig. 5
Extended Data Fig. 5. Further analysis of P22 mouse brain in spatial-ATAC-RNA-seq.
a, Candidate TF regulators of Sox2, Pax6, and Mobp. Highlighted points are TFs with abs(regulation score) ≥ 1 (−log10 scale), with all other TFs shown in gray (Z test). b, Spatial mapping of deviation scores for selected TF motifs. c, Heatmaps of peak-to-gene links in spatial-ATAC-RNA-seq. d, The number of significantly correlated peaks for each gene.
Extended Data Fig. 6
Extended Data Fig. 6. Spatial chromatin accessibility and transcriptome co-sequencing of P21mouse brain.
a—c, Spatial distribution and UMAP of all the clusters for ATAC (a), RNA (b), and joint clustering of ATAC and RNA (c) in spatial-ATAC-RNA-seq for the mouse brain. Pixel size, 20 µm. Scale bar, 1 mm. d, Nissl-stained image from an adjacent tissue section of P21 mouse brain. Scale bar, 1 mm. e, Integration of ATAC data in spatial-ATAC-RNA-seq with scATAC-seq data from mouse brain. f, Integration of RNA data in spatial-ATAC-RNA-seq with scRNA-seq data from mouse brain. g, Spatial mapping of GAS and gene expression for selected marker genes in different clusters for ATAC and RNA in spatial-ATAC-RNA-seq.
Extended Data Fig. 7
Extended Data Fig. 7. Further analysis for spatial-CUT&Tag-RNA-seq with P22 mouse brain.
a, Integration of CUT&Tag (H3K4me3) data in spatial-CUT&Tag-RNA-seq with scCUT&Tag (H3K4me3) data from mouse brain. b, Integration of RNA data in spatial- CUT&Tag(H3K27me3)-RNA-seq, spatial-CUT&Tag(H3K27ac)-RNA-seq, and spatial-CUT&Tag(H3K4me3)-RNA-seq with scRNA-seq data from mouse brain. c-e, Integration of RNA data in spatial-CUT&Tag(H3K27me3)-RNA-seq (c), RNA data in data in spatial-CUT&Tag(H3K27ac)-RNA-seq (d), and RNA data in spatial-CUT&Tag(H3K4me3)-RNA-seq (e) with scRNA-seq data from mouse brain. f, Spatial mapping of cell types identified by label transfer from scRNA-seq to RNA data in spatial-CUT&Tag(H3K27me3)-RNA-seq. g, Spatial mapping of cell types identified by label transfer from scRNA-seq to RNA (top) and from scRNA-seq to CUT&Tag (H3K27ac, bottom) data in spatial-CUT&Tag(H3K27ac)-RNA-seq. h, Spatial mapping of cell types identified by label transfer from scRNA-seq to RNA (top) and from scRNA-seq to CUT&Tag (H3K4me3, bottom) data in spatial-CUT&Tag(H3K4me3)-RNA-seq.
Extended Data Fig. 8
Extended Data Fig. 8. Spatial epigenome and transcriptome co-sequencing and integrative analysis of P21 mouse brain.
a-c, Spatial distribution and UMAP of all the clusters for CUT&Tag (H3K27ac) (a), RNA (b), and joint clustering of CUT&Tag (H3K27ac) and RNA (c) in spatial-CUT&Tag-RNA-seq for the mouse brain. Pixel size, 20 µm. Scale bar, 1 mm. d, Nissl-stained image from an adjacent tissue section of P21 mouse brain. Scale bar, 1 mm. e, Integration of CUT&Tag (H3K27ac) data in spatial-CUT&Tag-RNA-seq with scCUT&Tag (H3K27ac) data from mouse brain. f, Integration of RNA data in spatial-CUT&Tag-RNA-seq with scRNA-seq data from mouse brain.
Extended Data Fig. 9
Extended Data Fig. 9. Spatial mapping of CSS, GAS, and gene expression of selected genes for P22 mouse brain.
a-g, Spatial mapping of CSS, GAS, and gene expression of Mal (a), Mag (b), Car2 (c), Grin2b (d), Syt1 (e), Gpr88 (f), and Ptprz1 (g) from ATAC and RNA in spatial-ATAC-RNA-seq, and CUT&Tag (H3K27me3, H3K27ac, or H3K4me3) and RNA in spatial-CUT&Tag-RNA-seq. h, Spatial mapping of CSS and gene expression of Nav3, Sncb, Ablim2, and Gng7 in spatial-CUT&Tag(H3K27me3)-RNA-seq.
Extended Data Fig. 10
Extended Data Fig. 10. Further analysis of human hippocampus in spatial-ATAC-RNA-seq.
a, Spatial mapping of cell types identified by label transfer from scRNA-seq to RNA data in spatial-ATAC-RNA-seq for human hippocampus. b, Dot plot showing the identification of positive TF regulators. c, Spatial mapping of deviation scores for selected TF motifs in spatial-ATAC-RNA-seq.

Comment in

References

    1. Liu, Y. et al. High-spatial-resolution multi-omics sequencing via deterministic barcoding in yissue. Cell183, 1665–1681 (2020). - PMC - PubMed
    1. Deng, Y. et al. Spatial-CUT&Tag: spatially resolved chromatin modification profiling at the cellular level. Science375, 681–686 (2022). - PMC - PubMed
    1. Deng, Y. et al. Spatial profiling of chromatin accessibility in mouse and human tissues. Nature609, 375–383 (2022). - PMC - PubMed
    1. Chen, A. et al. Spatiotemporal transcriptomic atlas of mouse organogenesis using DNA nanoball-patterned arrays. Cell185, 1777–1792 (2022). - PubMed
    1. Lu, T., Ang, C. E. & Zhuang, X. Spatially resolved epigenomic profiling of single cells in complex tissues. Cell185, 4448–4464 (2022). - PMC - PubMed

Publication types