Clinical Trial
. 2023 Mar;615(7954):913-919.
doi: 10.1038/s41586-023-05755-9. Epub 2023 Mar 15.

MEN1 mutations mediate clinical resistance to menin inhibition

Affiliations
Clinical Trial

MEN1 mutations mediate clinical resistance to menin inhibition

Florian Perner et al. Nature. 2023 Mar.

Abstract

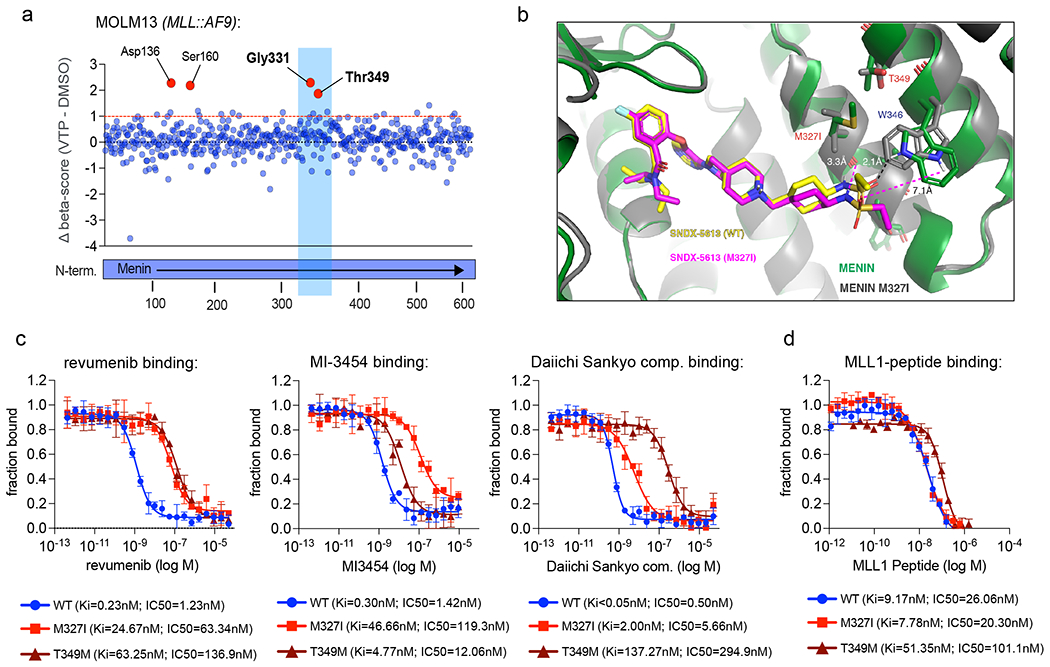
Chromatin-binding proteins are critical regulators of cell state in haematopoiesis1,2. Acute leukaemias driven by rearrangement of the mixed lineage leukaemia 1 gene (KMT2Ar) or mutation of the nucleophosmin gene (NPM1) require the chromatin adapter protein menin, encoded by the MEN1 gene, to sustain aberrant leukaemogenic gene expression programs3-5. In a phase 1 first-in-human clinical trial, the menin inhibitor revumenib, which is designed to disrupt the menin-MLL1 interaction, induced clinical responses in patients with leukaemia with KMT2Ar or mutated NPM1 (ref. 6). Here we identified somatic mutations in MEN1 at the revumenib-menin interface in patients with acquired resistance to menin inhibition. Consistent with the genetic data in patients, inhibitor-menin interface mutations represent a conserved mechanism of therapeutic resistance in xenograft models and in an unbiased base-editor screen. These mutants attenuate drug-target binding by generating structural perturbations that impact small-molecule binding but not the interaction with the natural ligand MLL1, and prevent inhibitor-induced eviction of menin and MLL1 from chromatin. To our knowledge, this study is the first to demonstrate that a chromatin-targeting therapeutic drug exerts sufficient selection pressure in patients to drive the evolution of escape mutants that lead to sustained chromatin occupancy, suggesting a common mechanism of therapeutic resistance.


Conflict of interest statement

S.F.C. is a consultant for and holds equity interest in Imago Biosciences. J.G.D. consults for Microsoft Research, Servier, Abata Therapeutics, Maze Therapeutics, BioNTech, and Pfizer; JGD consults for and has equity in Tango Therapeutics. J.G.D. receives support via the Functional Genomics Consortium (Merck, Abbvie, Janssen, Vir, and Bristol Meyers Squibb). R.L.L. is on the supervisory board of Qiagen and is a scientific advisor to Loxo, Imago, C4 Therapeutics and Isoplexis. He receives research support from and consulted for Celgene and Roche, research support from Prelude Therapeutics, and has consulted for Novartis and Gilead. He has received honoraria from Lilly and Amgen for invited lectures. E.M.S. receives research support to his institution from Agios, Amgen, Astellas, Bayer, Biotheryx, Bristol Myers Squibb, Eisai Foghorn, Servier, Syndax, Syros and consulting fees from Novartis, PinotBio, Janssen, Bristol Myers Squibb, Agios, Jazz, Menarini, Genentech, Genesis, Abbvie, Neoleukin, Gilead, Syndax, OnCusp, CTI Biopharma, Foghorn, Servier, Calithera, Daiichi, Aptose, Syros, Astellas, Ono Pharma, Blueprint, Kura. Epizyme and Cellectis. E.M.S. also holds equity interest in Auron Therapeutics.

S.A.A. has been a consultant and/or shareholder for Vitae/Allergan Pharmaceuticals, Neomorph, Inc., Imago Biosciences, Cyteir Therapeutics, C4 Therapeutics, and Accent Therapeutics. S.A.A. has received research support from Janssen, and Syndax and is an inventor on a patent related to Menin Inhibition WO/2017/132398A1. J.D.C. is a current member of the Scientific Advisory Boards of OpenEye Scientific Software, Interline Therapeutics, and Redesign Science. The Chodera laboratory receives or has received funding from the National Institute of Health, the National Science Foundation, the Parker Institute for Cancer Immunotherapy, Relay Therapeutics, Entasis Therapeutics, Silicon Therapeutics, EMD Serono (Merck KGaA), AstraZeneca, Vir Biotechnology, XtalPi, Interline Therapeutics, and the Molecular Sciences Software Institute, the Starr Cancer Consortium, the Open Force Field Consortium, Cycle for Survival, a Louis V. Gerstner Young Investigator Award, and the Sloan Kettering Institute. A complete funding history for the Chodera lab can be found at http://choderalab.org/funding. W.X. has received research support from Stemline Therapeutics. A.J.S.’s spouse is an employee of Bristol-Myers Squibb. The remaining authors declare no competing interests. E.S.F. is a founder, member of the scientific advisory board (SAB), and equity holder of Civetta Therapeutics, Jengu Therapeutics, Proximity Therapeutics, and Neomorph Inc (board member), SAB member and equity holder in Avilar Therapeutics and Photys Therapeutics, and a consultant to Astellas, Sanofi, Novartis, Deerfield and EcoR1 capital. The Fischer laboratory receives or has received research funding from Novartis, Deerfield, Ajax, Interline, and Astellas. R.M.S. has received advisory or consulting fees from Abbvie, Actinium, Agios, Arog, Astellas, Biolinerx, Celgene, Daiichi-Sankyo, Elevate, Gemoab, Janssen, Jazz, Macrogenics, Novartis, OncoNova, Syndax, Syntrix, Syros, Takeda, Trovagene, BergenBio, Foghorn Therapeutics, GSK, Aprea, Innate, Amgen, CTI Pharmaceuticals, BMS and Boston Pharmaceuticals.

Figures

Extended Data Figure 1:
Extended Data Figure 1:. Novel MEN1 mutations detected in patients upon relapse on revumenib.
a-c) Tables showing the results of the IMPACT targeted DNA-sequencing panel from patient 1-4 at the time point of screening prior to enrolling on the AUGMENT-101 trial and at relapse on revumenib treatment. MEN1 mutations are highlighted in red. d) Pie charts displaying the fraction of MEN1-mutant alleles measured by droplet digital PCR (ddPCR) at the time point of relapse (or last available sampling time point before relapse) in all individual patients from the cohort shown in Fig. 1b. Relative mutation frequencies (number of MEN1-mutant / WT droplets) are labeled in white. Mutations which were detected in > 2 droplets were considered. e) Longitudinal kinetics of MEN1 mutant selection in two selected patients from the cohort shown in Fig. 1b. Mutant allele frequencies at different time points during revumenib treatment were analyzed by ddPCR.
Extended Data Figure 2:
Extended Data Figure 2:. Development of Menin-inhibitor resistance in a KMT2Ar PDX.
a) Box-plot (median, box: 25th to 75th percentile, whiskers: range) showing the percentage (%) of human leukemia cells in the bone marrow of NOG-mice transplanted with PDX3 at baseline (n=4), 4 weeks (w) (n=4), 8w (n=5) and at 10-12w (n=5; symptomatic leukemia relapse) on Menin-inhibitor treatment. Dots represent individual animals. One-way ANOVA with correction for multiple comparisons was used for statistical analysis. b) Box-plots (median, box: 25th to 75th percentile, whiskers: range) showing the mean fluorescence intensity (MFI) of the myeloid differentiation markers CD11b, CD13 and CD14 on the cell surface of human cells detected in the bone marrow of NOG-mice transplanted with PDX3 at baseline (n=4), 4w (n=5), 8w (n=4) and at 10-12w (n=4) on Menin-inhibitor treatment. Dots represent individual animals. One-way ANOVA with correction for multiple comparisons was used for statistical analysis. c) Bone marrow cytology pictures (cytospins) from each 2 representative animals at baseline, 4w, 8w and 12w on Menin-inhibitor treatment. d) Pie charts showing the fraction of MEN1-T349M (red) as compared to MEN1-WT (blue) measured by droplet digital PCR (ddPCR) at baseline, 8 weeks and 12 weeks (fulminant clinical relapse) in human cells isolated from PDX3 mice and purified using magnetic cell sorting.
Extended Data Figure 3:
Extended Data Figure 3:. Base-editor screening as a tool to identify point mutants in MEN1.
a) Schematic depicting the workflow of the MEN1-base editor screen performed in MOLM13 (MLL::AF9) and MV4;11 (MLL::AF4) cells b) Dot-plot showing the results of a CRISPR-Cas9 base-editor screen in MV4;11 cells aiming to identify point mutations that cause resistance to Menin inhibitor treatment. Each dot represents a single guide RNA. Along the x-axis guide RNAs are sorted by their targeting location relative to the Menin-coding sequence. The y-axis shows differential CRISPR-beta-scores (DMSO-score subtracted from the VTP-50469-treatment score). Outstanding hits are marked in red and targeted amino acid residues are labeled. c) X-ray co-crystal structure of revumenib bound to WT-Menin (PDB: 7UJ4). The hydrogen bonds between sulfonamide oxygen of revumenib and indole nitrogen of W346 or sulfonamide nitrogen of revumenib and backbone carbonyl oxygen of M327 are indicated with black dashed lines. Non polar hydrogens are shown for revumenib and the W346. d) X-ray co-crystal structure of Menin in complex with MLL14-15 peptide (PDB: 4GQ6). View corresponds to Extended data Figure 3c. Recurrently mutated amino acids are labeled in red. The W346 residue that builds up a strong hydrogen bond with revumenib to stabilize binding of the molecule is marked in blue. e) Alignment of the Menin bound revumenib (PDB: 7UJ4) with Menin bound MLL14-15 peptide (PDB: 4GQ6). Recurrently mutated amino acids are labeled in red. The W346 residue that builds up a strong hydrogen bond with revumenib to stabilize binding of the molecule is marked in blue.
Extended Data Figure 4:
Extended Data Figure 4:. Atomic modeling of Menin and its mutations using equilibrium simulations.
a) Trajectory length distributions for equilibrium simulations of Menin wild-type and mutants (rows). Simulations were all run simultaneously on Folding@home and the frequency distribution of their simulation lengths is indicated for each construct, both with and without revumenib (left and right columns, respectively. b) Equilibrium molecular dynamics simulations and Markov models reveal that helices contacting revumenib separate upon mutation. Distance distributions between the sulfonamide contacting helices were computed for WT Menin and each mutant. Error bands are computed by bootstrapping the markov state model using 10 random samples with replacement, generating standard errors for the Markov State Model populations. These errors were used to compute the histogram standard error ranges as shown above using 100 bins. Results are insensitive to changing the number of bootstrapped samples from 5 to 30. c) DiffNets analysis comparing WT to mutant Menin using backbone features showing helical separation (blue lines) around revumenib (magenta). Dashed lines indicate helical motion as a structural feature that significantly differs between WT and mutant Menin. Blue lines indicate that helices move further apart and separate upon mutation, while red dashed lines indicate that helices come closer together. d) Implied timescales after clustering all Folding@home simulations. Based on this plot, a lag time of 7 nanoseconds was chosen for MSM construction to ensure Markovanaity.
Extended Data Figure 5:
Extended Data Figure 5:. MEN1 mutations impact binding affinity of revumenib to the MLL1/2 binding pocket.
a) Titration curves of WT-, M327I- and T349M-mutant Menin against a FITC-conjugated MLL1 4-43(C-A) peptide probe (N=3, each data point represents the mean of 3 technical triplicates +/− SD) for determination of equilibrium dissociation constant (Kd). b) Curves depicting the fraction of revumenib (left) or MLL1 (right) bound to Menin (WT or mutant) over time determining the molecule’s dissociation rates (off-rates) over time (N=8). Data point represent the mean +/− SD. c) Isothermal titration calorimetry assay measuring the binding of revumenib to WT-, M327I and T349M-mutant Menin confirming the mutation inflicted shift in affinity detected using the fluorescence polarization assay (Fig. 2e). d) Titration curves of WT-, M327I- and T349M-mutant Menin against a FITC-conjugated MLL2 (15-48) peptide probe at three peptide concentrations 0.5, 1 and 2 nM. Data is presented as fraction bound of three independent replicates (N=3). Data point represent the mean +/− SD. e) Fluorescence polarization assay measuring dose-dependent displacement of an MLL2 peptide from WT, M327I- and T349M-mutant Menin under treatment with revumenib or MI-3454. Data is presented as fraction bound of three independent replicates (N=3). Data point represent the mean +/− SD.
Extended Data Figure 6:
Extended Data Figure 6:. Lentiviral expression of MEN1 mutants confers resistance in cell lines.
a) Western blot in MOLM13 cells showing expression of HA-tagged MEN l-WT and M327I-mutant construct. Representative Western Blot of 3 independent replicates. b) Dose-response curves of MOLM13 cells to revumenib upon expression of MEN1 mutants compared to -WT. Cell counts were measured by flow cytometry and displayed relative to the DMSO control (mean +/− SEM, n=4, each 3 technical replicates). c) b) Dose-response curves of MV4;11 and OCI-AML3 cells to revumenib upon expression of MEN1 mutants or -WT measured by Cell-titerGlo (mean +/− SD, n=3). d) Induction of differentiation marker expression by revumenib in OCI-AML3 cells expressing MEN1 mutants compared to WT measured by flow cytometry (MFI CD11b) (n=3, mean +/− SD). An unpaired, two-tailed t-test was used for statistical analysis. e) Quantification of the cytological assessment for blast morphology by a hematopathologist (n=5, median, box: 25th to 75th percentile, whiskers: range). One-way ANOVA with correction for multiple comparisons was used for statistical analysis. f) Dose-response curves of OCI-AML3 cells to revumenib (top panel) or MI-3454 (bottom panel) upon expression of MEN1 mutants compared to -WT. Cell counts were measured by flow cytometry and displayed relative to the DMSO (mean +/− SEM, n=4, each 3 technical replicates). g) Western blot in MV4;11 cells showing expression of HA-tagged MEN1-WT and -mutant constructs. Representative Western Blot of 2 independent replicates. h) Dose-response curves of MV4;11 cells to revumenib upon expression of MEN1 mutants compared to -WT. Cell counts were measured by flow cytometry and displayed relative to the DMSO (mean +/− SEM, n=4, each 3 technical replicates). b, f, h) Statistical analysis was perfomed using an unpired t-test, two tailed, multiple comparisons. *** p<0.001; **p<0.01; *p<0.05.
Extended Data Figure 7:
Extended Data Figure 7:. MEN1-M327I endogenous gene-editing induces drug resistance to different Menin-inhibitors in leukemia cell lines.
a) Sanger-sequencing tracks showing gene-editing in MV4;11 and OCI-AML3 cells generating stable cell lines harboring the mutations indicated above the respective plots at the endogenous MEN1-locus. b) Dose-response curves of M327I homozygous or -WT MV4;11 cells to a high-dose range of revumenib. c) Dose-response curves of M327I heterozygous or -WT MV4;11 cells to MI-3454. d) Dose-response curves showing the sensitivity of OCI-AML3 (NPM1c) cells harboring the MEN1-M327I mutation to revumenib, MI-3454 and the Daiichi-Sankyo compound. e) Dose-response curves showing the sensitivity of OCI-AML3 (NPM1c) cells harboring the MEN1-T349M mutation to revumenib, MI-3454 and the Daiichi-Sankyo compound. f) Dose-response curves showing the sensitivity of MV4;11 cells harboring homozygous or heterozygous MEN1-M327I mutations to the covalent binder MI-89. g) Dose-response curves of S160C or -WT MV4;11 cells to revumenib. b-g) Cell counts were measured by flow cytometry and displayed relative to the DMSO control (mean +/− SEM, n=4, each 3 technical replicates). h) Fluorescence-based cell competition assay measuring relative cell fitness of MV4;11-MEN1-WT, -M327I or -T349M mutant cells in the presence or absence of revumenib (100nM) over the course of 21 days by flow cytometry (N=4, mean +/− SD). b-g) Statistical analysis was perfomed using an unpired t-test, two tailed, multiple comparisons. *** p<0.001; **p<0.01; *p<0.05.
Extended Data Figure 8:
Extended Data Figure 8:. ChIPseq of Menin and MLL1 in MEN1-WT and -M327I-mutant cells.
a) ChIPseq tracks of Menin and MLL1 at the PBX3, MEF2C, JMJD1C-loci and the HOXA-cluster in MV4;11 cells under revumenib treatment (representative example of 3 replicates). b) Torpedo-plots of total Menin signal intensity around transcription start sites (TSS) from ChIP-sequencing (ChIPseq) in OCI-AML3-MEN1-WT and -M327I-mutant cells treated with revumenib (0.1μM, 1μM) or DMSO as control (N=2). Shown is one representative example. c) ChIPseq tracks of Menin at the MEIS1, PBX3, MEF2C, JMJD1C-loci and the HOXA-cluster in OCI-AML3 cells under revumenib treatment. d) Bar graphs showing Menin-ChIP-qPCR results at the MEIS1, MEF2C and HOXA10 transcription start sites after treatment with 100nM revumenib or DMSO as control (4 days treatment) (N=3, mean +/− SD). An unpaired, two-tailed t-test was used for statistical analysis. e) Torpedo-plots of Menin signal intensity around TSS from ChIPseq in MEN1-WT and -T349M-mutant PDX3 treated with VTP-50469 for 14 days. f) Menin-TSS-signal at MLL1-target genes in PDX3 (mean +/− SD, 3000 TSS data points per condition). Two-tailed Mann-Whitney-Tets was used for statistical analysis. g) Read-normalized MLL1-TSS-signal at sites that lose >80% of Menin in WT cells treated with VTP-50469 (mean +/− SD, 293 data points per condition). Two-tailed Mann-Whitney-Tets was used for statistical analysis. h) ChIPseq tracks of Menin and MLL1 at the MEIS1-locus and HOXA-cluster in PDX3.
Extended Data Figure 9:
Extended Data Figure 9:. MEN1 mutations abrogate changes in gene expression signatures in MV4;11 cells upon revumenib treatment.
a) Geneset-enrichment analysis (GSEA) from revumenib (100nM, 1μM or 5μM) vs. DMSO treated MV4;11 cells harboring the MEN1-M327I mutation or -WT as control. Plotted are the False-discovery rate (FDR) q-values (y-axis) over the normalized enrichment scores (x-axis). Each dot represents a gene set. Relevant genesets covering MLL/HOX-related or myeloid differentiation associated terms were chosen for the analysis and selected terms are annotated. b) GSEA plots from revumenib (100nM, 1μM or 5μM) vs. DMSO treated MV4;11 cells harboring the MEN1-M327I mutation or -WT as control. GSEA was performed for MLL-fusion targets (Olsen et al., Mol. Cell, 2022) and the BROWN_MYELOID_CELL_CEVELOPMENT_UP geneset. Normalized enrichment scores and FDR q-values are indicated below each plot.
Extended Data Figure 10:
Extended Data Figure 10:. MEN1 mutations blunt repression of key MLL-target genes upon revumenib treatment.
a) Bar graphs showing relative gene expression of MEIS1 and MEF2C in MEN1-M327I homozygous (left) and heterozygous (right) cells under treatment with a wide range of revumenib doses (mean +/− SD, n=3, each measured in triplicates) measured by quantitative real-time PCR using pre-validated Taqman® probes. b) a) Bar graphs showing relative gene expression of MEIS1 (left) and MEF2C (right) in MEN1-M327I and MEN1-T349M mutant cells under treatment with a wide range of revumenib doses (mean +/− SD, n=3, each measured in triplicates) measured by quantitative real-time PCR using pre-validated Taqman® probes. c) Bar graphs showing relative gene expression of MEIS1, PBX3 and HOXA7 in MEN1-T349M-mutant or WT PDX2 treated for 12 days with VTP-50469 (mean +/− SD, n=3, each measured in triplicates, replicates represent individual mice) measured by quantitative real-time PCR using pre-validated Taqman® probes. d) Graphical depiction of the percentage (%) of leukemic blasts in the peripheral blood and bone marrow of a patient that developed resistance without MEN1-mutations (or other somatic mutations detected by IMPACT-sequencing) during revumenib treatment on the AUGMENT-101 clinical trial. e) Cytology pictures (May-Grünwald/Giemsa staining) showing blast morphology of leukemia cells at screening and relapse under revumenib treatment of the same patient as shown in d). Representative cytology pictures from one individual patient sample. f) Volcano-plots showing gene expression changes in resistant leukemia cells from a patient (same as in d/e) and PDX-4 which developed non-genetic Menin-inhibitor resistance. Statistical determination of differentially expressed genes was performed using DESeq2.
Figure 1:
Figure 1:. Menin inhibitor resistance is associated with emergence of MEN1 mutations.
a) Graphical depiction of the percentage (%) of leukemic blasts in the peripheral blood of patients during revumenib treatment on the AUGMENT-101 clinical trial. Clinical events are marked with arrows and labeled respectively. b) Schematic showing the fraction of patients in which MEN1-M327I, -M327V, -G331R, -G331D or -T349M was detected by droplet digital PCR (ddPCR). For this analysis we included patients that received at least two cycles of revumenib treatment (>56 days) and had 2 or more mutant droplets detected. c) Pie charts displaying the fraction of MEN1-mutant alleles measured by ddPCR at the time point of screening and relapse in 4 individual patients from the cohort shown in b). d) Longitudinal kinetics of MEN1-mutant selection in two patients from the cohort shown in b). Mutant allele frequencies at different timepoints during revumenib treatment were analyzed by ddPCR. e, f, g) Graphical display of the percentage (%) of human leukemia cells in the peripheral blood of individual NOG-mice during a long-term patient-derived xenograft (PDX) treatment trial with the Menin-inhibitor VTP-50469 (0.03% rodent diet). Blue bars in the background mark the time of oral Menin inhibitor exposure via drug-supplemented rodent diet. MEN1 mutations detected via targeted DNA-sequencing in individual animals of e) PDX 1 (MLL::AF6), f) PDX 2 (NPM1c) or g) PDX 3 (MLL::AF10) are labeled and marked with arrows.
Figure 2:
Figure 2:. Base-editor screening identifies recurrent MEN1 mutations mapping to the MLL1-binding pocket.
a) Dot-plot showing the results of a CRISPR-Cas9 base-editor screen in MOLM13 cells aiming to identify point mutations that cause resistance to Menin inhibitor treatment. Each dot represents a single guide RNA. Along the x-axis guide RNAs are sorted by their targeting location relative to the Menin-coding sequence. The y-axis shows differential CRISPR-beta-scores (DMSO-score subtracted from the VTP-50469-treatment score). Outstanding hits are marked in red and targeted amino acid residues are labeled. b) Structure alignment between co-crystal structure of revumenib bound to M327I-mutant Menin (PDB: 8E90) and revumenib bound to WT Menin (PDB: 7UJ4). revumenib is colored in yellow in WT Menin, and magenta in M327 mutant co-crystal structure. The magenta dashed lines indicate large distances, incapable of H-bond interactions, between revumenib in the M327I-mutant and the WT Menin protein and are in contrast to H-bond between W346 and revumenib in the WT Menin highlighted in black dashed line. c) Fluorescence polarization assay measuring dose-dependent displacement of an MLL1 peptide from WT, M327I- and T349M-mutant Menin under treatment with revumenib, MI-3454 or DS-25, a compound from the Daiichi-Sankyo Menin-inhibitor series. Data is presented as fraction bound of three independent replicates (N=3). Data point represent the mean +/− SD. d) Fluorescence polarization assay probing the binding affinity of a MLL1 peptide to WT, M327I- and T349M-mutant Menin. Data is presented as fraction bound of three independent replicates (N=3). Data point represent the mean +/− SD.
Figure 3:
Figure 3:. MEN1 mutations confer resistance to Menin-inhibitor treatment in vitro.
a, b) Dose-response curves of a) MOLM13 (MLL::AF9) and b) OCI-AML3 (NPM1c) cells to revumenib upon expression of MEN1-M327I, -G331R, -T349M or -WT. Cell counts were measured by flow cytometry and displayed relative to the DMSO control (mean +/− SEM, n=4, each 3 technical replicates). c) Schematic depicting the CRISPR-Cas9 gene editing strategy utilized to insert the M327I mutation into the endogenous MEN1-locus. d) Growth curves showing expansion of MV4;11 (MLL::AF4) and OCI-AML3 (NPM1c) bulk cell populations over time after nucleofection under treatment with 50nM revumenib (mean +/− SD, n=3, individual data points/no technical replicates). e) Curves depicting the fraction of the MEN1-M327I mutant allele detected by ddPCR in MV4;11 and OCI-AML3 bulk cell populations over time under treatment with 50nM revumenib (in vitro clonal selection assay) (mean, n=1, DNA pooled from 3 replicates). f, g) Dose-response curves showing the sensitivity of MV4;11 (MLL::AF4) cells harboring MEN1-M327I mutations to f) revumenib, g) MI-3454 and the Daiichi-Sankyo compound. h) Dose-response curves showing the sensitivity of MV4;11 (MLL::AF4) cells harboring MEN1-T349M mutations to revumenib, MI-3454 and the Daiichi-Sankyo compound. f-h) Cell counts were measured by flow cytometry and displayed relative to the DMSO control (mean +/− SEM, n=4, each 3 technical replicates). d, f-h) Statistical analysis was perfomed using an unpired t-test, two tailed, multiple comparisons. *** p<0.001; **p<0.01; *p<0.05.
Figure 4:
Figure 4:. Menin chromatin binding and aberrant gene expression is rescued by MEN1 mutations.
a) Torpedo-plots of total Menin signal intensity around transcription start sites (TSS) from ChIP-sequencing (ChIPseq) in MV4;11-MEN1-WT and -M327I-mutant cells treated with revumenib (0.1μM, 1μM, 5μM) or DMSO as control. b) Read-normalized Menin-TSS-signal at MLL1-target genes in MV4;11 cells under revumenib treatment (mean +/− SD, 3000 data points per condition). One-way ANOVA with correction for multiple comparisons was used for statistical analysis. c) ChIPseq tracks of Menin and MLL1 at the MEIS1-locus in MV4;11 cells under revumenib treatment (representative example of 3 replicates). d, e) Heatmaps of RNAseq data showing the expression dynamics of all genes that are differentially expressed (DEGs, as defined by DESeq2 with an adjusted p-value<0.05 and a fold change>2) under treatment with a Menin-inhibitor in d) MV4;11 cells or e) PDX3. Kmeans clustering (4) was applied to generate heatmaps (Morpheus Tool) based on z-scores of DEGs, representative genes are used for annotation.

Comment in

References

    1. Rodrigues CP, Shvedunova M & Akhtar A Epigenetic Regulators as the Gatekeepers of Hematopoiesis. Trends Genet (2020). 10.1016/j.tig.2020.09.015 - DOI - PubMed
    1. Uckelmann HJ & Armstrong SA Chromatin Complexes Maintain Self-Renewal of Myeloid Progenitors in AML: Opportunities for Therapeutic Intervention. Stem cell reports 15, 6–12 (2020). 10.1016/j.stemcr.2020.05.013 - DOI - PMC - PubMed
    1. Yokoyama A et al. The menin tumor suppressor protein is an essential oncogenic cofactor for MLL-associated leukemogenesis. Cell 123, 207–218 (2005). 10.1016/j.cell.2005.09.025 - DOI - PubMed
    1. Yokoyama A & Cleary ML Menin critically links MLL proteins with LEDGF on cancer-associated target genes. Cancer cell 14, 36–46 (2008). 10.1016/j.ccr.2008.05.003 - DOI - PMC - PubMed
    1. Kuhn MW et al. Targeting Chromatin Regulators Inhibits Leukemogenic Gene Expression in NPM1 Mutant Leukemia. Cancer discovery 6, 1166–1181 (2016). 10.1158/2159-8290.CD-16-0237 - DOI - PMC - PubMed

Publication types

MeSH terms