. 2023 Mar;615(7953):712-719.
doi: 10.1038/s41586-023-05793-3. Epub 2023 Mar 15.

Spatial mapping of mitochondrial networks and bioenergetics in lung cancer

Affiliations

Spatial mapping of mitochondrial networks and bioenergetics in lung cancer

Mingqi Han et al. Nature. 2023 Mar.

Abstract

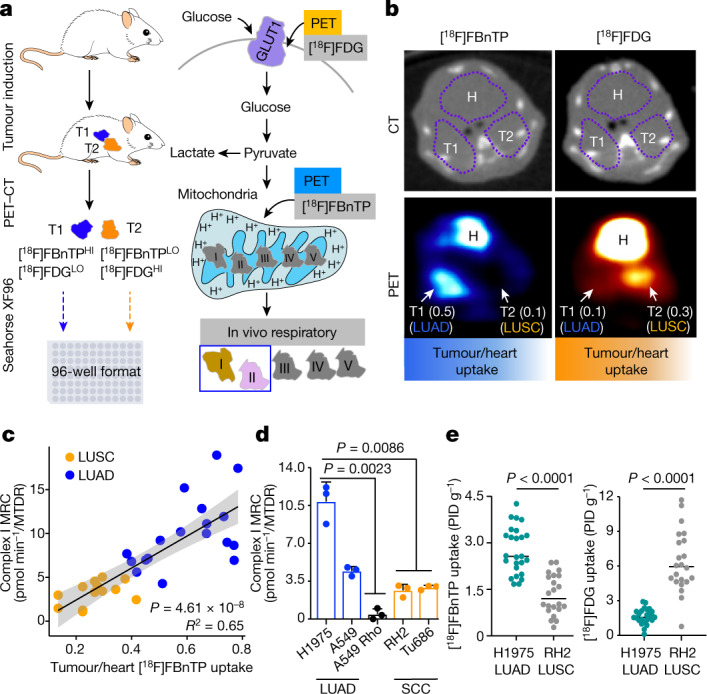
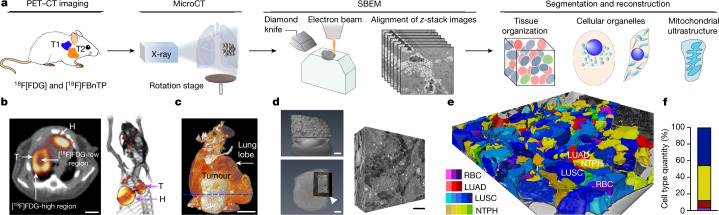
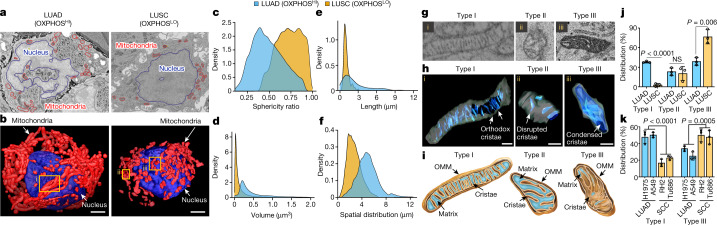
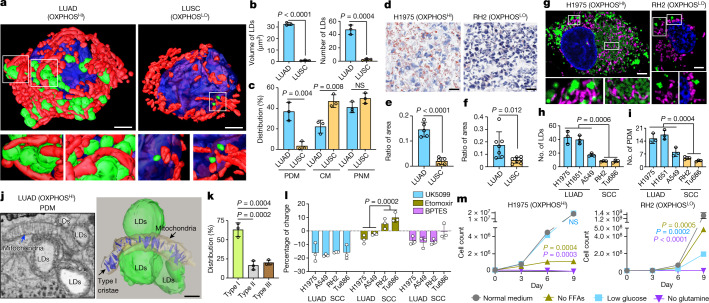
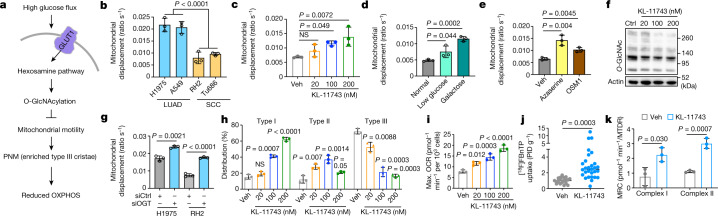
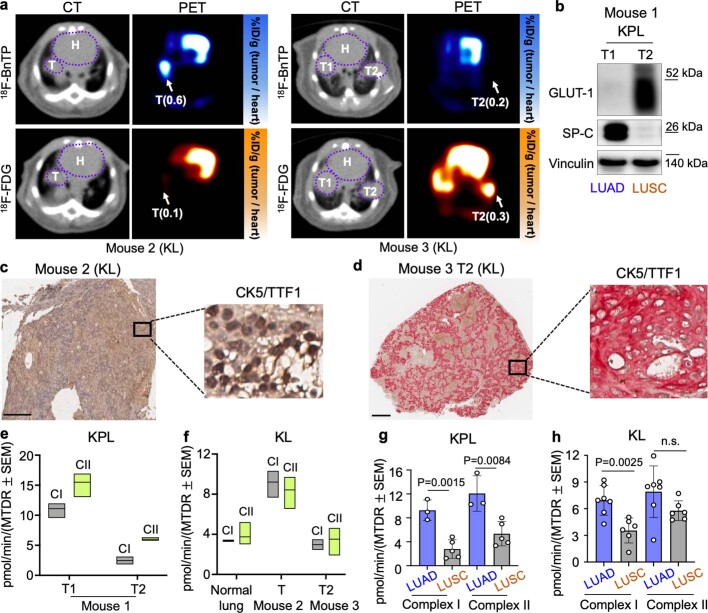
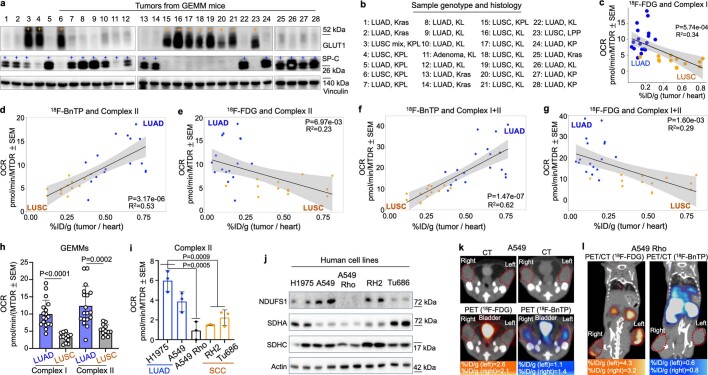
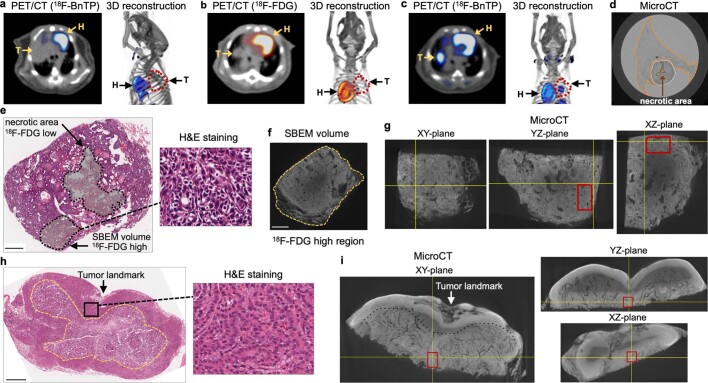
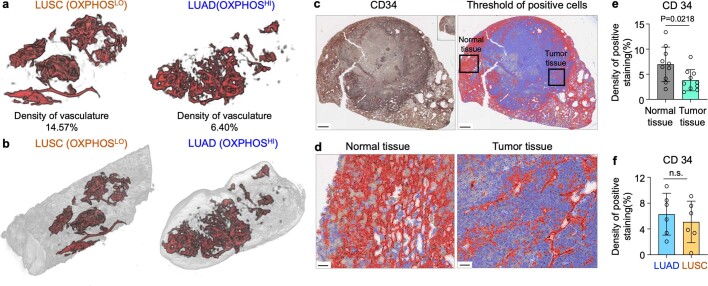
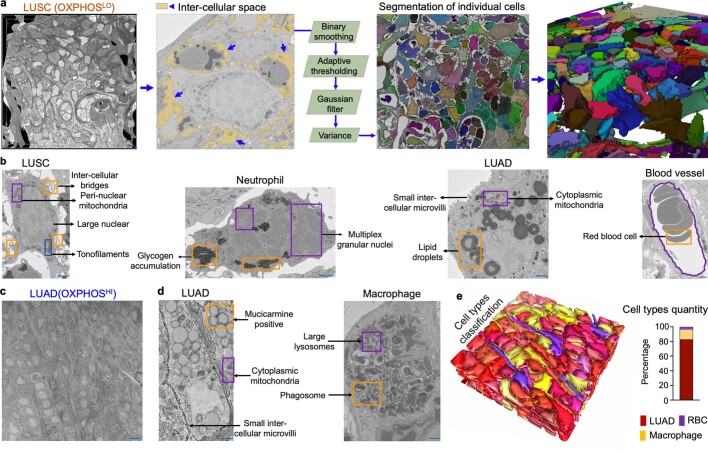
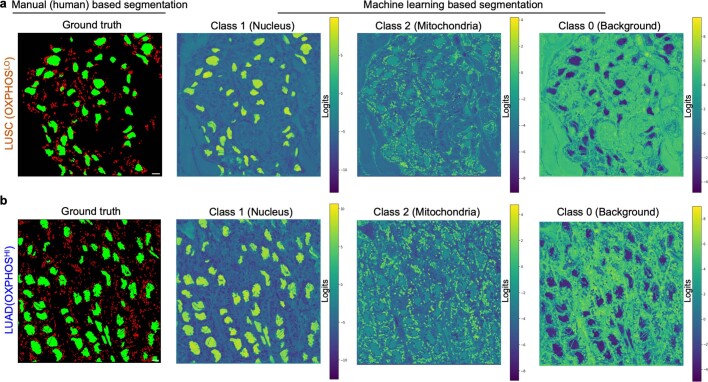
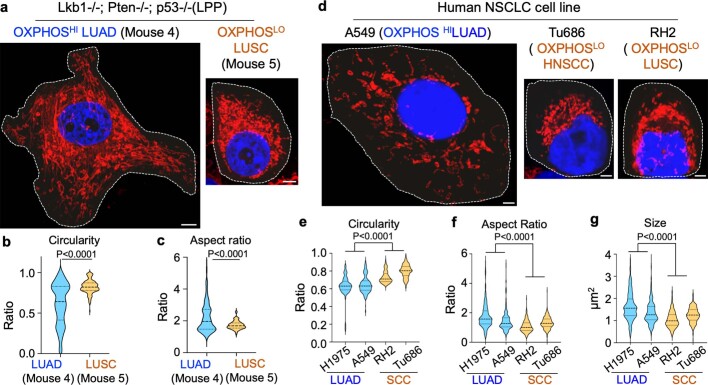
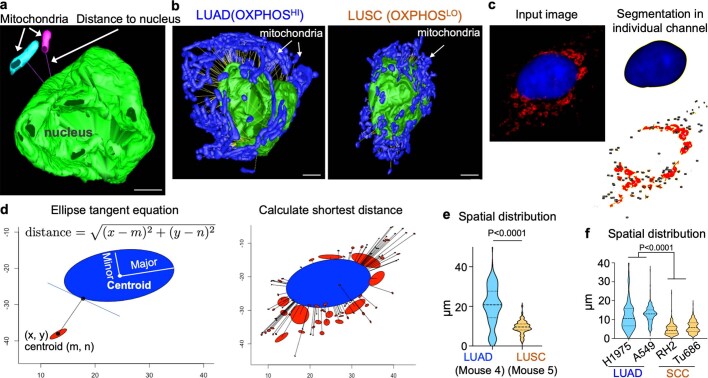
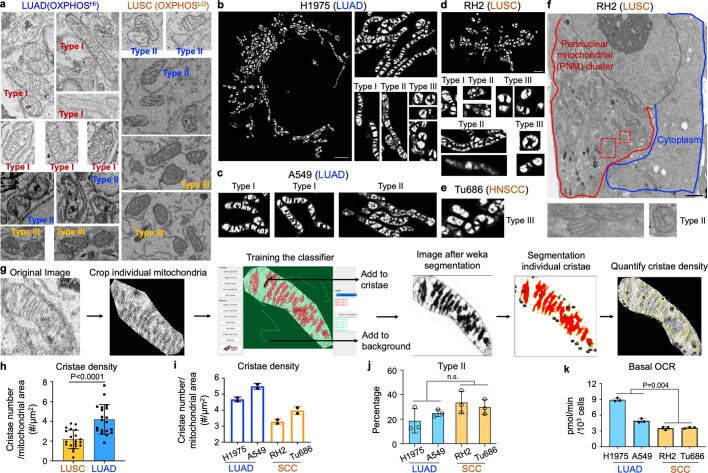
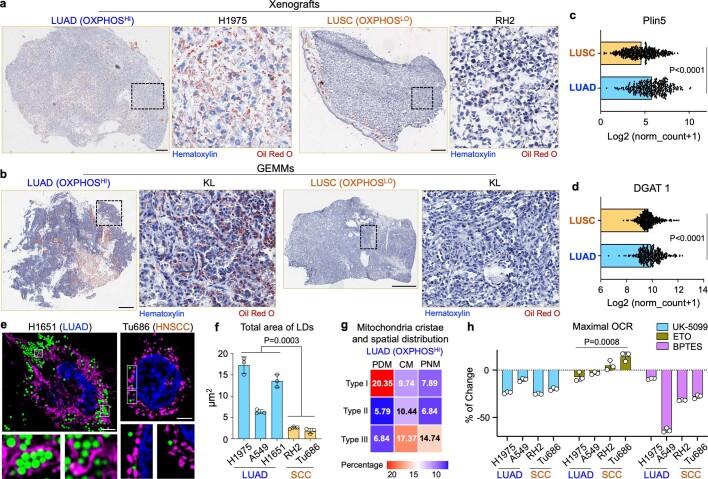
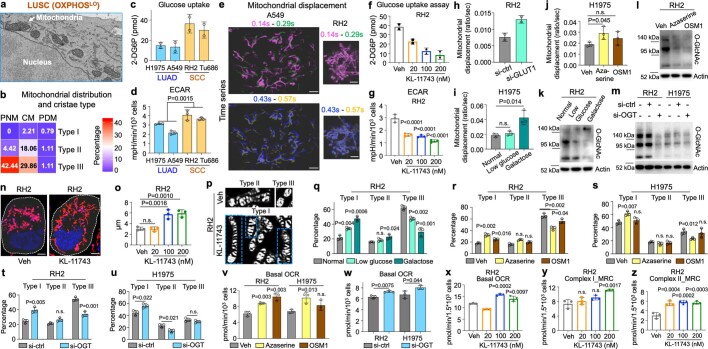
Mitochondria are critical to the governance of metabolism and bioenergetics in cancer cells1. The mitochondria form highly organized networks, in which their outer and inner membrane structures define their bioenergetic capacity2,3. However, in vivo studies delineating the relationship between the structural organization of mitochondrial networks and their bioenergetic activity have been limited. Here we present an in vivo structural and functional analysis of mitochondrial networks and bioenergetic phenotypes in non-small cell lung cancer (NSCLC) using an integrated platform consisting of positron emission tomography imaging, respirometry and three-dimensional scanning block-face electron microscopy. The diverse bioenergetic phenotypes and metabolic dependencies we identified in NSCLC tumours align with distinct structural organization of mitochondrial networks present. Further, we discovered that mitochondrial networks are organized into distinct compartments within tumour cells. In tumours with high rates of oxidative phosphorylation (OXPHOSHI) and fatty acid oxidation, we identified peri-droplet mitochondrial networks wherein mitochondria contact and surround lipid droplets. By contrast, we discovered that in tumours with low rates of OXPHOS (OXPHOSLO), high glucose flux regulated perinuclear localization of mitochondria, structural remodelling of cristae and mitochondrial respiratory capacity. Our findings suggest that in NSCLC, mitochondrial networks are compartmentalized into distinct subpopulations that govern the bioenergetic capacity of tumours.


Conflict of interest statement

S.M.D. is an advisory board member for EarlyDx Inc., T-Cure Bioscience Inc., Cynvenio Biosystems Inc. and the Johnson and Johnson Lung Cancer Initiative. M.V.P. and K.O. are full-time employees of Kadmon Corporation. A.L. reports the following: (1) Employment Company: Boston ScientificImmediate family member (wife); (2) Stock (<5% equity) Company: Boston Scientific Immediate family member (wife); (3) Commercial Research Grants Daiichi Sankyo, Calithera Biosciences, AstraZeneca, Dracen Pharmaceuticals, WindMIL eFFECTOR Therapeutics (4) Consultant/Advisory Board AstraZeneca, Bristol-Myers Squibb, Leica Biosystems, Jazz Pharmaceuticals, Novocure, Pfizer, MorphoSys, Eli Lilly, Oncocyte, Novartis, Regeneron, Janssen Oncology, Sanofi Group of Companies. All other authors declare no competing interests.

Figures

Fig. 1
Fig. 1. In vivo characterization of mitochondrial bioenergetics and respiration capacity among NSCLC subtypes.
a, Schematic depicting experimental approach of [18F]FBnTP and [18F]FDG PET imaging followed by respirometry on frozen tumour samples measuring mitochondrial complex I and complex II MRC. T1, tumour 1; T2, tumour 2. b, Representative [18F]FBnTP (left) and [18F]FDG (right) transverse PET–CT images of KPL mice. Uptake of PET probe was measured as the maximum percentage of injected dose (PID) per gram of tissue. Numbers in brackets after T1 and T2 indicate ratio of uptake tumour to heart. H, heart. c, Correlation between the tumour/heart ratio of [18F]FBnTP uptake and complex I MRC of tumours from KPL, KL, Kras, KP and LPP mice (n = 30 tumours, n = 18 LUAD tumours and n = 12 LUSC tumours). The MRC values are normalized to mitochondrial content quantified by MitoTracker Deep Red (MTDR). The grey shading represents s.e.m. One-tailed F-statistics. d, MRC of complex I in frozen xenografts from human cells (H1975, A549, A549 Rho, RH2 and Tu686); data are mean ± s.e.m. (n = 3 biological replicates per cell line). One-way analysis of variance (ANOVA), Dunnett test. e, [18F]FBnTP (n = 25 LUAD tumours, n = 22 LUSC tumours) and [18F]FDG (n = 22 LUAD tumours, n = 22 LUSC tumours) uptake of xenografts from human NSCLC cell lines (H1975 and RH2). Unpaired two-tailed t-test, lines indicate mean value. Source data
Fig. 2
Fig. 2. PET-guided multi-modality imaging to characterize spatial architecture of mitochondrial networks in NSCLC.
a, Schematic of multi-modality imaging technique and analysis approach. b, [18F]FDG transverse (left) and 3D-rendered (right) PET–CT images. [18F]FDGHI tumour (KL) was identified with heterogeneous regions of high and low [18F]FDG uptake. Scale bar, 5 mm. c, 3D-rendered microCT image of isolated lung lobe with tumour in b. Dashed line represents the orientation of sectioning plane on the tumour. Scale bar, 5 mm. d, Left: high-resolution microCT images on heavy-metal-stained tumour block. Selected region for SBEM imaging is indicated by white arrowhead. Scale bars, 500 μm (top) and 1 mm (bottom). Right: representative subvolume of SBEM images. Scale bar, 10 μm. e, The landscape of SBEM-imaged OXPHOSLO LUSC tumour volume after individual cell segmentation and cell-type classification. LUSC, blue; neutrophil (NTPH), yellow; red blood cell (RBC), purple; LUAD, red. f, Quantification of different cell types in e. Source data
Fig. 3
Fig. 3. Structural and spatial analysis of mitochondrial networks in SBEM-imaged NSCLC tumour volumes.
a, Representative 2D SBEM images of an OXPHOSHI LUAD cell and an OXPHOSLO LUSC cell. b, 3D reconstruction of nucleus (blue) and mitochondrial (red) networks segmented from NSCLC cells in a. Yellow boxes show elongated mitochondria (i) and fragmented mitochondria (ii,iii). Scale bars, 3 μm. cf, Density plots measuring mitochondrial sphericity (c), volume (d), length (e) and spatial distribution relative to nucleus surface (f) for OXPHOSHI LUAD cells (n > 50,000 mitochondria) and OXPHOSLO LUSC cells (n > 22,000 mitochondria). g,h, SBEM images and 3D reconstruction of representative type I (i), II (ii) and III (iii) crista structures identified in OXPHOSHI LUAD cells and OXPHOSLO LUSC cells. Scale bars, 500 nm (h). i, Illustration of type I, II and III crista structures. Outer mitochondrial membrane (OMM), matrix and inner mitochondrial membrane (cristae) are indicated. j, Percentage of mitochondrial type I, II and III crista distribution in OXPHOSHI LUAD cells (n = 3 biological replicates, n > 1,200 mitochondria) and OXPHOSLO LUSC cells (n = 3 biological replicates, n > 750 mitochondria). Data are mean ± s.e.m. Unpaired two-tailed t-test. k, Percentage of type I and III crista distribution in human LUAD (H1975, A549) and SCC (RH2, Tu686) cells. Data are mean ± s.e.m. (n = 3 biological replicates, n > 2,000 mitochondria). Unpaired two-tailed t-test. Source data
Fig. 4
Fig. 4. Enrichment of LDs and PDM in OXPHOSHI LUAD cells.
Data are mean ± s.e.m. (n = 3 biological replicates), unpaired two-tailed t-test unless specified otherwise. a, 3D reconstruction of LDs (green), mitochondria (red) and nucleus (blue) in an OXPHOSHI LUAD cell and an OXPHOSLO LUSC cell. Zoomed-in images (lower panels) are of the regions outlined in white from the  3D reconstructed cells (upper panels). The lower left panel is a side view of the interaction between mitochondria and LDs. The lower right panel comprises a front and back view of LDs in close proximity to but not contacting mitochondria. Scale bars, 3 μm. b, Quantification of the total volume and number of LDs in 3D-rendered LUAD and LUSC cells imaged by SBEM (n > 150 LDs). c, Percentage of spatially compartmentalized mitochondria in OXPHOSHI LUAD cells (n = 3 biological replicates, n > 1,200 mitochondria) and OXPHOSLO LUSC cells (n = 3 biological replicates, n > 750 mitochondria). d, Co-staining of oil red O and haematoxylin in OXPHOSHI LUAD (H1975) and OXPHOSLO LUSC (RH2) human xenografts. Scale bars, 40 μm. e,f, Ratio of area between oil red O and haematoxylin staining for OXPHOSHI LUAD and OXPHOSLO LUSC xenografts (e, n = 5 LUAD tumours, n = 5 LUSC tumours) and GEMMs (f, n = 6 LUAD tumours, n = 7 LUSC tumours). g, Co-staining of MTDR (purple), BODIPY (green) and Hoechst (blue) in H1975 and RH2 cells. Scale bars, 3 μm. h,i, Average number of LDs and PDM in human LUAD and SCC cells (n > 300 cells per cell line). j, 2D SBEM image (left) and 3D reconstruction (right) of PDM and associated crista structure of an OXPHOSHI LUAD cell. Scale bar, 500 nm. k, Percentage of type I, II and III cristae in PDM population (n > 400 mitochondria). One-way ANOVA, Dunnett test. l, Percentage of change in basal OCR of human LUAD and SCC cells in response to UK5099, etomoxir and BPTES. m, Cell count of H1975 and RH2 cells proliferating under the conditions of normal medium (25 mM glucose), and medium with no free fatty acids (FFAs), low glucose (12 mM) or no glutamine. Source data
Fig. 5
Fig. 5. Glucose flux regulates mitochondrial motility and remodels crista structure through hexosamine pathway in OXPHOSLO LUSC.
Data are mean ± s.e.m. (n = 3 biological replicates), unpaired two-tailed t-test unless specified otherwise. a, Diagram of proposed model that glucose flux regulates the remodelling of mitochondrial cristae and reduction of OXPHOS function through hexosamine pathway. be, Basal mitochondrial displacement in human LUAD (H1975 and A549) and SCC (RH2 and Tu686) cells (b) and vehicle (Veh)- or treatment-driven mitochondrial displacement in RH2 cells (ce). RH2 cells were treated with KL-11743 at indicated concentrations for 72 h (c), low-glucose (5.5 mM) and galactose medium for 24 h (d), or the hexosamine pathway inhibitors azaserine (0.5 μM) and OSM1 (25 μM) for 72 h (e). n = 150 per cell line or per treatment condition. One-way ANOVA, Dunnett test (c). f, Western blots of RH2 cells treated with indicated concentrations of KL-11743 for 72 h probed with indicated antibodies. g, Mitochondrial displacement in RH2 and H1975 cells treated with Ctrl siRNA (siCtrl) and OGT siRNA (siOGT) for 72 h. n = 150 per treatment condition. h, Percentage of type I, II and III cristae in RH2 cells treated with indicated concentrations of KL-11743. n > 1,500 mitochondria. One-way ANOVA, Dunnett test. i, Mitochondrial maximal OCR in RH2 cells treated with indicated concentrations of KL-11743 for 72 h. One-way ANOVA, Dunnett test. j,k, [18F]FBnTP uptake (j) and complex I and II MRC (k) of subcutaneous xenografts of human LUSC (RH2) cells treated with vehicle or KL-11743 (100 mg kg−1, 10 days). (j) n = 22 tumours for Veh; n = 29 tumours for KL-11743. Source data
Extended Data Fig. 1
Extended Data Fig. 1. PET/CT imaging, histology and respirometry analysis on KrasG12D/+ and Lkb1−/− driven tumors.
a, Representative transverse images of PET/CT probed with 18F-BnTP (top) and 18F-FDG (bottom) in KrasG12D/+; Lkb1−/− (KL) mice. Uptake of PET probe was measured by the maximum percentage of inject dose per gram (%ID/g). Ratio of %ID/g by tumor to %ID/g by heart is labeled as %ID/g (tumor/heart). H-heart, T-tumor. b, Whole cell lysates of lung tumors T1 and T2 isolated from KrasG12D/+; Lkb1−/−; p53−/− (KPL) mouse were immunoblotted with the antibodies of GLUT1 and SP-C. c,d, Immunohistochemical staining of TTF-1 and CK-5 in sections from 18F-BnTPHI tumor (mouse 2, left panel) and 18F-BnTPLO tumor (T2 in mouse 3, right panel). Scale bar = 500 μm. e,f, Maximal respiration capacity (MRC) of mitochondrial Complex I (CI) and Complex II (CII) isolated from frozen tissues of T1 and T2 in mouse 1 (KPL) (e) and from T in mouse 2 (KL) and T2 in mouse 3 (KL) (f). Data are n = 3 technical replicates, box was interleaved low-high, line at mean. g,h, MRC of Complex I and Complex II in LUAD and LUSC from KPL mice (n = 8 tumors, 3 LUAD tumors and 5 LUSC tumors) (g) and from KL mice (n = 13 tumors, 7 LUAD tumors and 6 LUSC tumors) (h). Data are mean ± s.e.m., unpaired two-tailed t-test. Source data
Extended Data Fig. 2
Extended Data Fig. 2. PET/CT imaging, histological markers and respirometry analysis on 5 different genetically modified mouse models (GEMMs) and xenografts of human cells.
a, Whole cell lysates of lung tumors isolated from KPL, KL, KrasG12D/+ (Kras), KrasG12D/+; p53−/−(KP) and Lkb1−/−; p53−/−; Pten−/−(LPP) mice immunoblotted with the antibodies of GLUT1 and SP-C. b, Sample ID, genotype and histology of each tumor are listed. c, Correlation between %ID/g (tumor/heart) of 18F-FDG uptake and Complex I MRC of tumors from KPL, KL, Kras, KP and LPP mice (n = 30 tumors, n = 18 LUAD tumors and n = 12 LUSC tumors). One-tailed F-statistics. d–g, Correlation between %ID/g (tumor/heart) of 18F-BnTP (d,f) and 18F-FDG (e,g) uptake and MRC of Complex II (d,e) and Complex I+II (f,g) in tumors from KPL, KL, Kras, KP and LPP mice (n = 30 tumors, n = 18 LUAD tumors and n = 12 LUSC tumors). One-tailed F-statistics. h, MRC of Complex I and Complex II in frozen LUAD cells and LUSC cells from Kras, KL, KP, KPL and LPP mice (n = 30 tumors, 18 LUAD tumors and 12 LUSC tumors. Data are mean ± s.e.m., unpaired two-tailed t-test. i, MRC of Complex II in frozen xenografts from human cells (H1975, A549, A549 Rho, RH2 and Tu686); Data are mean ± s.e.m. (n = 3 biological replicates per cell line). One-way ANOVA, Dunnett test. j, Immunoblots of Complex I subunit (NDUFS1) and Complex II subunits (SDHA and SDHC) in whole cell lysates from LUAD (H1975, A549, A549 Rho), LUSC (RH2) and HNSCC (Tu686) cell lines. k, Transverse images of PET/CT probed with 18F-BnTP (right) and 18F-FDG (left) in subcutaneous xenografts implanted with A549 cells. Uptake of PET probe was measured by the maximum percentage of inject dose per gram (%ID/g). l, Coronal view of PET/CT overlayed images probed with 18F-BnTP (right) and 18F-FDG (left) in subcutaneous xenografts implanted with A549 Rho cells. Uptake of PET probe was measured by the maximum percentage of inject dose per gram (%ID/g). Source data
Extended Data Fig. 3
Extended Data Fig. 3. PET guided microCT analysis to select regions for SBEM imaging.
a,b,c, Transverse view and 3D reconstruction of PET/CT overlayed images probed with 18F-BnTP (a,c) and 18F-FDG (b) of 18F-FDGHI LUSC tumor in Fig. 2b (a) and 18F-BnTPHI LUAD tumor (b,c). d, MicroCT image showed the position of tumor (white outlined) in the lung lobe (orange outlined). Dense tumor region is distinguished from tissue sparse necrotic area (brown outlined) by tissue density. e,h, Hematoxylin and eosin (H&E) staining of sections from OXPHOSLO LUSC tumor (e) and OXPHOSHI LUAD tumor (h). Scale bar = 500 μm. (e) Arrows indicated necrotic area and selected region for SBEM imaging in OXPHOSLO LUSC tumor. (h) Arrow indicated the tumor landmark, box indicated selected region for SBEM imaging in OXPHOSHI LUAD tumor. f, High-resolution microCT image of selected SBEM region with high 18F-FDG signal and dense tumor tissue indicated in (e). Scale bar = 200 μm. g,i, Cross-sections of XY, YZ and XZ planes in 3D rendered microCT images on heavy-metal stained OXPHOSLO LUSC tumor (g) and OXPHOSHI LUAD tumor (i). Selected regions for SBEM imaging were indicated in the red boxes.
Extended Data Fig. 4
Extended Data Fig. 4. Vascular density in lung normal tissues and tumor tissues measured by microCT and endothelial marker.
a,b, Reconstruction of vascular structure (a) segmented from microCT images (b) by gaussian and binary morphological filters in OXPHOSLO LUSC (left panel) and OXPHOSHI LUAD (right panel) tumors. The density of vasculature was indicated. c,d, Representative of immunohistochemical staining of CD 34 on the section of a OXPHOSLO LUSC tumor (c, left panel). The threshold of positive CD 34 staining was identified using QuPath and indicated by red labeling (c, right panel). Scale bar (c) = 500 μm. Selected normal tissue region and tumor region in black boxes were zoomed-in (d). Scale bar (d) = 50 μm. e,f, Density of positive CD 34 staining in normal tissues (n = 10) and tumor tissues (n = 10) (e), and in LUAD (n = 6) and LUSC (n = 6) (f). Data are mean ± s.e.m., unpaired two-tailed t-test. Source data
Extended Data Fig. 5
Extended Data Fig. 5. Individual cell segmentation and cell type identification in LUSC and LUAD SBEM volumes.
a, SBEM volume (75 μm*75 μm*12 μm) of OXPHOSLO LUSC tumor (left panel). Inter-cellular space between LUSC cells and neutrophils is colored as yellow and images were processed in Amira (central panel) with steps of binary smoothing, adaptive thresholding, Gaussian filter and variance to achieve individual cell segmentation. Individual cells were segmented from serial 2D SBEM images were reconstructed in 3D volume (right panel). Scale bar = 10 μm. b, Morphological features and special organelle structures were used to distinguish the cell types of LUSC, neutrophil (NTPH), LUAD and red blood cell (RBC) in OXPHOSLO LUSC SBEM volume. Scale bar = 3 μm. c, Representative 2D SBEM image of OXPHOSHI LUAD tumor. Scale bar = 15 μm. d, Morphological features and special organelle structures identified in the cell types of LUAD and macrophage from OXPHOSHI LUAD SBEM images. Scale bar = 3 μm. e, The landscape of SBEM imaged OXPHOSHI LUAD tumor volume after individual cell segmentation and cell-type classification (left panel). Quantification of different cell types (right panel). LUAD-red, macrophage-yellow, red blood cell (RBC)-purple. Source data
Extended Data Fig. 6
Extended Data Fig. 6. Machine learning based trinary segmentation of nucleus, mitochondria and background in SBEM images.
a,b, manual labeling of nucleus (green) and mitochondria (red) was used as ground truth (left panel). U-Net encoder decoder architecture of convolution neural network (CNN) was trained for the trinary segmentation of class 1 (nucleus), class 2 (mitochondria) and class 3 (background) in OXPHOSHI LUAD and OXPHOSLO LUSC SBEM volumes (right panel). Scale bar = 6 μm.
Extended Data Fig. 7
Extended Data Fig. 7. Morphological analysis of mitochondrial networks in mouse and human NSCLC cells cultured in vitro.
a, Representative confocal Airyscan images stained with Mitotracker deep red (MTDR, red) and Hoechst (blue) of mouse NSCLC cells derived from OXPHOSHI LUAD (mouse 4, LPP) and OXPHOSLO LUSC (mouse 5, LPP). Scale bar = 5 μm. b,c, Violin plots showing mitochondrial morphological descriptors (circularity and aspect ratio) in mouse LUAD and LUSC cells, n > 150 cells per cell line, 3 biological replicates; unpaired two-tailed t-test. d, Representative confocal Airyscan images stained with MTDR (red) and Hoechst (blue) of human OXPHOSHI LUAD (H1975, A549) and OXPHOSLO SCC (RH2, Tu686) cell lines. Scale bar = 4 μm. e–g, Violin plots of mitochondrial morphological descriptors (circularity and aspect ratio) and mitochondrial size (area) in human LUAD cell lines (H1975, A549) and SCC cell lines (RH2, Tu686). Data are from n = 3 biological replicates, n > 240 cells per cell line, unpaired two-tailed t-test. Source data
Extended Data Fig. 8
Extended Data Fig. 8. Spatial analysis of mitochondrial networks in mouse and human NSCLC cells cultured in vitro.
a, Illustration of the distance between nucleus and mitochondrial meshed surface using mtk program in Imod. Scale bar = 5 μm. b, Mitochondrial spatial distribution was relative to nucleus and measured by the distance between individual mitochondria to the surface of corresponding nucleus in OXPHOSHI LUAD (left panel) and OXPHOSLO LUSC (right panel) cells imaged by SBEM. Scale bar = 3 μm. c,d, Schematic of the method developed for measuring the distance between nucleus and mitochondria in 2D confocal Airyscan images. Nucleus and mitochondria are segmented in ImageJ and reconstructed in ellipse shape with the parameters of centroid coordinates, major and minor axes, and angle. The shortest distance between mitochondrial centroid and nucleus ellipse equation is estimated by solving the Lagrangian function. e,f, Violin plots of the spatial distribution of mitochondria network in mouse (e) and human (f) OXPHOSHI LUAD and OXPHOSLO LUSC/SCC cells. Data are from n = 3 biological replicates, n > 150 cells per cell line (e), n > 240 cells per cell line (f), unpaired two-tailed t-test. Source data
Extended Data Fig. 9
Extended Data Fig. 9. Mitochondrial cristae types in mouse and human NSCLC cells imaged by SBEM and confocal Airyscan.
a, Representative of mitochondrial cristae structure in SBEM images of OXPHOSHI LUAD (left panel) and OXPHOSLO LUSC (right panel). The classification of type I, II and III cristae was indicated in the representative images. b–e, Representative of mitochondrial cristae structure of OXPHOSHI LUAD (b,c) and OXPHOSLO LUSC (d,e) cells imaged by confocal Airyscan and processed by WEKA segmentation (ImageJ). The classification of type I, II and III cristae was indicated in the representative images. Scale bar (b) = 3 μm. Scale bar (d) = 2 μm. f, Transmitted electron microscopy (TEM) image of OXPHOSLO LUSC (RH2) cell. Zoomed-in images from red boxes illustrated type II cristae structure. Scale bar = 3 μm. g, Workflow of mitochondrial cristae segmentation and quantification in SBEM images by trainable WEKA segmentation (ImageJ). h, Mitochondrial cristae density (cristae number/mitochondrial area) in OXPHOSHI LUAD and OXPHOSLO LUSC cells imaged by SBEM (n = 20 mitochondria per tumor type). Data are mean ± s.e.m., unpaired two-tailed t-test. i, Mitochondrial cristae density (cristae number/mitochondrial area) in human OXPHOSHI LUAD (H1975, A549) and OXPHOSLO SCC (RH2, Tu686) cells. Data are mean ± s.e.m. (n = 2 biological replicates, >100 cells per cell line). j, Percentage of type II cristae distribution in human LUAD (H1975, A549) and SCC (RH2, Tu686) cells. Data are mean ± s.e.m. (n = 3 biological replicates, n > 2,000 mitochondria). Unpaired two-tailed t-test. k, Basal OCR of in human OXPHOSHI LUAD (H1975, A549) and OXPHOSLO SCC (RH2, Tu686) cells. Data are mean ± s.e.m. (n = 3 biological replicates). Unpaired two-tailed t-test. Source data
Extended Data Fig. 10
Extended Data Fig. 10. Differential accumulation of lipid droplets (LDs) between OXPHOSHI LUAD and OXPHOSLO SCC.
a,b, Co-staining of oil red o and hematoxylin in OXPHOSHI LUAD and OXPHOSLO LUSC tumors from xenografts of human cells (a: H1975, RH2) and GEMMs (b: KL). Scale bar = 400 μm. c,d, The expression levels of Plin5 and DGAT1 in LUAD and LUSC tumors from The Cancer Genome Atlas (TCGA) analysis (n = 364 LUAD cells, n = 527 LUSC cells). Unpaired two-tailed t-test. e, Representative confocal Airyscan images stained with MitoTracker DeepRed (MTDR, purple), bodipy (green) and Hoechst (blue) in cultured human LUAD (H1651) and HNSCC (Tu686) cells. Scale bar = 5 μm. f, Quantification of total area of LDs per cell in human LUAD and SCC cells. Data are mean ± s.e.m. (n = 3 biological replicates, n > 300 cells per cell line). Unpaired two-tailed t-test. g, Heat map showing the percentage of mitochondrial population classified by both spatial distribution and cristae types in OXPHOSHI LUAD cells. Data are mean value from n = 3 biological replicates (n > 1,200 mitochondria). h, Percentage of change in maximal OCR of human LUAD and SCC cells in response to UK-5099, ETO and BPTES. Data are mean ± s.e.m. (n = 3 biological replicates), unpaired two-tailed t-test. Source data
Extended Data Fig. 11
Extended Data Fig. 11. Glycolytic LUSC cells rescue OXPHOS activity by glucose restriction and inhibition of hexosamine pathway.
Data are mean ± s.e.m. (n = 3 biological replicates), unpaired two-tailed t-test unless specified. a, Representative 2D SBEM image showing PNM and associated type III cristae in OXPHOSLO and glycolytic LUSC. b, Heat map showing the percentage of mitochondrial population classified by both spatial distribution and cristae types in OXPHOSLO LUSC cells. Data are mean value from n = 3 biological replicates (n > 750 mitochondria). c,d, Colorimetric assay measuring glucose uptake (c) and ECAR rate (d) in human LUAD (H1975, A549) and SCC (RH2, Tu686) cells. (c) n = 2 biological replicates. e, Representative of mitochondrial displacement by overlaying images from different time points in OXPHOSHI LUAD (A549) and OXPHOSLO LUSC (RH2) cells. Scale bar = 3 μm. f,g, Colorimetric assay measuring glucose uptake (f) and ECAR rate (g) in RH2 cells treated with vehicle (Veh) or KL-11743 with indicated concentrations for 72 h. (f) n = 2 biological replicates. (g) One-way ANOVA, Dunnett test. h, Mitochondrial displacement in RH2 cells treated with si-ctrl and si-GLUT1 for 72 h (n = 2 biological replicates, n > 60 per treating condition). i,j, Mitochondrial displacement in H1975 cells treated with low glucose (5.5 mM) and galactose medium for 24 h (i), hexosamine pathway inhibitors azaserine (0.5 μM) and OSM1 (25 μM) for 72 h (j). n > 100 per treating condition. k–m, Western blots were probed with indicated antibodies on lysates of RH2 cells treated with low glucose (5.5 mM) and galactose medium for 24 h (k), hexosamine pathway inhibitors azaserine (0.5 μM) and OSM1 (25 μM) for 72 h (l), and on lysates of RH2 and H1975 cells treated with si-ctrl and si-OGT for 72 h (m). n, Representative of confocal Airyscan imaged RH2 cells stained with MTDR (red) and Hoechst (blue) of after treatment of vehicle (Veh) or KL-11743 (200 nM) for 72 h, scale bar = 4 μm. o, Quantification of the spatial distribution of mitochondrial network in RH2 cells treated with Veh or KL-11743 with indicated concentrations. n = 300 cells per treating condition. One-way ANOVA, Dunnett test. p, Representative of confocal Airyscan imaged cristae structure (type I, II and III) in RH2 cells treated with Veh or KL-11743 (200 nM, 72 h) and stained with 10-N-nonyl acridine orange (NAO) and followed by Weka segmentation (ImageJ). q–u, Percentage of type I, II, III cristae in RH2 and H1975 cells treated with low glucose (5.5 mM) and galactose medium for 24 h (q), hexosamine pathway inhibitors azaserine (0.5 μM) and OSM1 (25 μM) for 72 h (r,s) and si-ctrl and si-OGT for 72 h (t,u). n > 600 mitochondria per treating condition. v,w, Mitochondrial basal OCR in RH2 and H1975 cells treated with hexosamine pathway inhibitors azaserine (0.5 μM) and OSM1 (25 μM) for 72 h (v) and si-ctrl and si-OGT for 72 h (w). x–z, Mitochondrial basal OCR (x) and Complex I (y) and Complex II (z) MRC in RH2 cells treated with indicated concentrations of KL-11743 for 72 h. One-way ANOVA, Dunnett test. Source data
Extended Data Fig. 12
Extended Data Fig. 12. Mitochondrial motility, spatial distribution and respiration in OXPHOSHI LUAD and OXPHOSLO LUSC cells treated with the cytoskeleton disruptors.
Data are mean ± s.e.m. (n = 3 biological replicates), unpaired two-tailed t-test unless specified. a-d, Mitochondrial displacement in H1975 (a,c) and RH2 (b,d) cells treated with latrunculin A (1 μM) and nocodazole (6.7 μM) for 12 h (a,b), and treated with si-ctrl and si-Vimentin for 72 h (c,d). n > 90 cells per treating condition. e-h, Quantification of the spatial distribution of mitochondrial network in H1975 (e,g) and RH2 (f,h) cells treated with latrunculin A (1 μM) and nocodazole (6.7 μM) for 12 h (e,f), and treated with si-ctrl and si-Vimentin for 72 h (g,h). n > 150 cells per treating condition. i–l, Mitochondrial basal OCR in H1975 (i,k) and RH2 (j,l) cells treated with latrunculin A (1 μM) and nocodazole (6.7 μM) for 12 h (i,j), and treated with si-ctrl and si-Vimentin for 72 h (k,l). Source data

Comment in

  • Mapping out mitochondria.
    Dart A. Dart A. Nat Rev Cancer. 2023 May;23(5):273. doi: 10.1038/s41568-023-00572-8. Nat Rev Cancer. 2023. PMID: 37012413 No abstract available.

References

    1. Morais R, et al. Tumor-forming ability in athymic nude mice of human cell lines devoid of mitochondrial DNA. Cancer Res. 1994;54:3889–3896. - PubMed
    1. Perkins GA, Ellisman MH, Fox DA. Three-dimensional analysis of mouse rod and cone mitochondrial cristae architecture: bioenergetic and functional implications. Mol. Vis. 2003;9:60–73. - PubMed
    1. Cogliati S, et al. Mitochondrial cristae shape determines respiratory chain supercomplexes assembly and respiratory efficiency. Cell. 2013;155:160–171. doi: 10.1016/j.cell.2013.08.032. - DOI - PMC - PubMed
    1. Hensley CT, et al. Metabolic heterogeneity in human lung tumors. Cell. 2016;164:681–694. doi: 10.1016/j.cell.2015.12.034. - DOI - PMC - PubMed
    1. Weinberg F, et al. Mitochondrial metabolism and ROS generation are essential for Kras-mediated tumorigenicity. Proc. Natl Acad. Sci. USA. 2010;107:8788–8793. doi: 10.1073/pnas.1003428107. - DOI - PMC - PubMed

Publication types

MeSH terms