. 2023 Mar;615(7953):742-749.
doi: 10.1038/s41586-023-05798-y. Epub 2023 Mar 15.

Structural basis of odorant recognition by a human odorant receptor

Affiliations

Structural basis of odorant recognition by a human odorant receptor

Christian B Billesbølle et al. Nature. 2023 Mar.

Abstract

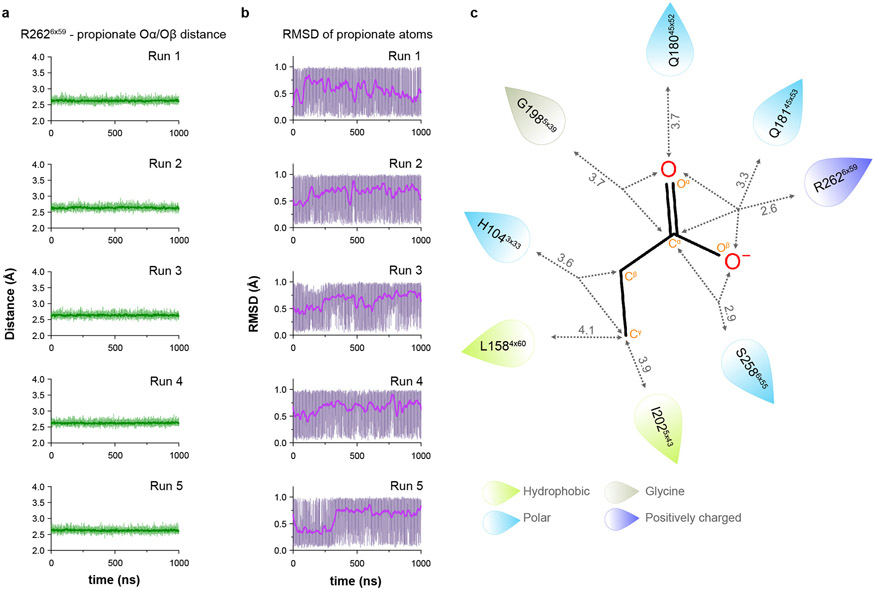
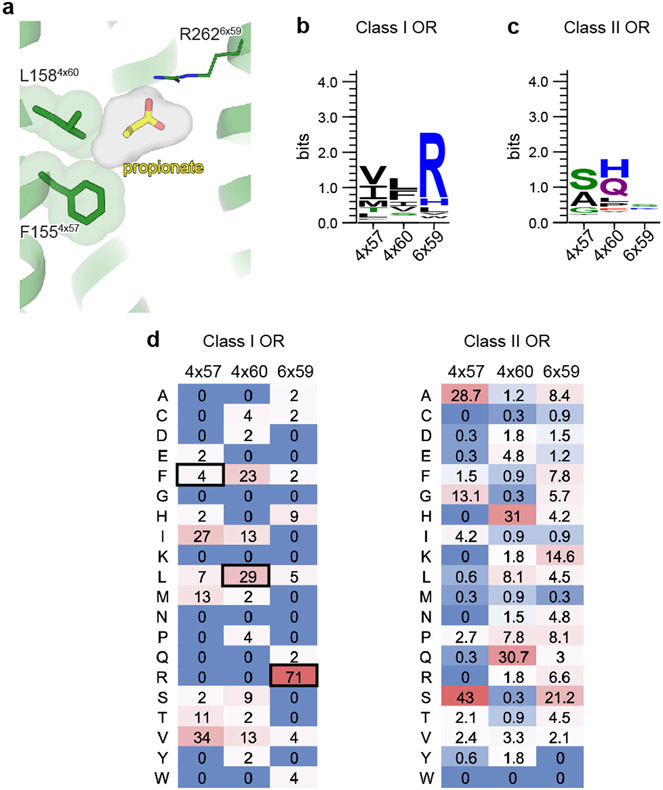
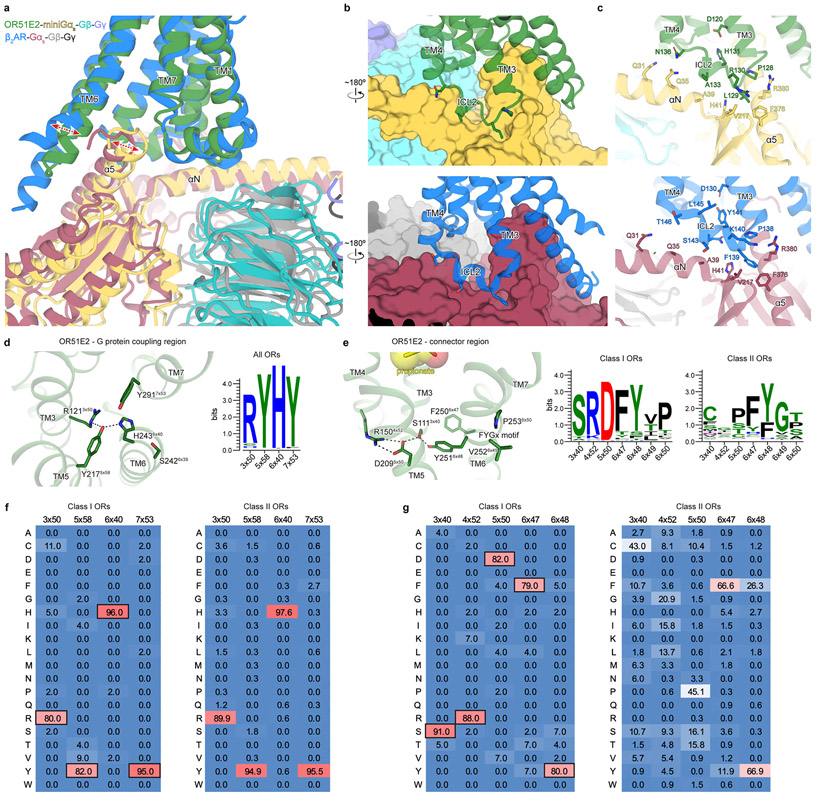
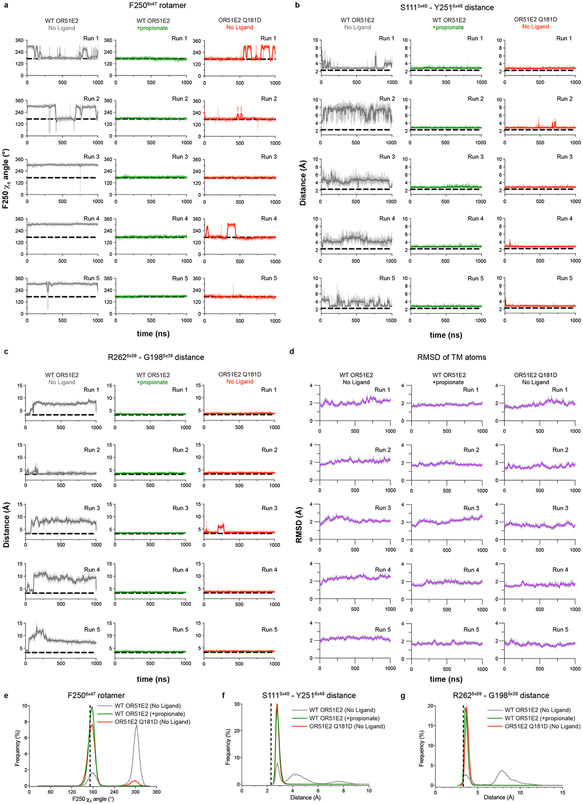
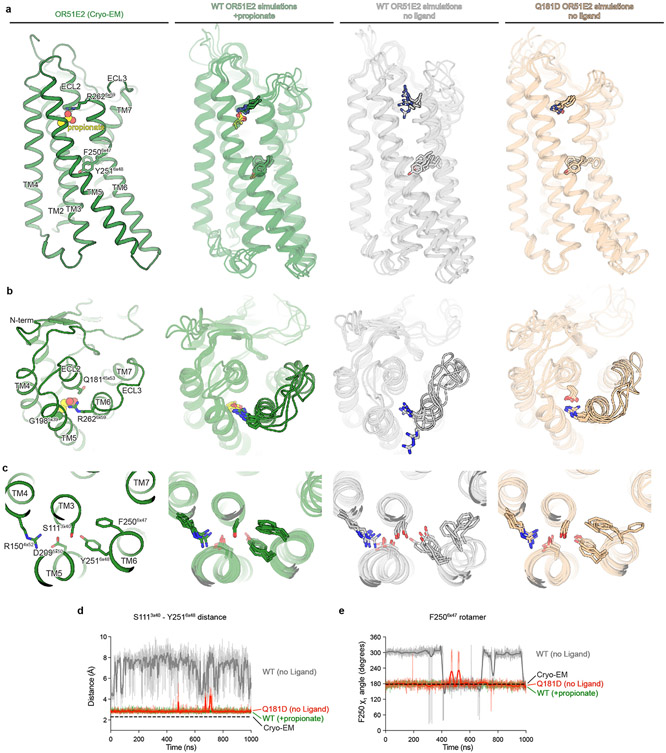
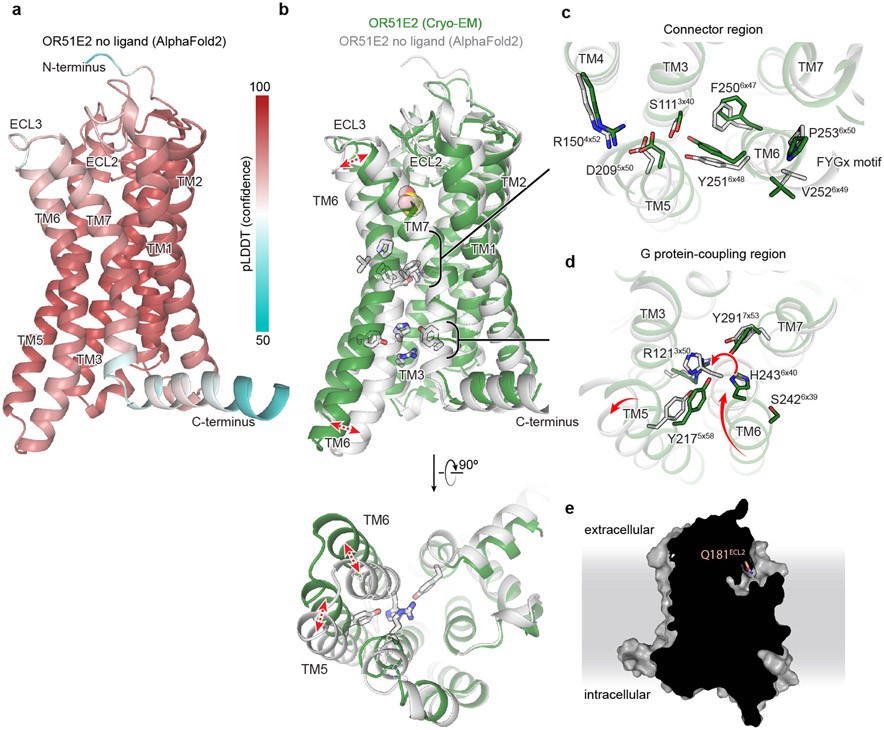
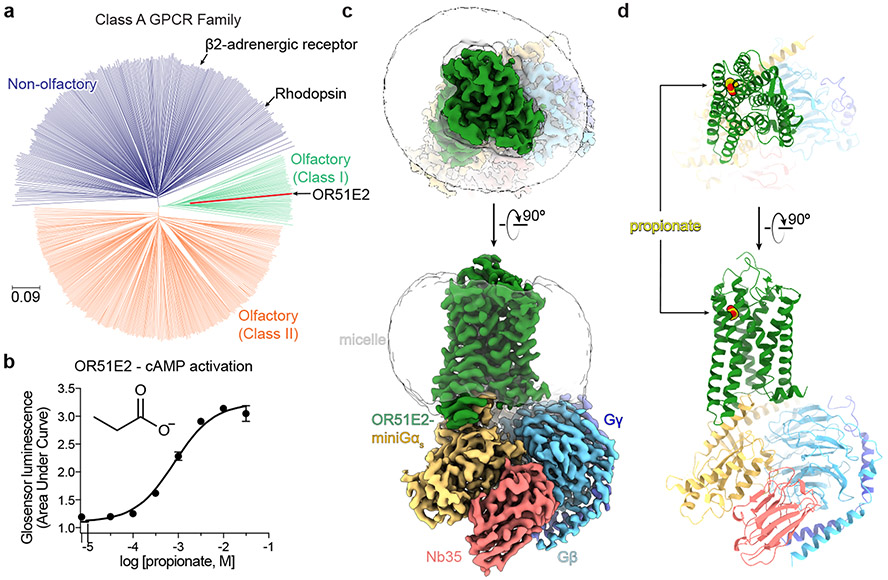
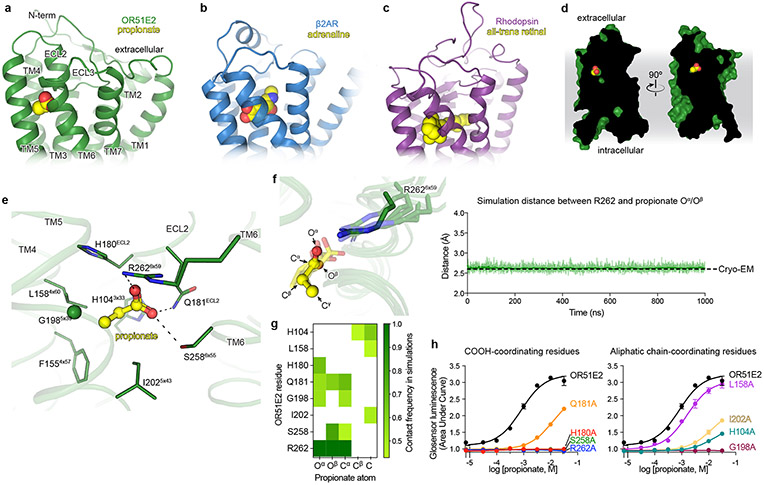
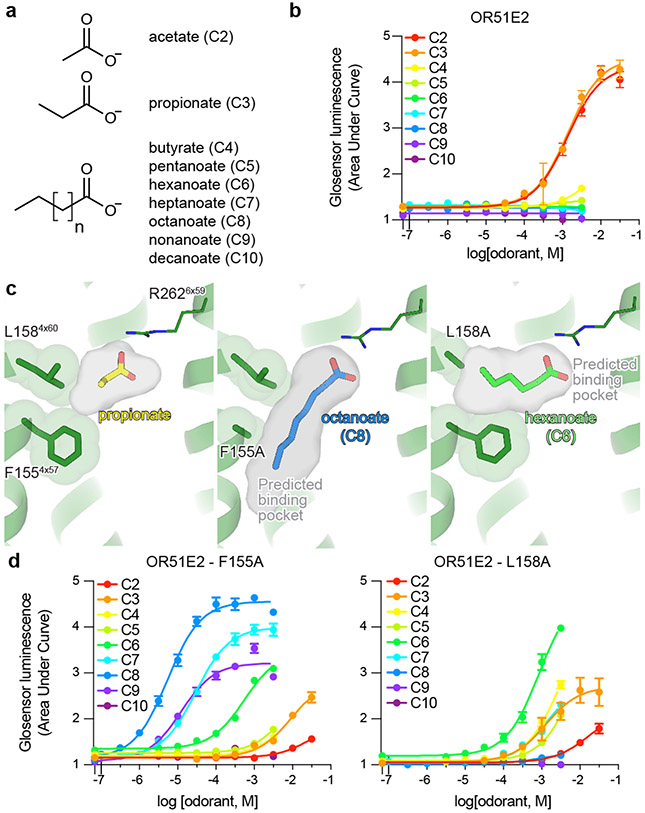
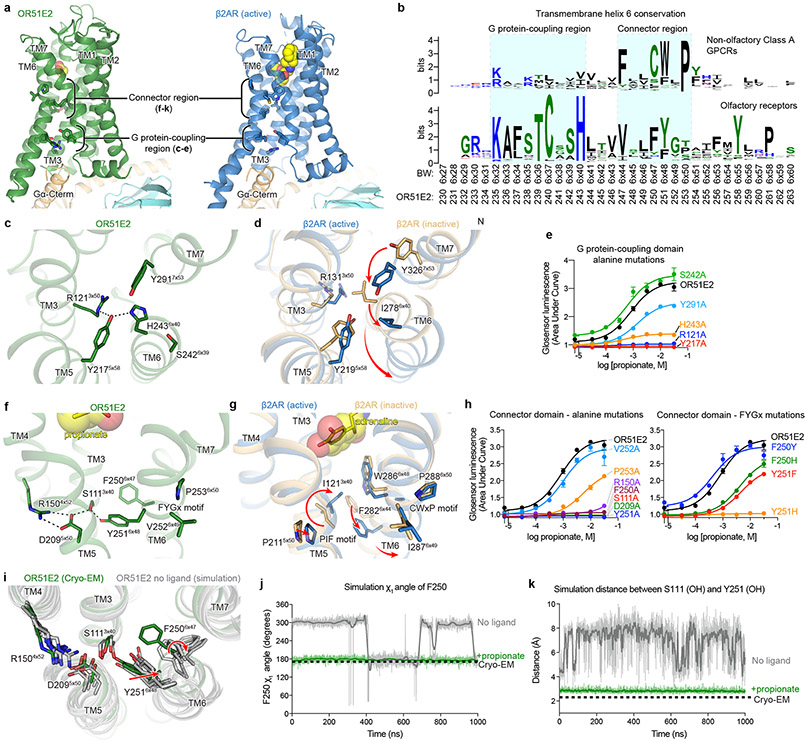
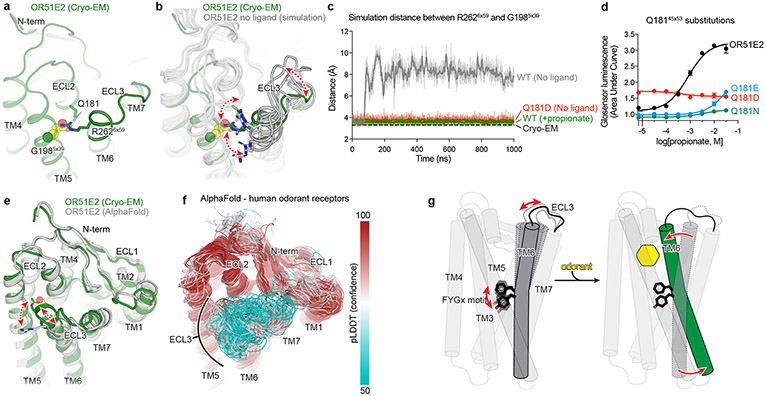
Our sense of smell enables us to navigate a vast space of chemically diverse odour molecules. This task is accomplished by the combinatorial activation of approximately 400 odorant G protein-coupled receptors encoded in the human genome1-3. How odorants are recognized by odorant receptors remains unclear. Here we provide mechanistic insight into how an odorant binds to a human odorant receptor. Using cryo-electron microscopy, we determined the structure of the active human odorant receptor OR51E2 bound to the fatty acid propionate. Propionate is bound within an occluded pocket in OR51E2 and makes specific contacts critical to receptor activation. Mutation of the odorant-binding pocket in OR51E2 alters the recognition spectrum for fatty acids of varying chain length, suggesting that odorant selectivity is controlled by tight packing interactions between an odorant and an odorant receptor. Molecular dynamics simulations demonstrate that propionate-induced conformational changes in extracellular loop 3 activate OR51E2. Together, our studies provide a high-resolution view of chemical recognition of an odorant by a vertebrate odorant receptor, providing insight into how this large family of G protein-coupled receptors enables our olfactory sense.


Figures

Extended Data Figure 1.
Alignment of OR51E2, rhodopsin and β2 adrenergic receptor (β2AR) amino acid sequences as described in part by de March et al. and implemented on GPCRdb. Conservation is highlighted from low (white) to high (dark blue) and the consensus amino acid is shown. Transmembrane domains are boxed in yellow. The most conserved residue in class A GPCRs for each transmembrane domain is boxed and labeled in orange. Residues used to align OR and Class A GPCR sequences are highlighted by asterisks, which are colored orange when the residue is common to all Class A GPCRs and black when it is specific to ORs. The most conserved residues used for numbering of the intracellular and extracellular loops are also indicated in italic when available. Generic numbers follow the revised Ballesteros-Weinstein numbering for Class A GPCRs,
Extended Data Figure 2.
Extended Data Figure 2.. Biochemical preparation of OR51E2-Gs complex bound to propionate.
a) Schematic outlining the strategy for stabilization and purification of the activated OR51E2-Gs complex bound to propionate. b) GloSensor cAMP assay demonstrating that fusion of miniGs to OR51E2 blocks activation of endogenous Gs in response to treatment with propionate, suggesting that miniGs couples to the OR51E2 transmembrane core. Data points are the mean of analytical replicates from a representative experiment. Error bars represent the standard deviation between replicates (n=4). c) Size-exclusion chromatogram of purified OR51E2-Gs-Nb35 complex used for structure determinations shown together with a representative SDS-PAGE gel analysis of the collected fraction containing the OR51E2-Gs-Nb35 complex. We observe two bands for OR51E2, likely due to heterogeneous glycosylation of the receptor N-terminus.
Extended Data Figure 3.
Extended Data Figure 3.. Cryo-EM data processing for OR51E2-Gs.
a) A representative cryo-EM micrograph from the curated OR51E2-Gs dataset (n = 8,010) obtained from a Titan Krios microscope. b) A subset of highly populated, reference-free 2D-class averages are shown. Scale bar is 50 Å. c) Schematic showing the image processing workflow for OR51E1-Gs. Initial processing was performed using UCSF MotionCor2 and cryoSPARC. Particles were then transferred using the pyem script package to RELION for alignment-free 3D classification. Finally, particles were processed in cryoSPARC using the non-uniform and local refinement tools. Dashed boxes indicate selected classes, and 3D volumes of classes and refinements are shown along with global Gold-standard Fourier Shell Correlation (GSFSC) resolutions. d, e) Map validation for the OR51E2-Gs (d) globally refined, and (e) locally refined cryo-EM maps. GSFSC curves are calculated in cryoSPARC, and shown together with directional FSC (dFSC) curves generated with dfsc.0.0.1.py as previously described. Map-model correlations calculated in the Phenix suite are also shown. Arrows indicate map and map-model resolution estimates at 0.143 and 0.5 correlation respectively. Euler angle distributions calculated in cryoSPARC are also provided for each map.
Extended Data Figure 4.
Extended Data Figure 4.. Cryo-EM density and atomic model.
a) Orthogonal views of local resolution for the globally refined map of OR51E2-Gs calculated with the local resolution estimation tool in cryoSPARC. b) Close-up view showing the local resolution of the propionate binding site. c) Representative cryo-EM densities from the 3D reconstruction of OR51E2 from a sharpened, globally refined map of OR51E2-Gs at a map threshold of 0.635. Shown are the transmembrane helices and loop regions of OR51E2 as well as the C-terminal helix of miniGαs. d) Close-up view of cryo-EM density (yellow sticks and density) supporting propionate binding pose using a sharpened map locally refined around only the 7TM domain of OR51E2 at map threshold of 1.0.
Extended Data Figure 5.
Extended Data Figure 5.. Interactions between propionate and OR51E2 in molecular dynamics simulations.
a) Minimum distance plot between R2626x59 and propionate from 5 independent runs at different velocities (top to bottom). Minimum distance was measured between guanidinium nitrogens of R2626x59 and oxygens of propionate. Thick trace represents smoothed values with an averaging window of 8 nanoseconds; thin trace represents unsmoothed values. b) Root-mean-square deviation (RMSD) values of production simulation runs for propionate calculated with reference to the equilibrated structure of OR51E2 prior to 1 μs production simulation from 5 independent runs at different velocities (top to bottom). c) Minimum distances (Ȧ) between ligand heavy atoms and residue side chain heavy atoms (hydrogen bond and van der Waals contacts combined) are shown in gray. Gray dashed arrows highlight the interactions made between a certain receptor residue and ligand atom(s). All distances are shown as means from n = 5 independent runs (at different velocities) each 1 μs long. Standard deviation of measurement for each of the residue-ligand distance are as follows; 0.03 Å (R2626x59), 0.10 Å(S2586x55), 0.16 Å (I2025x43), 0.12 Å (G1985x39), 0.23 Å (Q18145x53), 0.23 Å (H18045x52), 0.25 Å (L1584x60), and 0.14 Å (H1043x33).
Extended Data Figure 6.
Extended Data Figure 6.. Conservation of residues within the odorant binding pocket.
a) View of propionate-contacting residues. Conservation weblogo of key residues in Class I (b) and Class II ORs (c). d) The percentage of receptors harboring a given amino acid at each position are shown for all human Class I and Class II ORs. OR51E2 residues at each position are indicated by a black box.
Extended Data Figure 7.
Extended Data Figure 7.. Analysis of active state structure of OR51E2.
a) Structural comparison of G protein interaction for OR51E2 (green) and β2-adrenergic receptor (β2AR in blue, PDB code: 3SN6). b) Close-up views of intracellular loop 2 (ICL2) interaction with the Gαs subunit shown in surface representation. c) interactions between residues in ICL2 and the αN and α5 helices of the Gαs subunit. d) G protein-coupling region of OR51E2 is shown along with a weblogo (right) highlighting conservation of key residues for all human ORs. e) Residues that participate in the extended interaction hydrogen bonding network between TM3, TM4, TM5, and TM6 are conserved in human Class I ORs, but not in Class II ORs. f,g) The percentage of receptors harboring a given amino acid at each position are shown for all human Class I and Class II ORs at the G protein-coupling region and connector regions. OR51E2 residues at each position are indicated by a black box.
Extended Data Figure 8.
Extended Data Figure 8.. OR51E2 molecular dynamics simulation trajectories.
a-c) Simulation trajectories for WT and Q18145x53D OR51E2 are shown in a-c. Five independent runs at different velocities are shown for each condition (top to bottom). a) F2506x47 χ1 angle over replicate simulations. b) Minimum distance between oxygen atoms of the hydroxyl groups in the side chains of S111 and Y2516x48 over replicate simulations. c) Minimum distance between R2626x59 sidechain atoms and G1985x39 mainchain atoms (excluding the hydrogens) for replicate simulations. d) Root-mean-square deviation (RMSD) values for TM backbone atoms in the transmembrane helices (see methods) calculated with reference to the equilibrated structure of the no ligand and propionate bound OR51E2 simulations, as well as for simulations of Q18145x53D OR51E2 from 5 independent MD simulation replicates (top to bottom). Thick traces represent smoothed values with an averaging window of 8 nanoseconds; thin traces represent unsmoothed values. e-f) Aggregate frequency distributions are shown for F2506x47 χ1 angle (e), minimum distance between heavy atoms of the hydroxyl groups of S1113x40 and Y2516x48 (f), and minimum distance between R2626x59 sidechain heavy atoms and G1985x39 main chain heavy atoms (excluding hydrogens) (g) using all five simulation replicates for each condition.
Extended Data Figure 9.
Extended Data Figure 9.. Molecular dynamics snapshots of OR51E2.
a) Comparison of cryo-EM structure of propionate-bound OR51E2 with representative snapshots from simulations of WT OR51E2 with propionate, WT OR51E2 without ligand, and Q18145x53D OR51E2 without ligand. Notably, OR51E2 does not transition to the inactive conformation in any of these simulations. b) Close-up views of OR51E2 binding site and ECL3 region in the cryo-EM structure and simulations. In propionate-bound MD simulations of WT OR51E2, R2626x59 persistently forms an ionic interaction with propionate. In simulations of WT OR51E2 with propionate removed, R2626x59 is flexible. Introduction of Asp in position 45x53 (Q18145x53D) stabilizes R2626x59 in an active-like state by a direct ionic interaction. c) Close-up views of OR51E2 connector region shows increased flexibility of WT OR51E2 simulated without propionate. This flexibility is decreased for the Q18145x53D mutant. In a-c, displayed snapshots are the last 1000th ns snapshots from each simulation replicate. d and e) Molecular dynamics trajectories from representative simulations to highlight structural organization of connector region. d) Minimum distance between S1113x40 and Y2516x47 hydroxyl groups is comparable for Q18145x53D and propionate-bound WT OR51E2. e) Rotamer angle of F2506x47is comparable for Q18145x53D and propionate-bound WT OR51E2. Simulations were performed with or without propionate over the course of 1000 ns (see Extended Data Fig. 8 for replicates of simulation trajectories). Thick traces represent smoothed values with an averaging window of 8 nanoseconds; thin traces represent unsmoothed values.
Extended Data Figure 10.
Extended Data Figure 10.. AlphaFold2 model of OR51E2.
a) AlphaFold2 predicted structure of OR51E2. The pLDDT confidence metric is shown highlighting relatively high confidence in the transmembrane regions and extracellular loops. b) AlphaFold2 predicted structure of unbound OR51E2 (gray) superimposed onto the experimentally determined structure of propionate-bound OR51E2 in the active state (green cartoon and yellow spheres). In the AlphaFold2 model, TM6 is inwardly displaced compared to the active structure. Closeup views of (c) the Connector region and (d) the G protein-coupling region are provided. e) Slice through surface representation of AlphaFold2 predicted OR51E2, suggests solvent accessibility of the ligand binding site in the inactive state.
Figure 1.
Figure 1.. Structure of human odorant receptor OR51E2.
a) Phylogenetic tree of human Class A GPCRs, including both non-olfactory (blue) and odorant receptors. Odorant receptors are further divided into Class I (green) and Class II (orange). OR51E2 is a Class I OR. The phylogenetic distance scale is represented on the left bottom corner (the distance represents 9% differences between sequences). b) Real-time monitoring of cAMP concentration assay showing that human OR51E2 responds to the odorant propionate. Data points are mean ± standard deviation from n = 4 replicates. Cryo-EM density map (c) and ribbon model (d) of active human OR51E2 bound to propionate (yellow spheres). OR51E2 is fused to miniGαs and bound to both Gβγ and the stabilizing nanobody Nb35.
Figure 2.
Figure 2.. Odorant binding pocket in OR51E2.
Comparison of propionate binding site in OR51E2 (a) to two other prototypical Class A GPCRs, the β2-adrenergic receptor (β2AR) bound to adrenaline (PDB 4LDO) (b) and rhodopsin bound to all-trans retinal (PDB 6FUF) (c). Propionate primarily contacts TM4, TM5, TM6 and ECL2. By contrast adrenaline and all-trans retinal make more extensive contacts with other GPCR transmembrane helices. d) The binding site of propionate in active OR51E2 is occluded from extracellular solvent. e) Close-up view of propionate binding site in OR51E2. f) Representative molecular dynamics simulations snapshots of OR51E2 bound to propionate are shown as transparent sticks and overlaid on the cryo-EM structure. Displayed are the last snapshots of each simulation replicate, after 1000 ns of simulation time. R2626x59 makes a persistent contact with propionate over 1000 ns of an individual simulation (see Extended Data Fig. 8 for data on other simulation replicates. The complete MD simulation statistics are given in Supplementary Information Table 1 to 6). The minimum distance between any of R2626x59 sidechain nitrogens and propionate oxygens is shown. g) Heatmap of contact frequencies of interaction between OR51E2 binding site residues and propionate atoms (as labeled in (f)) obtained from five independent molecular dynamics simulations each 1 μs long (total time 5 μs). Contact frequency cutoff between receptor residue and ligand atoms were set at 40%. h) Alanine mutagenesis analysis of propionate-contacting residues in OR51E2 using a real-time monitoring of cAMP concentration assay. Data points are mean ± standard deviation from n = 3 experiments.
Figure 3.
Figure 3.. Tuning OR51E2 odorant selectivity.
a,b) OR51E2 responds selectively to the short chain fatty acids acetate and propionate as measured by a cAMP production assay. c) Docked poses of octanoate (C8) and hexanoate (C6) are shown in the predicted binding cavities of homology modeled OR51E2 mutants F1554x57A and L1584x60A. Binding pocket cavities are shown as gray surface. Replacement of F1554x57 and L1584x60 with alanine is predicted to yield a binding pocket with increased volume capable of accommodating longer chain fatty acids. d) The F1554x57A and L1584x60A mutations in OR51E2 lead to increased sensitivity to long chain fatty acids. Conversely, the potency for acetate and propionate is reduced for these two mutants. Data points in b and d are mean ± standard deviation from n = 4 experiments.
Figure 4.
Figure 4.. Activation mechanism of OR51E2.
a) Ribbon diagram comparing structures of propionate-bound OR51E2-miniGs complex (green) to BI-167107 bound β2AR-Gs complex (blue, PDB 3SN6). For both receptors, the connector region couples conformational changes at the ligand binding site with the G protein-coupling region. b) Weblogo depicting conservation of transmembrane helix 6 in either human odorant receptors or human non-olfactory Class A GPCRs. Amino acid numbering for OR51E2 and Ballosteros-Weinsten (BW) are indicated. Close-up view of the G protein-coupling domain in active OR51E2 (c) and both active and inactive β2AR (d). Activation of β2AR is associated with an inward movement of TM7 and a contact between Y2195x58 and Y3267x53. In OR51E2, H2436x40 interacts with Y2175x58 in the active state. e) Alanine mutagenesis of G protein-coupling domain residues in OR51E2 using a real-time cAMP concentration assay. Close-up views of the connector region in active OR51E2 (f) and both active and inactive β2AR (g). h) Mutagenesis of connector region residues in OR51E2 using a real-time cAMP concentration assay. i) Molecular dynamics simulations of OR51E2 with propionate removed. Snapshots displayed are the last snapshot from each of the five independent simulation replicates after 1000 ns of simulation time. Simulations show increased flexibility of TM6 in the connector region residues. Snapshots extracted from unbiased clustering analysis of the entire ensemble of MD trajectories show similar structural changes as these last snapshots (see Methods section, Supplementary Table 7 and Supplementary Fig. 1). Molecular dynamics trajectories for a representative simulation showing rotation of side chain rotamer angle of F2506x47 (j) and minimum distance between S1113x40 and Y2516x48 hydroxyl groups (k) performed with or without propionate over the course of 1000 ns MD simulation (see Extended Data Fig. 8 for simulation replicates). Thick traces represent smoothed values with an averaging window of 8 nanoseconds; thin traces represent unsmoothed values. Data points in e and h are mean ± standard deviation from n = 4 experiments.
Figure 5:
Figure 5:. Structural dynamics of ECL3 in OR function.
a) Residue R2626x59 in ECL3 makes a critical contact with propionate. Residue Q18145x53 in ECL2 is highlighted. b) Molecular dynamics simulations of OR51E2 with propionate removed shows increased flexibility of R2626x59. Representative snapshots are displayed from five independent simulation replicates after 1000 ns of simulation time. c) In simulations of wild-type (WT) OR51E2 bound to propionate, the minimum distance between R2626x59 and G1985x39 heavy atoms is stable and similar to the cryo-EM structure. Simulations of WT OR51E2 without propionate (no ligand) show increased minimum distance between R2626x59 and G1985x39. In simulations of Q18145x53D mutant without propionate, the minimum distance between R2626x59 and G1985x39 is similar to WT OR51E2 bound to propionate. Minimum distance was measured between R2626x59 sidechain atoms and G1985x39 main chain atoms (excluding the hydrogens) over the course of 1000 ns MD simulation (see Extended Data Fig. 8 for simulation replicates). Thick traces represent smoothed values with an averaging window of 8 nanoseconds; thin traces represent unsmoothed values. d) Conservative mutagenesis of Q18145x53 shows that the Q18145x53D mutant is constitutively active, potentially because it substitutes a carboxylic acid in the OR51E2 binding pocket. e) Comparison of cryo-EM structure of OR51E2 with the AlphaFold2 predicted structure shows high similarity in the extracellular domain with the exception of the ECL3 region. The AlphaFold2 model shows an outward displacement of R2626x59 and ECL3 similar to simulations of apo OR51E2. f) AlphaFold2 predictions for all human odorant receptors show low confidence in the ECL3 region and high confidence in other extracellular loops. g) A model for ECL3 as a key site for odorant receptor activation.

References

    1. Buck L, Axel R. A novel multigene family may encode odorant receptors: a molecular basis for odor recognition. Cell. 1991;65(1):175–187. - PubMed
    1. Malnic B, Hirono J, Sato T, Buck LB. Combinatorial receptor codes for odors. Cell. 1999;96(5):713–723. - PubMed
    1. Zhao H, Ivic L, Otaki JM, Hashimoto M, Mikoshiba K, Firestein S. Functional expression of a mammalian odorant receptor. Science. 1998;279(5348):237–242. - PubMed
    1. Mayhew EJ, Arayata CJ, Gerkin RC, Lee BK, Magill JM, Snyder LL, Little KA, Yu CW, Mainland JD. Transport features predict if a molecule is odorous. Proc Natl Acad Sci U S A. 2022;119(15):e2116576119. - PMC - PubMed
    1. Niimura Y, Matsui A, Touhara K. Extreme expansion of the olfactory receptor gene repertoire in African elephants and evolutionary dynamics of orthologous gene groups in 13 placental mammals. Genome Res. 2014;24(9):1485–1496. - PMC - PubMed

Publication types