. 2023 Mar;615(7953):705-711.
doi: 10.1038/s41586-023-05801-6. Epub 2023 Mar 15.

The dietary sweetener sucralose is a negative modulator of T cell-mediated responses

Affiliations

The dietary sweetener sucralose is a negative modulator of T cell-mediated responses

Fabio Zani et al. Nature. 2023 Mar.

Abstract

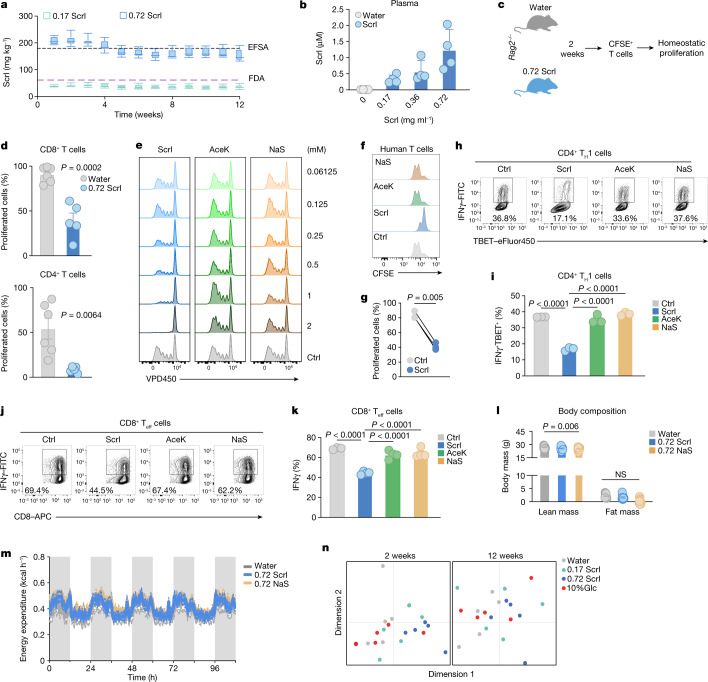
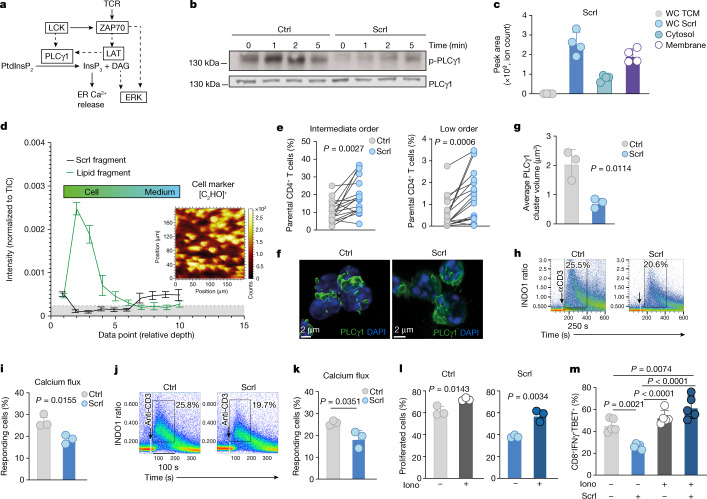
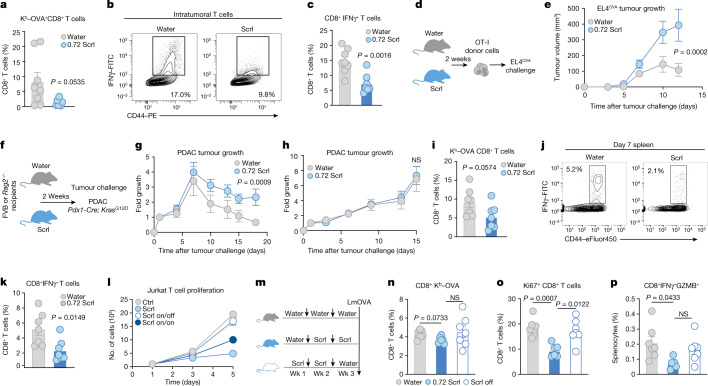
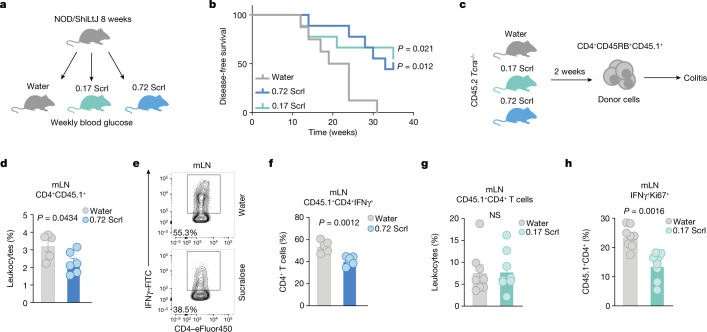
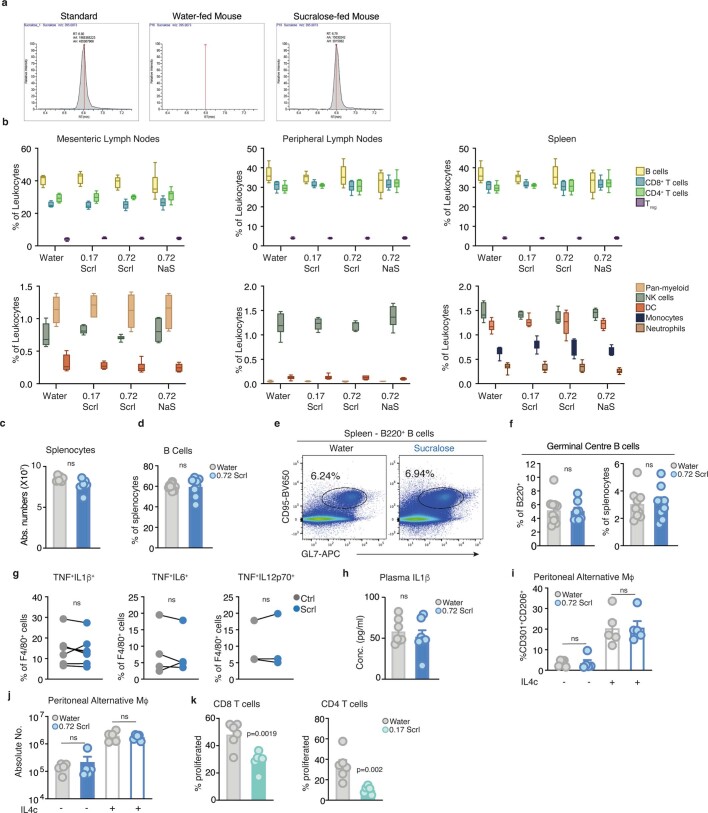
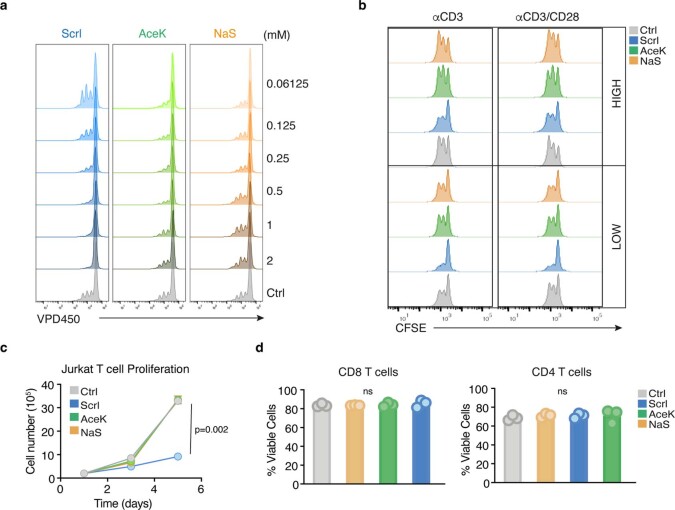
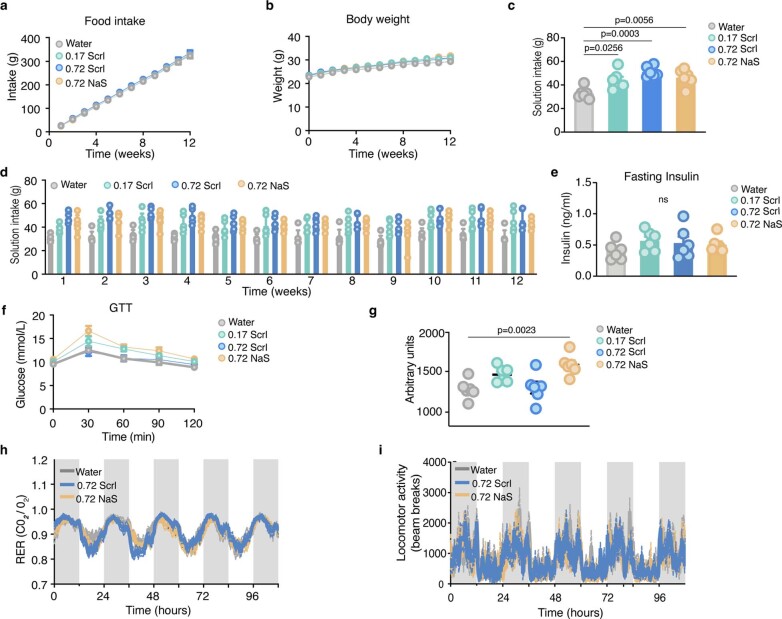
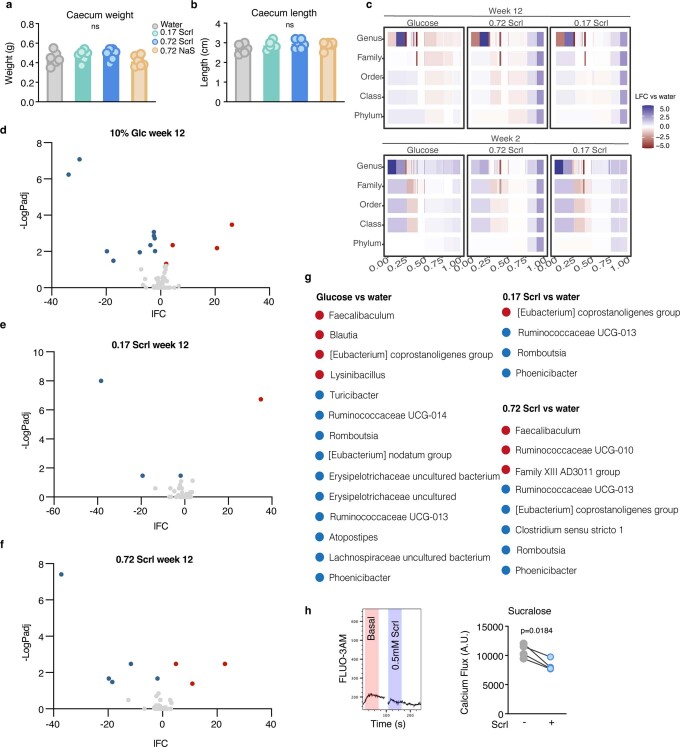
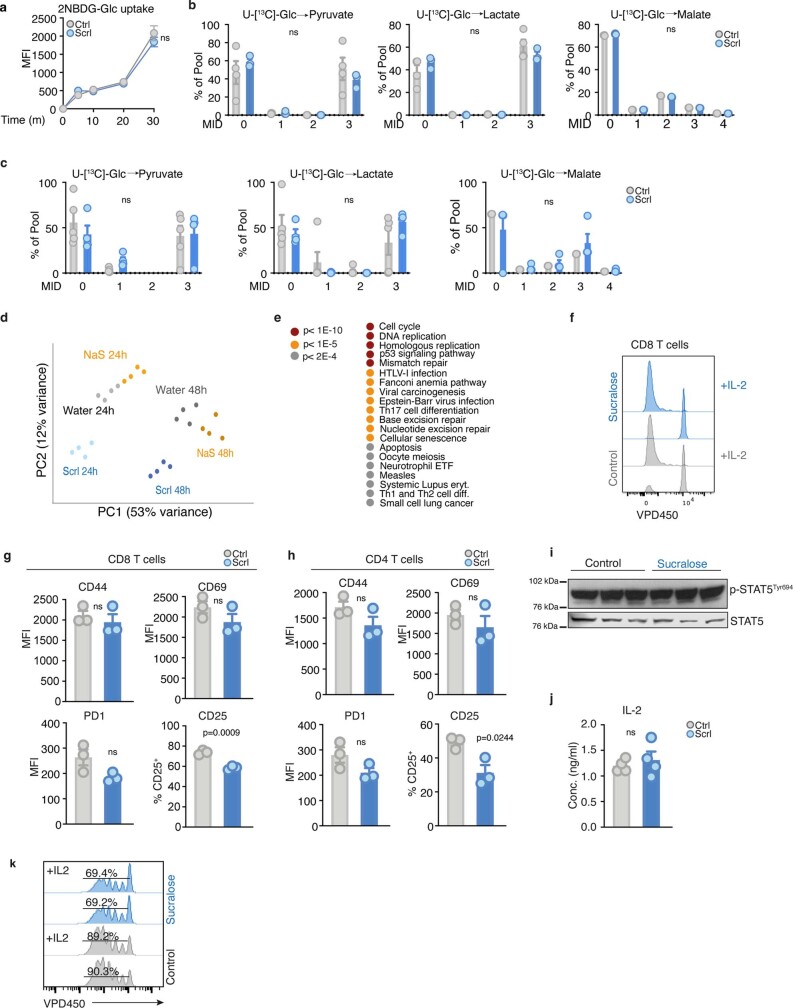
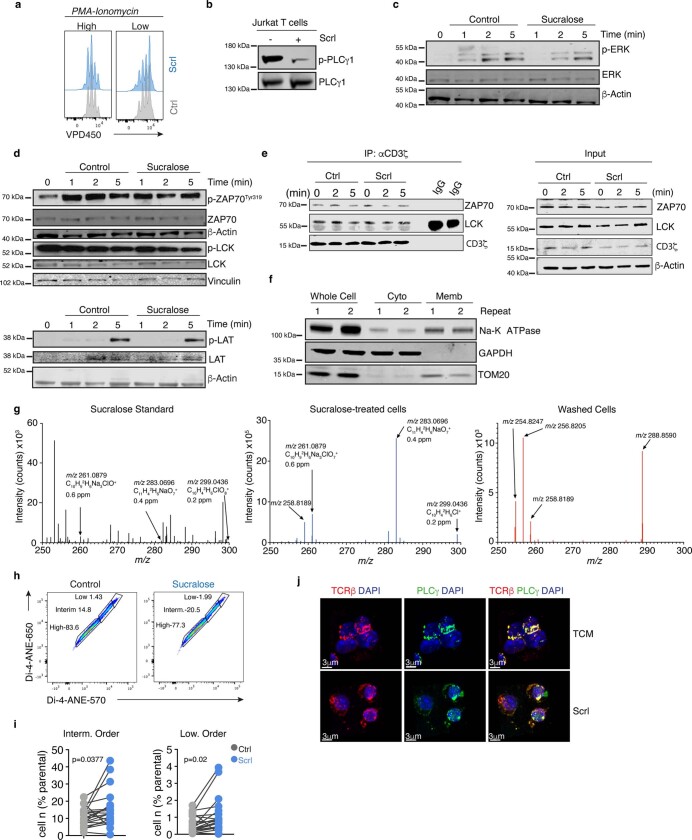
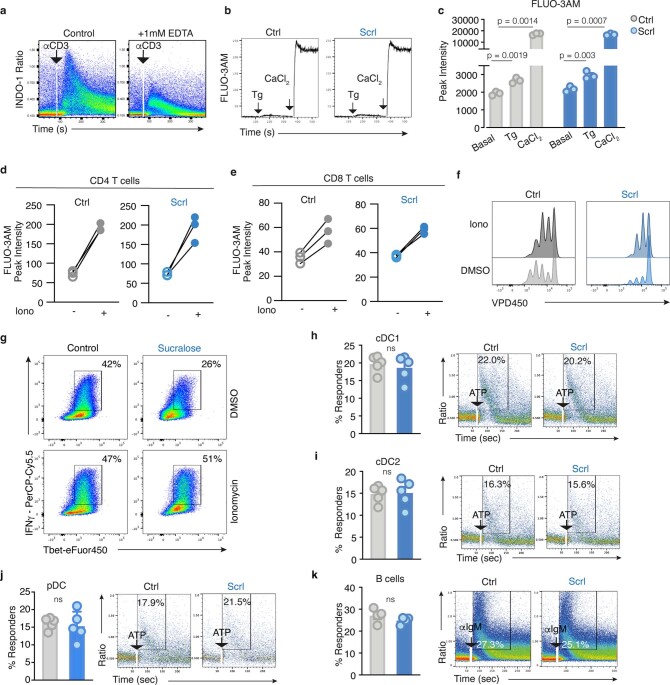
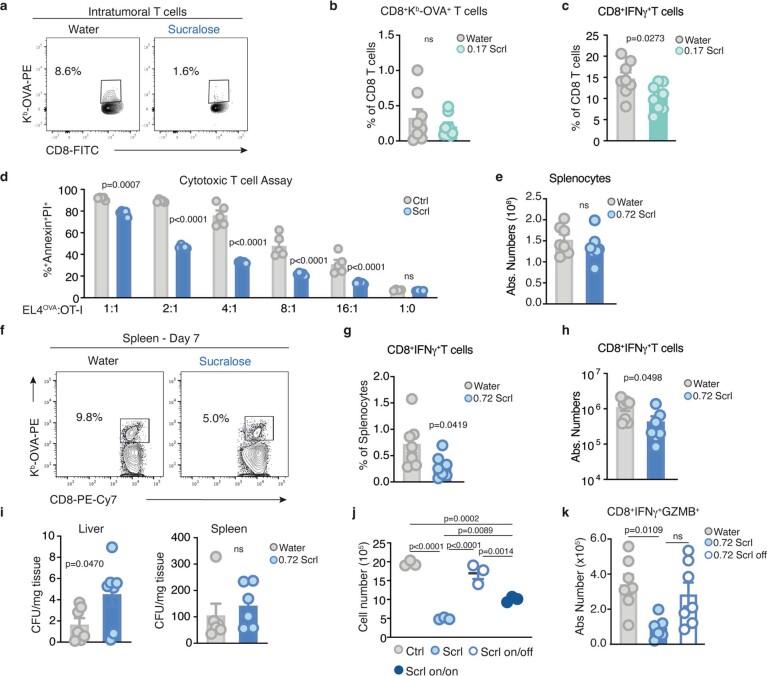
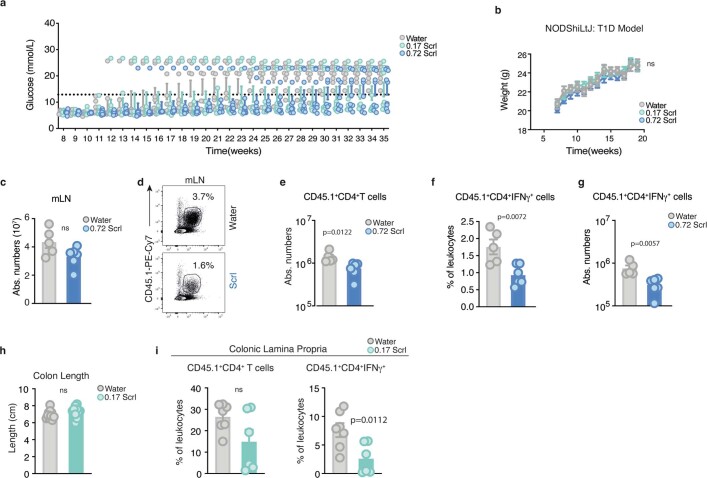
Artificial sweeteners are used as calorie-free sugar substitutes in many food products and their consumption has increased substantially over the past years1. Although generally regarded as safe, some concerns have been raised about the long-term safety of the consumption of certain sweeteners2-5. In this study, we show that the intake of high doses of sucralose in mice results in immunomodulatory effects by limiting T cell proliferation and T cell differentiation. Mechanistically, sucralose affects the membrane order of T cells, accompanied by a reduced efficiency of T cell receptor signalling and intracellular calcium mobilization. Mice given sucralose show decreased CD8+ T cell antigen-specific responses in subcutaneous cancer models and bacterial infection models, and reduced T cell function in models of T cell-mediated autoimmunity. Overall, these findings suggest that a high intake of sucralose can dampen T cell-mediated responses, an effect that could be used in therapy to mitigate T cell-dependent autoimmune disorders.


Conflict of interest statement

K.H.V. is on the board of directors and shareholder of Bristol Myers Squibb and on the scientific advisory board (with stock options) of PMV Pharma, RAZE Therapeutics, Volastra Pharmaceuticals and Kovina Therapeutics. She is on the scientific advisory board of Ludwig Cancer and a co-founder and consultant of Faeth Therapeutics. She has been in receipt of research funding from Astex Pharmaceuticals and AstraZeneca and contributed to CRUK Cancer Research Technology filing of patent application WO/2017/144877. J.B. is funded by a fellowship from the Kuok Family, who did not influence any aspects of the research. The other authors declare no competing interests.

Figures

Fig. 1
Fig. 1. Sucralose impairs T cell proliferation and differentiation.
a, Sucralose (Scrl) intake in mice given 0.72 mg ml−1 (blue; n = 6) or 0.17 mg ml−1 (aquamarine; n = 6) Scrl. In box plots, whiskers show the minimum and maximum values, box margins represent the first and third quartile and the central line is the median value. Dashed lines indicate the BSA-adjusted EFSA (black) and FDA (purple) maximum ADI. Scrl concentrations are indicated in mg ml−1 throughout. b, Circulating Scrl levels in mice given water containing different Scrl concentrations for 2 weeks. n = 4 individual mice per condition. c, Schematic of the experimental design. CFSE, carboxyfluorescein succinimidyl ester. d, Homeostatic proliferation of CD8+ and CD4+ donor T cells in individual Rag2−/− recipient mice given plain water (n = 6) or Scrl (n = 5). e, Histograms of CD8+ T cell proliferation in the presence of Scrl, AceK, NaS or control medium (Ctrl). f, Human CD8+ T cell proliferation in the presence of Scrl, AceK, NaS or control medium. g, Paired comparison of the percentage of proliferated CD8+ T cells in f. n = 3 independent donors. h, Representative flow cytometry plot of in vitro polarized CD4+ TH1 cells expressing IFNγ and TBET (also known as TBX21). i, The percentage of TH1 cells in h. n = 3 technical replicates per condition. j, Representative flow cytometry plot of CD8+ T cells expressing CD8 and IFNγ. k, Quantification of CD8+IFNγ+ cells in j. n = 3 (Ctrl) or n = 4 (Scrl, AceK and NaS) technical replicates per condition. l,m, Mice were given plain water (n = 9) or 0.72 mg ml−1 of either Scrl (n = 12) or NaS (n = 11). l, Body composition (lean versus fat mass). m, Average energy expenditure measured continuously during night (grey area) and day (white area). n, Multidimensional scaling of the faecal gut microbiome from mice given water (n = 5), 0.72 mg ml−1 Scrl (n = 5), 0.17 mg ml−1 Scrl (n = 5) or 10% (w/v) glucose (n = 5) for 2 (left) or 12 (right) weeks. Data are mean ± s.d. (b,i,k) or mean ± s.e.m. (d,l,m). Significance was tested using unpaired (d) or paired (g) two-tailed Student’s t-test; one-way ANOVA with Tukey’s (i,k) or Dunnet’s multiple comparison test for lean and fat mass independently (l) or two-way ANOVA (m). Data are representative of two (d) or three (e,hk) independent experiments. Source data
Fig. 2
Fig. 2. Sucralose decreases intracellular calcium flux downstream of the TCR.
a, Schematic of the TCR signalling cascade. ER, endoplasmic reticulum. b, Western blot of phosphorylated and total PLCγ1 in anti-CD3-stimulated T cell lysates. c, Liquid chromatography–mass spectrometry (LC–MS) quantification of Scrl in whole-cell lysate, cytosolic fraction and membrane fraction of Jurkat T cells exposed to 0.5 mM Scrl. Whole-cell lysate of Jurkat T cells grown in T cell medium with (WC Scrl) or without (WC TCM) 0.5 mM Scrl are shown as controls. n = 4 independent preparations. d, Cryogenic OrbiSIMS analysis of Scrl-treated mouse T cells shows the intensity–depth profile above background (grey shaded area) for Scrl [CClNa2O]+ and lipid cell marker [C16H1105]+ fragments. Inset, ion intensity map for the [C2HO]+ cell marker (m/z = 40.99), illustrating the 8 cells quantified (circled). TIC, total ion count. e, The percentage of CD4+ T cells with intermediate (left) and low (right) membrane order activated in the presence or absence of Scrl. n = 17 biological replicates. f, Representative 3D reconstruction (z-stacks) from naive T cells cultured with or without Scrl and activated with anti-CD3. Scale bars, 2 µm. g, Average volume of PLCγ1 clusters. n = 3 average volumes of at least 3 cells per image in separate fields. h, Representative flow cytometry plot for calcium flux using INDO1 in T cells activated with anti-CD3 and streptavidin. i, The percentage of T cells undergoing calcium flux. j, Representative flow cytometry plot for intracellular calcium flux with INDO1 in the presence of 1 mM EDTA. k, The percentage of T cells undergoing intracellular calcium flux. n = 3 technical replicates per condition. l,m, T cells were activated with anti-CD3/CD28 in the presence of DMSO or ionomycin (Iono) (125 ng ml−1) with or without 0.5 mM Scrl. l, The percentage of proliferating T cells. n = 3 technical replicates/condition. m, Intracellular cytokine staining for IFNγ and TBET. n = 5 technical replicates per condition. Data are mean ± s.e.m. (d) or mean ± s.d. (c,g,i,k,l,m). Significance was tested using unpaired (g,i,k,l) or paired (e) two-tailed Student’s t-test; one-way ANOVA with Tukey’s multiple comparison test (m). Data are representative of two (f,g) or three (b,hm) independent experiments. Source data
Fig. 3
Fig. 3. Sucralose treatment limits T cell-specific responses in vivo.
ac, CD8 antigen-specific responses to subcutaneous EL4-OVA tumour growth in mice given water (n = 8) or 0.72 mg ml−1 Scrl (n = 7). a, Quantification of intratumoral CD8–MHC tetramer (Kb)–OVA-specific T cells. b, Representative flow cytometry plot of intratumoral cells re-stimulated with OVA peptide and analysed for IFNγ and CD44. c, Percentage OVA-specific T cells expressing IFNγ. d,e, The OT-I tumour-rejection model. Mice given water or 0.72 mg ml−1 Scrl (n = 10 per condition). d, Schematic overview of the model. e, Volumes of EL4-OVA tumours. f,g,h, MHC-mismatched tumour model using KrasG12D pancreatic ductal adenocarcinoma (PDAC) cells in recipient mice given water (n = 9) or 0.72 mg ml−1 Scrl (n = 8). f, Schematic overview of the model. g, Tumour growth in FVB recipient mice. h, Tumour growth in Rag2−/− recipient mice. ik, C57BL/6J mice given water (n = 7) or 0.72 mg ml−1 Scrl (n = 7) challenged with LmOVA. i, The percentage of splenic OVA-specific CD8+ T cells. j, Representative flow cytometry plot of splenocytes re-stimulated with OVA peptide and analysed for expression of CD44 and IFNγ. k, The percentage of splenic CD8+ T cells expressing IFNγ. l, Representative proliferation of Jurkat T cells in T cell media (Ctrl) or exposed to acute (Scrl), chronic (Scrl on/on) or transient (Scrl on/off) 0.5 mM Scrl. n = 3 per condition. representative of 3 independent experiments. mp, T cell responses at day 7 after LmOVA infection. Mice given water (n = 7), 0.72 mg ml−1 Scrl (n = 6) or 0.72 mg ml−1 Scrl for 2 weeks followed by water for one week (n = 7, Scrl off). m, Schematic experimental overview. n, Percentage of splenic Kb–OVA-specific CD8+ T cells. o, The frequency of splenic Ki67+CD8+ T cells. p, The frequency of total IFNγ and granzyme B (GZMB) expression in splenic CD8+ T cells after re-stimulation with OVA peptide. Data are mean ± s.e.m. (a,c,e,gi,k,l,np). Each dot represents a biological (a,c,e,gi,k,np) or technical (l) replicate; data are representative of two (e,g,i,k) or three (l) independent experiments. Significance was tested using unpaired two-tailed Student’s t-test (a,c,i,k); Brown–Forsythe and Welch ANOVA test with Dunnett’s T3 comparison (np); two-way ANOVA (e,g,h). NS, not significant. Source data
Fig. 4
Fig. 4. Sucralose treatment dampens T cell-mediated inflammation in models of autoimmunity.
a,b, NOD/ShiLtJ type 1 diabetes model in mice given water (n = 8), 0.72 mg ml−1 Scrl (n = 9) or 0.17 mg ml−1 Scrl (n = 9). a, Schematic of the model. b, Disease-free survival. c, Schematic of the T cell-induced colitis model. df, CD45.2 Tcra−/− recipient mice treated with (n = 6) or without (n = 5) 0.72 mg ml−1 Scrl. d, The percentage of congenic CD45.1+CD4+ donor T cells in the mLN 3 weeks after transplantation. e, Representative flow cytometry plot of lymphocytes from the mLN that were re-stimulated and analysed for the expression of IFNγ and CD4. f, The percentage of CD4+CD45.1+ donor cells in the mLN that express IFNγ. g,h, Analysis of mLNs from recipient CD45.2 Tcra−/− mice given water (n = 8) or 0.17 mg ml−1 Scrl (n = 8). g, The total frequency of CD45.1+CD4+ donor T cells. h, The frequency of CD4+ donor T cells expressing Ki67 and IFNγ. Data are mean ± s.e.m. (d,fh). Each dot (d,fh) represents a biological replicate; data are representative of two (df) or three (g,h) independent experiments. Significance was tested using unpaired two-tailed Student’s t-test (d,fh) and log rank Mantel–Cox test (b) for either dose of Scrl versus water. Source data
Extended Data Fig. 1
Extended Data Fig. 1. Sucralose detection in mice and its effect on macrophage, B cell and T cell responses.
a). Sucralose peak detection by LC-MS in the plasma of mice fed with water or 0.72 mg ml−1 of sucralose for 2 weeks. b) Box plots of frequencies of B220+ B cells, CD8+ T cells, CD4+ T cells, CD4+FOXP3+ T cells (Treg), CD11b+ pan myeloid population, CD11b+NK1.1+ cells (NK cells), CD11c+ dendritic cells (DCs), monocytes (CD11b+Ly6C+) and neutrophils (CD11b+Ly6G+) within mesenteric lymph nodes, peripheral lymph nodes, and the spleen of mice fed with water), 0.17 mgml−1 Scrl, 0.72 mg ml−1 Scrl, and 0.72 mg ml−1 sodium saccharin (NaS) (n = 6 per treatment) for over 12 weeks. As assessed by flow cytometry. Min-max box plot: centre lines show median, box limits are 1st and 3rd quartiles, with whiskers indicating the min and max value. (c-f) C57BL/6J mice fed with water (n = 10) or 0.72 mg ml−1 Scrl (n = 8) and immunized with sheep red blood cells (sRBC). Each dot represents a biological replicate. c) Total splenocyte numbers at day 7 post sRBC immunization. d) Percentage of splenic B220+ B cells 7 days post SRBC immunization. e) Representative density plot of gated B220+ B cells and the frequency of germinal centre (GC) B cells (GL7+CD95+) at day 7 post immunization. f) Quantification of the percentage of GC B cells as depicted in Extended Data Fig. 1e, of the splenic B220+ B cell population (left) and as a percentage of total splenocytes (right). g) Pairwise comparison of pro-IL1β+TNF+ (n = 7/condition), TNF+IL6+ (n = 4/condition) and TNF+IL12p70+ (n = 3/condition) production assessed by flow cytometry in bone marrow derived macrophages (BMDMs) stimulated with lipopolysaccharide (LPS) either in control media or in presence of 0.5 mM of Scrl. Paired dots indicate biologically independent samples. h) IL1β plasma concentration from water (n = 7) or 0.72 mg ml−1 sucralose (n = 7) fed C57BL/6J mice for 2 weeks prior to LPS challenge (0.1 mg kg−1). (i–j) Generation of alternatively activated macrophages (CD11b+F4/80+CD301+CD206+) in C57BL/6J mice intraperitoneally injected with IL4 complex (IL4c) or PBS fed water (or 0.72 mg ml−1 Scrl . Each dot represents a single mouse. N = 5 biological replicates per group. i) Frequencies. j) Absolute numbers. k) Homeostatic proliferation at day 3 of naïve CFSE-loaded CD8+ and CD4+ T cells injected to Rag2−/− recipients fed water (n = 6) or 0.17 mg ml−1 Scrl (n = 5) for two weeks and until the end of the experiment. Means represent ± s.e.m for biological replicates (c, d, f, g, h, i, j, k). Statistical significance was determined using 2-tailed unpaired (c, d, f, h, k) or paired (g) Student’s t test; one-way ANOVA with Tukey’s multiple comparison test (i, j), or ordinary one-way ANOVA for identical immune populations/condition (b). Data are representative of 2 (h–i) or 3 (c–f, k) independent experiments. Source data
Extended Data Fig. 2
Extended Data Fig. 2. Sucralose limits T cell proliferation without affecting viability.
a) CD4+ T cell proliferation assay performed with αCD3 (5 μg ml−1) and αCD28 (1 μg ml−1) for 3 days in the presence of serial dilutions of the indicated sweeteners. b) Proliferation of CFSE stained CD8+ T cells exposed to 0.5 mM of the indicated sweeteners and activated with a high dose of αCD3 (5 μg ml−1) or low dose of αCD3 (1 μg ml−1) in the presence or absence of αCD28 (1 μg ml−1). c) Jurkat T cell proliferation in control media or media supplemented with the indicated sweeteners. N = 3. d) Percentage of viable CD8+ (left) and CD4+ (right) T cells 24 h post activation with αCD3 (2 μg ml−1) and αCD28 (1 μg ml−1). Cell viability was determined by Fixable Viability Dye eFluor780® exclusion. Means represent ± s.e.m. for biological (d) or technical (c) replicates. Statistical significance was determined using one-way ANOVA with Tukey’s (c) or Dunnet’s (d) multiple comparison test. Data are representative of 3 independent experiments (c). Source data
Extended Data Fig. 3
Extended Data Fig. 3. Sucralose does not affect whole body mouse metabolism.
(a–g) Individually caged C57BL/6J mice fed water, 0.17 mg ml−1 Scrl, 0.72 mg ml−1 Scrl) or 0.72 mg ml−1 sodium saccharin (NaS) for 12 weeks. N = 6 per treatment. a) Average cumulative food intake. b) Average body weight. c) Average solution intake. d) Weekly solution intake. e) Fasting plasma insulin levels. (f–g) Glucose tolerance test (GTT) of mice receiving an oral bolus of 2 mg kg−1 glucose. f) Blood glucose. g) Area under the curve calculated using the trapezoid method for the GTT. h–i) C57BL/6J mice fed for over 8 weeks with water (n = 8 for RER and 9 for locomotor activity), 0.72 mg ml−1 Scrl (n = 12) or 0.72 mg ml−1 NaS (n = 11). h) Respiratory Exchange Ratio (RER). i) Locomotor activity. Data are displayed as mean ± s.d. (d) ± s.e.m. (a, b, c, e, f, g, h, i). Each dot represents a single mouse. Statistical significance was determined using one-way Anova with Tukey’s (a, b, c) or Dunnet’s (e, g) multiple comparison test. Source data
Extended Data Fig. 4
Extended Data Fig. 4. Microbiome analysis of mice treated with sweeteners and sucralose effect on calcium flux.
(a–b) C57BL/6J mice fed water, 0.17 mg ml−1 Scrl, 0.72 mg ml−1 Scrl or 0.72 mg ml−1 NaS for 12 weeks. Each dot represents an individual mouse. N = 6 per treatment. a) Caecum weight. b) Caecum length. (c–g) Gut microbiome analysis of mice fed for 2 and 12 weeks with water), 0.17 mg ml−1 Scrl, 0.72 mg ml−1 Scrl or 10% w/v glucose. N = 5 per treatment. c) Heatmaps showing alteration in abundance data in mice exposed to different drinking solutions as indicated compared to time-matched samples obtained from water-fed mice. Top graphs: samples collected after 12 weeks exposure; lower graphs samples collected after 2 weeks exposure. The variation of abundance is shown at Phylum, Class, Order, Family and Genus level. (d–f) Volcano plots of regulated genera in samples collected after 12 weeks of treatment. Water-treated animals were used as control. The fold changes were estimated using a negative binomial model from the DESeq2 package in R using its default settings for accounting for different library sizes between samples. A generalized linear model accounted for batch along with the interaction of treatment and time, to provide estimates of time effects within treatment (and vice versa). P-values were calculated using a Wald test and then adjusted using the Benjamini-Hochberg method to control for false discovery rate. Comparisons: d) 10% glucose vs water, e) 0.17 mg ml−1 Scrl vs water and f) 0.72 mg ml−1 Scrl vs water. Genera with a logarithmic fold change > 0.6 and an adjusted P-value < 0.05 are considered upregulated; Genera with a logarithmic fold change < 0.6 and an adjusted P-value < 0.05 are considered downregulated. g) List of upregulated (red) or downregulated (blue) genera in the different comparison as indicated in (d, e, f). h) Representative kinetics diagram (left) of FLUO-3AM calcium flux in response to 0.5 mM Scrl and corresponding quantification (right) of FLUO-3AM intensity in Jurkat T cells. N = 4 technical replicates. Data are representative of 3 independent experiments. The means represents ± s.e.m. for biological replicates (a, b), one-way ANOVA with Dunnet’s multiple comparison test (a, b), and 2-tailed paired Student’s t test (h) were used for statistical analysis. Source data
Extended Data Fig. 5
Extended Data Fig. 5. Sucralose does not impede glucose metabolism, TCR-independent proliferation, IL2-STAT5 signalling, and activation markers, but reduces membrane order.
a) Flow cytometry analysis of 2NBDG-glucose uptake of T cells activated for 24 h with αCD3 and αCD28 in T cell media (TCM) with (Scrl) or without (Ctrl) 0.5mM sucralose. Graph shows the increase in mean fluorescence intensity (MFI) over time. N = 3 technical replicates except for sucralose at 5 min n = 2. (b–c) CD4+ (b) and CD8+ (c) T cells activated for 48 h in control media or in presence of 0.5 mM Scrl followed by stable isotope tracing analysis of U-[13C]-glucose. Mass isotopomer distribution (MID) of 13C6-glucose-derived carbon into pyruvate, lactate, and malate as indicated. N = 4 (Ctrl), n = 3 (Scrl) for CD4+ T cells, and n = 5 (Ctrl) and n = 4 (Scrl) for CD8+ T cells. Dots represent technical replicates. Values below 104 were considered zero. d) PCA from RNAseq of CD4+ T cells activated with αCD3 and αCD28 for 24 h and 48 h in control medium or medium supplemented with 0.5 mM of either NaS or Scrl. Dots represent technical replicates. e) Top 20 enrichment pathways identified using DAVID. Pathways are ordered by p-values from most significant (top, dark red) to less significant (bottom, grey). f) IL2 (100 ng/ml)-induced proliferation of VPD450-stained CD8+ T cells in the presence or absence of 0.5 mM sucralose for 4 days. (g–h) Expression of the activation markers CD44, CD69, PD1 and CD25 in CD8+ T cells (g) and CD4+ T cells (h) activated for 24 h with αCD3 (2 μg ml−1) and αCD28 (1 μg ml−1) in the presence or absence of 0.5 mM Scrl. n = 3 technical replicates. i) Western blot analysis probing for phospho-STAT5(Tyr694) and STAT5 as a loading control from protein lysates of 24 h-activated T cells in the presence of control media or 0.5 mM Scrl. Each lane is a pool of T cells collected from a single well. j) Concentration of IL2 detected by enzyme linked immunosorbent assay (ELISA) from supernatant of T cells activated for 24 h with αCD3/CD28. Each dot represents a single well of technical replicates (n = 4/condition). k) Cell proliferation histogram overlay of VPD450-loaded T cells activated with αCD3/CD28, with or without 20 μg -ml−1 of IL-2, and either in control medium (grey) or in presence of 0.5 mM Scrl (blue). Data presented with mean value ± s.e.m. (a, b, c, g, h) or ± s.d. (j) Statistical significance was tested using, mixed-effects model (REML) with Sidak’s multiple comparison test (a); 2-way ANOVA (b, c), unpaired (gj) 2-tailed student’s t-test. Data are representative of 3 independent experiments (a, f–k). Source data
Extended Data Fig. 6
Extended Data Fig. 6. Sucralose reduces membrane order.
a) Flow cytometry histogram overlay of T cells loaded with VDP450 and activated with either high concentration of PMA (10 μg ml−1) and ionomycin (500 ng ml−1) (left) or low concentration (1 ng ml−1 PMA and 50 ng ml−1 ionomycin) (right), respectively. b) Western blot analysis of Jurkat T cells cultured with or without 0.5 mM Scrl and probed for p-PLCγ1 and PLCγ1 total. (c–d) Western blot analysis of T cells pre-treated for 2 h with or without 0.5 mM Scrl and activated with αCD3 (5 μg ml−1) for 1, 2, and 5 min. Membranes were probed for (c) p-ERK1/2 and total ERK1/2 expression, using β-Actin as loading control. All proteins detected on the same membrane. (d) Identical protein lysates were probed for p-ZAP70Tyr319, ZAP70, and β-Actin as loading control on one membrane and p-LCK, LCK and vinculin as loading control were probed on a second membrane. Second set of protein lysates were probed for p-LAT, LAT and β-Actin as loading control on the same membrane. e) Immunoprecipitation (IP) of CD3ζ chain from Jurkat T cells cultured media in presence or absence of 0.5 mM Scrl for 2 days. (Left) Cells were stimulated with 5 µg ml−1 αCD3 for 0’, 2’, 5’ min as indicated. (Right) Western blot analysis of protein lysates used for IP showing ZAP70, LCK and CD3ζ expression with β-Actin as loading control. All proteins detected on the same membrane. f) Western blot analysis of protein lysates from whole cell fractions, cytoplasmic fractions and membrane fractions were probed for Na-K ATPase (membrane marker), GAPDH (cytoplasmic marker) and TOM20 (mitochondrial marker). All proteins were detected on the same membrane. g) Cryogenic Argon GCIB Orbitrap mass spectra acquired through the entire depth of cells until substrate signal was detected, showing the presence of fragments of deuterium labelled sucralose (d-Scrl) in a sample containing Jurkat T cells treated with 0.5 mM d-Scrl for 48 h, and subsequent absence of any sucralose-related ions in a sample containing d-Scrl treated cells which were subsequently washed with PBS to remove any traces of d-Scrl in the media. Masses annotated with chemical formulas derive from d-Scrl. Identifications were performed in comparison with a standard of pure d-Scrl. h) Representative flow cytometry plot of membrane orders as detected with the Di-4-ANEPPDHQ dye. Low, intermediate, and high membrane order populations are denoted. i) Paired analysis of Intermediate and Low membrane order of CD8+ T cells activated with αCD3/CD28 for 3 days with or without 0.5 mM Scrl. n = 20 biologically replicates. j) Representative 3D reconstruction (Z-stacks) from naïve T cells pre-treated with or without 0.5 mM Scrl, followed by TCR-crosslinking. Images show colocalization of TCRβ (red), PLCγ1 (green), and nuclei are stained with DAPI. Bar = 3 μm. Statistical significance was tested using, paired (i) 2-tailed student’s t-test. Data represent one of 3 independent experiments (a–f, h–j). Source data
Extended Data Fig. 7
Extended Data Fig. 7. Sucralose selectively reduces TCR-induced intracellular calcium flux.
a) Representative intracellular calcium flux in naïve CD4+ T cells activated with αCD3-biotin crosslinked by streptavidin with or without 1 mM EDTA. Intracellular calcium flux is plotted as INDO1 ratio over time. b) Representative kinetic plot measuring calcium flux with FLUO-3AM using thapsigargin 1 μM (Tg) (first arrow) followed by 2 mM calcium chloride (CaCl2) (second arrow) in the presence or absence of 0.5 mM Scrl. The line represents mean values with gaussian smoothing. c) FLUO-3AM peak intensities upon Tg and CaCl2 treatments in CD4+ T cells in media lacking calcium salt. N = 3 biological replicates per condition. The statistical significance of Tg and CaCl2 vs Basal was tested using a paired 2-tailed Student’s t test with p values as reported in the figure. 2-way anova with Sidak’s multiple comparison test was used to test the effect of sucralose on the 3 conditions (Basal, Tg, and CaCl2). No significant effect was discovered. (d–e) Pairwise comparison of changes in FLUO-3AM peak intensity with ionomycin treatment in CD4+ (d) and CD8+ (e). N = 3 biological replicates per condition. T cells were tested in calcium-free media with or without 0.5 mM Scrl (blue). Each dot represents a biological replicate. f) Representative histogram plot of VPD450 dilution of total T cells activated with αCD3 (2 μg ml−1) and αCD28 (1 μg ml−1) in the presence of DMSO or 125 ng ml−1 of ionomycin with or without 0.5 mM Scrl. g) Representative flow cytometry plot of T cells activated with αCD3 (2 μg ml−1) and αCD28 (1 μg ml−1) in the presence of DMSO or 125 ng ml−1 of ionomycin with or without 0.5 mM Scrl and restimulated for ICS. Cytokine production is identified as Tbet+IFNγ+ populations. (h–j) FLT3-ligand generated conventional DC1 (n = 3/condition, technical replicates) (h), cDC2 (n = 3/condition, technical replicates) (i) and plasmacytoid DCs (n = 3/condition, technical replicates) ( j) differentiated in the presence or absence of 0.5 mM Scrl. Graphs on the left show the percentage of cells undergoing calcium flux in response to 1mM ATP. The representative flow cytometry plots (right) show the INDO1 ratio over time in response to ATP. k) Isolated naïve B cells stained with INDO1 and activated with αIgM (20 μg ml−1) in presence or absence of 0.5 mM Scrl. Graph (left) represents the percentage of calcium responding cells downstream of αIgM stimulation and on the right is a flow cytometry representative plot. N = 5 technical replicates per condition. Data present as mean value ±s.d. (c) or ±s.e.m. (h–k). Data representative of 3 independent experiments (h–k). Statistical significance was tested using paired (c–e) or unpaired 2-tailed Student’s t test (h–k). Source data
Extended Data Fig. 8
Extended Data Fig. 8. Sucralose treatment in mice reduces antigen-specifc CD8+ T cell responses.
a) Representative density plot of intratumoral CD8+ T cells recognizing the MHC-peptide tetramer complex (Kb-OVA) from EL4OVA tumours from mice fed water or 0.72 μg ml−1 Scrl 10 days post challenge. (b, c) Mice fed water or 0.17 μg ml−1 Scrl . N = 8 biological replicates per group and each dot represents an individual mouse b) Intratumoral frequency of CD8+ T cells recognizing the MHC-peptide tetramer complex (Kb-OVA) from EL4OVA tumours. c) Intratumoral frequency of CD8+IFNγ+ T cells from tumour bearing mice post re-stimulation with the OVA peptide. d) Cytotoxic T cell assay of OT-I T cells activated with OVA-peptide either in TCM with (Scrl) or without (Ctrl) 0.5 mM Scrl followed by co-culture with EL4OVA cancer cells. N = 5 for technical replicates. (e–h) Splenocytes from C57BL/6J mice fed water or 0.72 mg ml−1 Scrl followed by bacterial challenge with LmOVA (105 CFU permouse). N = 7 biological replicates per group. e) Total splenocyte numbers 7 days post infection. f) Representative density plot of OVA-specific CD8+ T cells identified by Kb-OVA and CD8+ surface staining. g) Frequency of CD8+ T cells re-stimulated with OVA-peptide and analyzed for IFNγ expression. h) Absolute numbers of splenic CD8+ T cells in Extended Data Fig. 8g. i) The bacterial load (colony forming units per mg of tissue) of the liver (left) and spleen (right) at day 3 post LmOVA (105 CFU per mouse) infection of mice fed water or 0.72 mg ml−1 Scrl; n = 6 (spleen) or 7 (liver) of biological replicates per group. j) Absolute cell number of Jurkat T cells grown in media with or without Scrl as indicated at day 5. N = 3 technical replicates. k) Absolute splenic numbers of CD8+ T cells producing IFNγ and Granzyme B (GZMB) in response to OVA-peptide re-stimulation of mice infected with LmOVA (105 CFU per mouse) 7 days post infection. Mice were fed water (n = 7), 0.72 mg ml−1 Scrl for 2 weeks (n = 6) or 0.72 mg ml−1 Scrl treatment for 2 weeks followed by one-week water washout (n = 7, Scrl off). Data presented as mean value ± s.e.m. (b-e, g-k). Each dot represents a sample derived from an individual mouse (b, c, e, g, h, i, k). Statistical significance was tested using single or multiple unpaired 2-tailed Student’s t test (b-e, g-i) or a One-way ANOVA with a Tukey’s Multiple Comparison ( j, k). Data representative of 2 (d, e, i, k) or 3 ( j) independent experiments. Source data
Extended Data Fig. 9
Extended Data Fig. 9. Sucralose delays the onset of T1D and reduces inflammatory T cells in a T-cell induced colitis model in mice.
a-b). NOD/ShiLtJ mice fed with either water (n = 8), 0.17 or 0.72 mg ml−1 Scrl (n = 9 for each dose) . a) Weekly blood glucose measurements. b) Weekly weight measurements. (c–g) T cell-induced colitis model of CD4+CD45RB+CD45.1+ congenic T cells transferred into CD45.2 TCRα−/− recipients that were fed either water (n = 5) or 0.72 mg ml−1 Scrl (n = 5). Inflammation was assessed at 21 days post T cell transfer. c) Total numbers of mesenteric lymph node (mLN) leukocytes. d) Representative density plot of the percentage of CD4+ CD45.1+ donor cells in the mLN of TCRα−/− recipients. e) Total numbers of donor congenic donor T cells in the mLN. f) Percentage of congenic CD4+ T cells producing IFNγ+ in the mLN. g) The absolute number of congenic CD4+IFNγ+ T cells within the mLN. (h–i) T-cell induced colitis model of CD45.1 congenic naive T cells adoptively transferred into CD45.2 TCRα−/− recipients that were fed either water or 0.17 mg ml−1 sucralose. h) Colon length at 21 days post transfer (n = 8/group). i) Frequency of CD45.1 CD4+ donor T cells producing IFNγ in the colonic lamina propria at 21 days post transfer. Water (n = 7) versus 0.17  mg ml−1 sucralose (n = 6). Data presented as mean value ±s.e.m. (a–c, e–i). Each dot represents an individual mouse (a, c, e–i). Statistical significance was tested using unpaired 2-tailed Student’s t test (c, e–i) and mixed-effects model (REML) (b). Data are representative of 2 (c, e–g) or 3 (i, h) individual experiments. Source data

Comment in

References

    1. Sylvetsky AC, Rother KI. Trends in the consumption of low-calorie sweeteners. Physiol. Behav. 2016;164:446–450. doi: 10.1016/j.physbeh.2016.03.030. - DOI - PMC - PubMed
    1. Bian X, et al. Gut microbiome response to sucralose and its potential role in inducing liver inflammation in mice. Front. Physiol. 2017;8:487. doi: 10.3389/fphys.2017.00487. - DOI - PMC - PubMed
    1. Harrington EO, Vang A, Braza J, Shil A, Chichger H. Activation of the sweet taste receptor, T1R3, by the artificial sweetener sucralose regulates the pulmonary endothelium. Am. J. Physiol. Lung Cell. Mol. Physiol. 2018;314:L165–L176. doi: 10.1152/ajplung.00490.2016. - DOI - PMC - PubMed
    1. Rodriguez-Palacios A, et al. The artificial sweetener splenda promotes gut proteobacteria, dysbiosis, and myeloperoxidase reactivity in Crohn’s disease-like ileitis. Inflamm. Bowel Dis. 2018;24:1005–1020. doi: 10.1093/ibd/izy060. - DOI - PMC - PubMed
    1. Debras C, et al. Artificial sweeteners and cancer risk: Results from the NutriNet-Sante population-based cohort study. PLoS Med. 2022;19:e1003950. doi: 10.1371/journal.pmed.1003950. - DOI - PMC - PubMed

Publication types

MeSH terms