. 2023 May;10(14):e2205862.
doi: 10.1002/advs.202205862. Epub 2023 Mar 15.

AQP4 Aggravates Cognitive Impairment in Sepsis-Associated Encephalopathy through Inhibiting Nav 1.6-Mediated Astrocyte Autophagy

Affiliations

AQP4 Aggravates Cognitive Impairment in Sepsis-Associated Encephalopathy through Inhibiting Nav 1.6-Mediated Astrocyte Autophagy

Dan-Dan Zhu et al. Adv Sci (Weinh). 2023 May.

Erratum in

Abstract

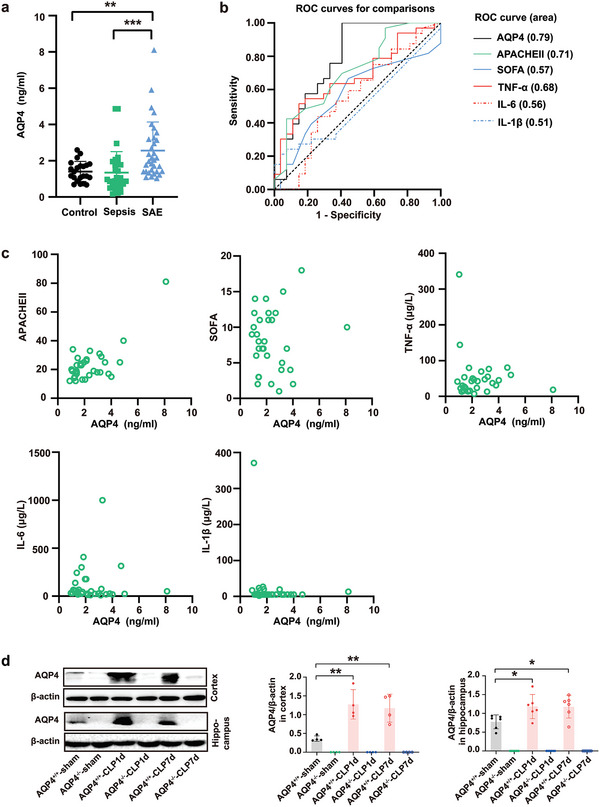
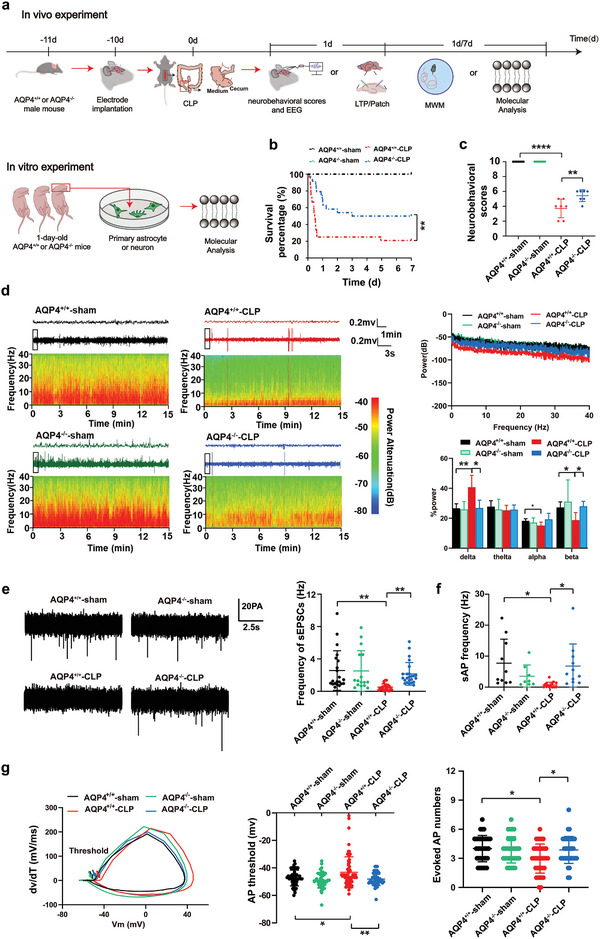
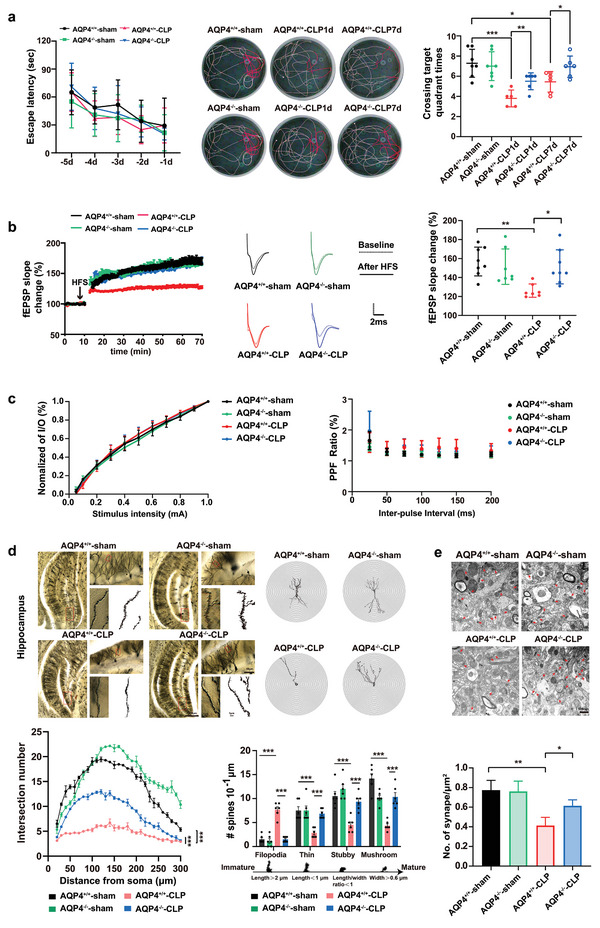
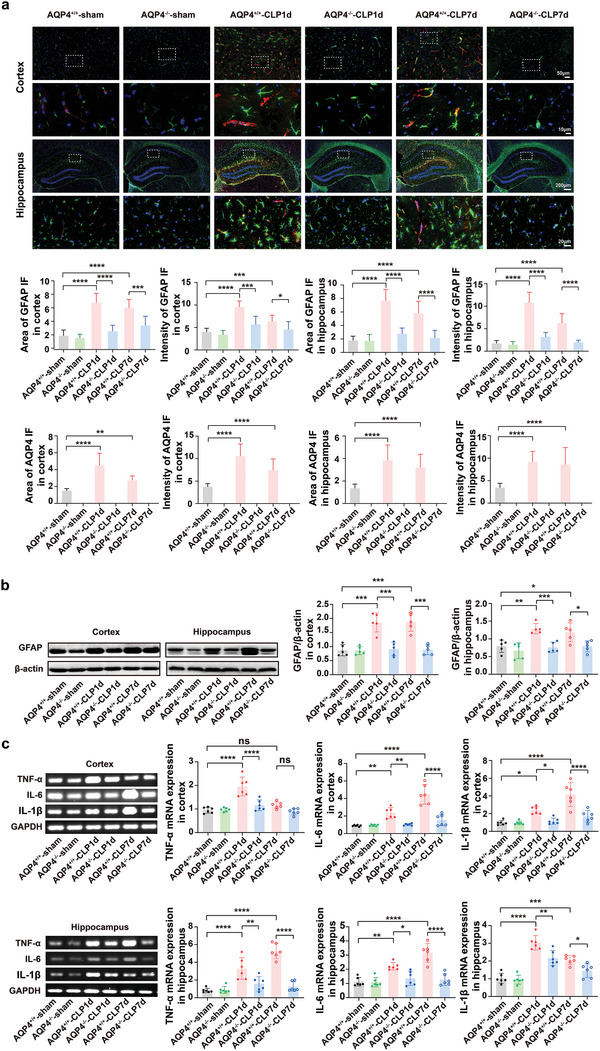
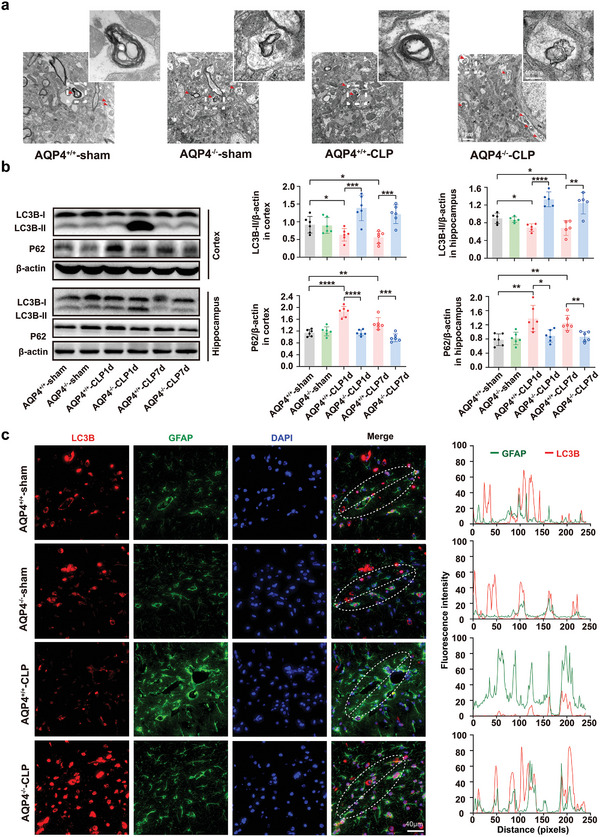
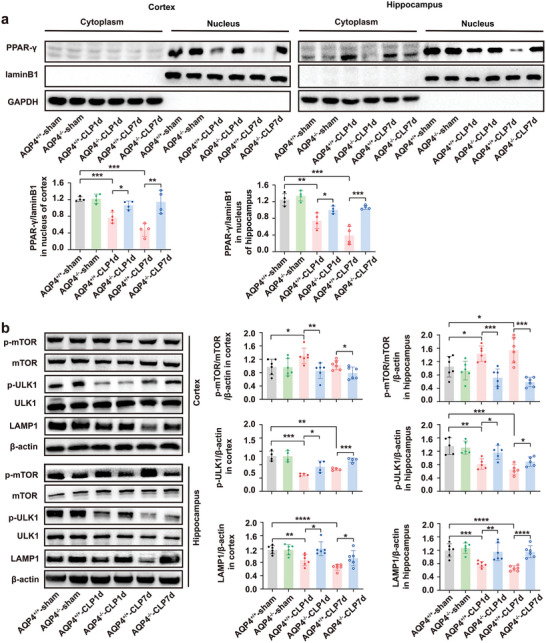
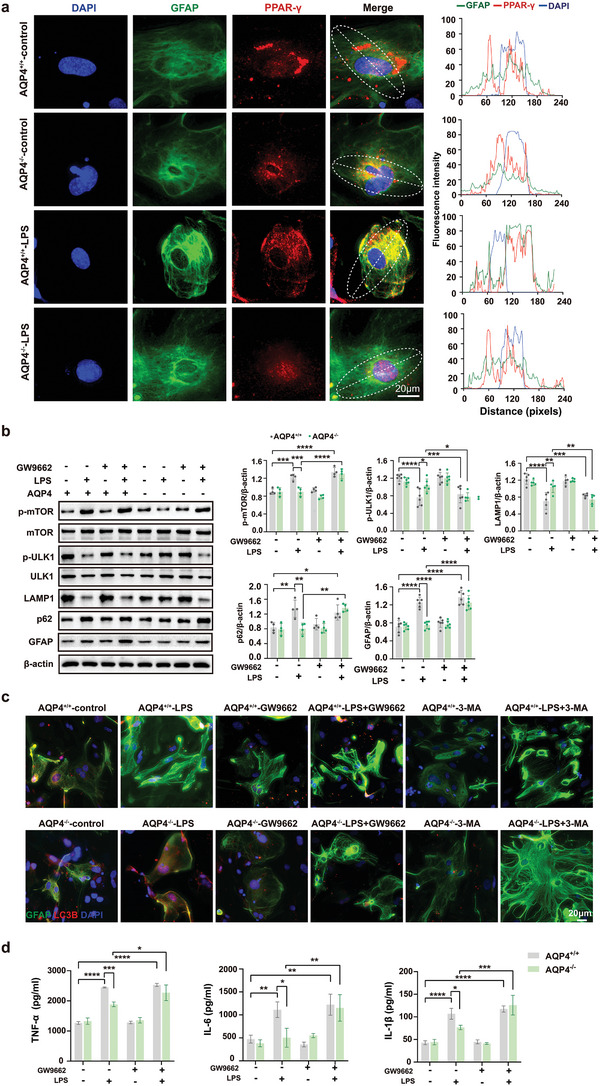
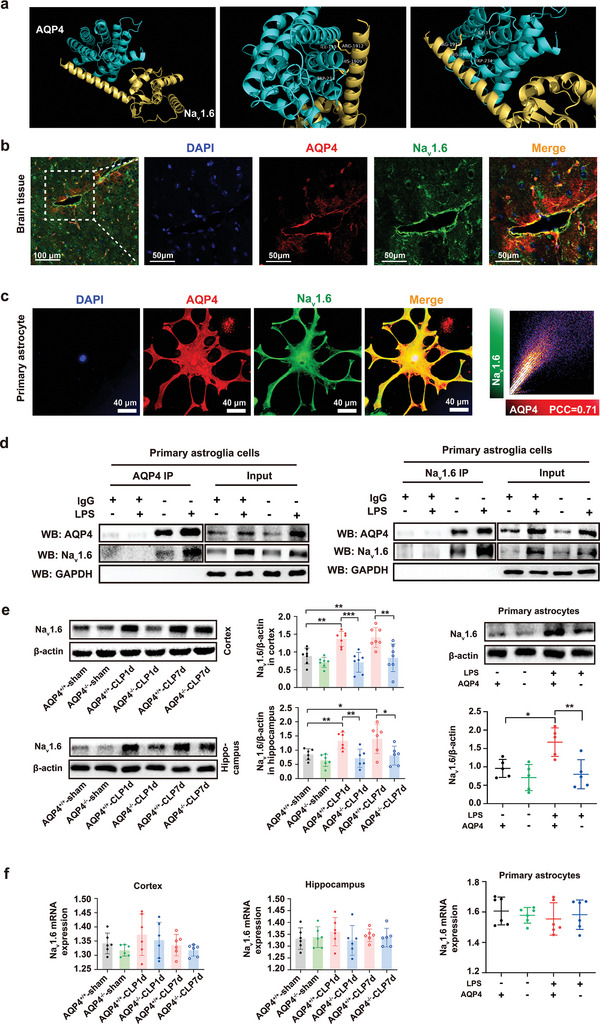
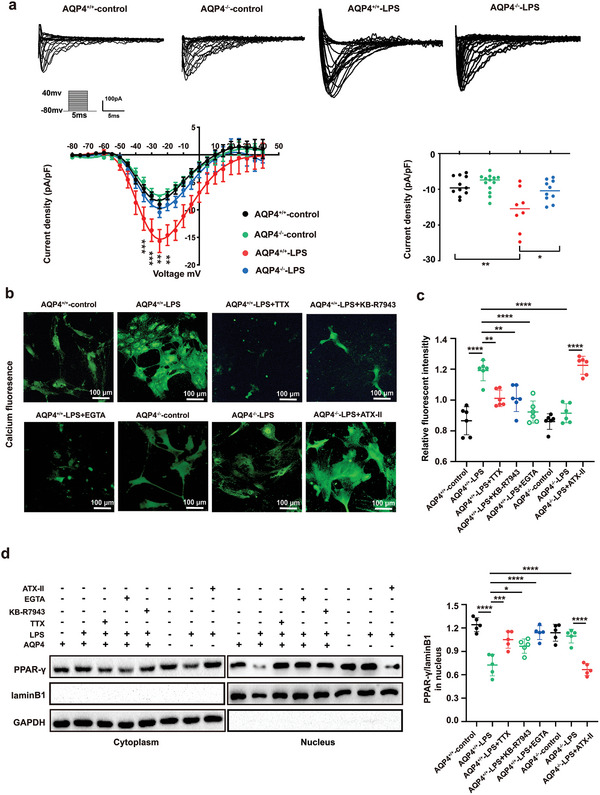
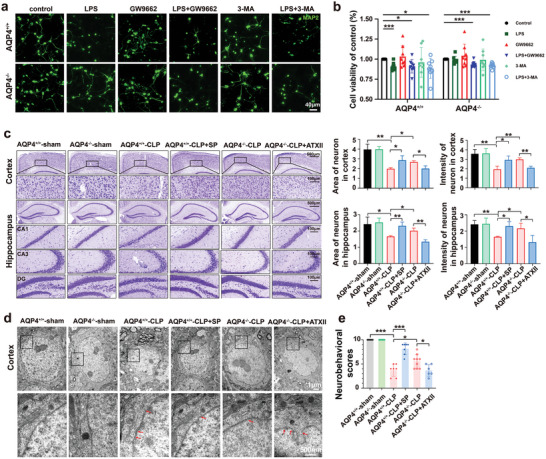
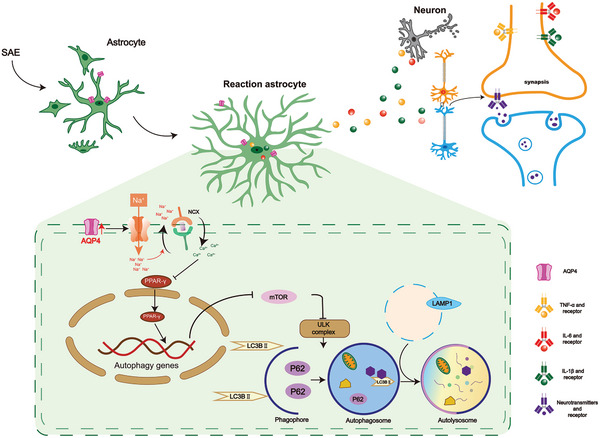
The pathology of sepsis-associated encephalopathy (SAE) is related to astrocyte-inflammation associated with aquaporin-4 (AQP4). The aim here is to investigate the effects of AQP4 associated with SAE and reveal its underlying mechanism causing cognitive impairment. The in vivo experimental results reveal that AQP4 in peripheral blood of patients with SAE is up-regulated, also the cortical and hippocampal tissue of cecal ligation and perforation (CLP) mouse brain has significant rise in AQP4. Furthermore, the data suggest that AQP4 deletion could attenuate learning and memory impairment, attributing to activation of astrocytic autophagy, inactivation of astrocyte and downregulate the expression of proinflammatory cytokines induced by CLP or lipopolysaccharide (LPS). Furthermore, the activation effect of AQP4 knockout on CLP or LPS-induced PPAR-γ inhibiting in astrocyte is related to intracellular Ca2+ level and sodium channel activity. Learning and memory impairment in SAE mouse model are attenuated by AQP4 knockout through activating autophagy, inhibiting neuroinflammation leading to neuroprotection via down-regulation of Nav 1.6 channels in the astrocytes. This results in the reduction of Ca2+ accumulation in the cell cytosol furthermore activating the inhibition of PPAR-γ signal transduction pathway in astrocytes.

Keywords: AQP4; astrocyte; autophagy; neuroinflammation; sepsis-associated encephalopathy; sodium channel Nav1.6.


Conflict of interest statement

The authors declare no conflict of interest.

Figures

Figure 1
Figure 1
AQP4 expression was elevated in peripheral blood of patients and mice brain with sepsis associated encephalopathy. a) The change of AQP4 levels in peripheral blood of healthy patients, sepsis patients, and SAE patients was detected by ELSA. Healthy controls (n = 20) and sepsis patients without encephalopathy (n = 27), sepsis related encephalopathy (n = 33). Data are presented as the mean ± SD. **p < 0.01, ***p < 0.001, one‐way ANOVA with Tukey's post hoc test. b) The area under ROC curve of SOFA score, APACHE II score, peripheral blood AQP4, and TNF‐α, IL‐6, and IL‐1β of SAE patients. AQP4 has the largest area under the curve. c) Pearson correlation analysis between AQP4 and SOFA score, APACHE II score, TNF‐α, IL‐6, IL‐1β in patients with sepsis associated encephalopathy. d) Representative Western blot bands of AQP4 expression levels in cortex and hippocampus of mice. n = 4–6 mice for each group. Data are presented as mean ± SD. * p < 0.05; ** p < 0.01; *** p < 0.001; One‐way ANOVA with Tukey's post hoc test.
Figure 2
Figure 2
AQP4 deletion improved survival rate and ameliorated sepsis‐induced neurologic injury in brain of CLP‐induced sepsis in mice. a) The program of septic model preparation and arrangement of EEG and neurological score in the present study. b) The survival curve analysis is of the survival rates representing each group mice after modeling. n = 24 mice for each group. c) The neurobehavioral score which reflects the neurological injury of mice. n = 7 mice for each group. d) Relative EEG analysis of different groups of mice included EEG spectrum (left), EEG average power spectrum (upper right), average power percentage of α, β, δ, θ waves (lower right), n = 4–6 mice per group. e) Spontaneous EPSCs were recorded. The representative sEPSC traces and quantification of sEPSC frequency are shown in (e). Neurons from 6 mice per group. f) Spontaneous action potential was recorded and quantification of sAP frequency is shown in (f). Neurons from 6 mice. g) The 1st derivative of the somatic membrane voltage (dV/dt) versus membrane voltage (V m) in phase plot. The arrow points to the action potential voltage threshold (left). Quantification of evoked AP thresholds (middle) and quantification of evoked AP numbers (right). Neurons from 6 mice. b) Log‐rank (Mantel‐Cox) test was used. c–g) Data are presented as mean ± SD. * p < 0.05, **p < 0.01, ****p < 0.0001; two‐way ANOVA with Tukey's post hoc test.
Figure 3
Figure 3
AQP4 knock out ameliorated cognitive dysfunction and improves synaptic plasticity of CLP‐induced sepsis in mice. a) Mice were subjected to the Morris water maze test. Left, the mean escape latency; middle, tracings of the typical swim patterns; right, crossing target quadrant times by the mice. n = 5–7 mice for each group. b) Left, the effects of HFS on the fEPSP initial slope (HFS, high frequency stimulation. n = 7–8 mice per group). Middle, representative fEPSP traces for data shown. Right, Cumulative data showing the mean fEPSP slope 60 min post‐HFS. n = 7–8 mice per group. c) Left, cumulative data showing the normalized I/O. Right, cumulative data showing the PPF ratio. n = 5 mice per group, 4–5 slices per animal. d) Upper panel, representative dendritic spines in hippocampus of four groups (scale bar, 500 µm, 50 µm, 1 µm); lower left panel, AQP4 knockout in septic mice increases apical node and spines in hippocampus, while AQP4+/+‐CLP shows no such change (at least 10 neurons from six mice per group were analyzed by the Sholl); lower right panel, statistical analysis showed the effect of AQP4 knockout in septic mice on dendritic spines. e) Upper panel, representative transmission electron micrographs of synapses in cortex (red arrows: synapses; scale bar, 500 nm); lower panel, statistical analysis of the densities of synapses. Data are presented as mean ± SD. Data in a (Left) was analyzed by repeated‐measures ANOVA with Tukey's post hoc test. a) (Right) One‐way ANOVA with Tukey's post hoc test. b–e) Two‐way ANOVA with Tukey's post hoc test. * p < 0.05, ** p < 0.01, *** p < 0.001, *** p < 0.0001.
Figure 4
Figure 4
AQP4 knockout diminished astrocyte activation and mitigated the inflammatory cytokine response in septic mice. a) Immunofluorescence of GFAP+(green) astrocytes and AQP4 (red) in cortex and hippocampus of mice brain slice(upper), different magnification scale bar respectively: 50 µm; 10 µm; 200 µm; 20 µm. Middle and lower panel, quantification of area and intensity of GFAP and AQP4 in the mice cortex and hippocampus among different groups. n = 9 mice for each group. b) Representative Western blot bands of the GFAP expression levels in cortex and hippocampus of mice (left); right panel, quantification of GFAP/β‐actin in the mice cortex and hippocampus among different groups. n = 5 mice for each group. c) Representative RT‐PCR bands of the TNF‐α, IL‐6, IL‐1β mRNA expression levels in cortex of mice (upper left); upper right, quantification of TNF‐α, IL‐6, IL‐1β in the mice cortex was done and normalized to the mRNA level of GAPDH among different groups. Representative RT‐PCR bands of the TNF‐α, IL‐6, IL‐1β mRNA expression levels in hippocampus of mice (lower left); lower right, quantification of TNF‐α, IL‐6, IL‐1β was done and normalized to the mRNA level of GAPDH in the mice hippocampus among different groups. n = 6 mice for each group. Data are presented as mean ± SD. * p < 0.05, ** p < 0.01, *** p < 0.001, **** p < 0.0001; one‐way ANOVA with Tukey's post hoc test.
Figure 5
Figure 5
AQP4 knockout restored autophagy in septic mice brain. a) Representative transmission electron micrographs of the hippocampus (Scale bar, 200 µm) of full image (Scale bar, 1 µm). Red arrows indicate autophagosome. b) Representative Western blot bands of the LC3B‐II, LC3B‐I, and p62 expression levels in cortex and hippocampus of mice(left); right panel, quantification of LC3B‐II/β‐actin and p62/β‐actin in the mice cortex and hippocampus among different groups. n = 5–6 mice for each group. Data are presented as mean ± SD. * p < 0.05, ** p < 0.01, *** p < 0.001, **** p < 0.0001; one‐way ANOVA with Tukey's post hoc test. c) Brain slice of each group mice were immunostained with LC3B (red) and GFAP (green) (complete co‐localization) in the hippocampal CA1 region (left), scale bar, 40 µm; right panel, quantitative analysis of intensity of LC3B puncta and GFAP immunofluorescence.
Figure 6
Figure 6
AQP4 knockout activated the PPAR‐γ/mTOR signaling pathway in septic mice. a) Representative of Western blot probing for the PPAR‐γ entry into the nucleus in the cortex and hippocampus of each group mice (upper panel) and quantitative analysis of PPAR‐γ expression levels in the nucleus (lower paned). n = 4 mice for each group. b. Representative Western blot band for the p‐mTOR, mTOR, p‐ULK1, ULK1, LAMP1, β‐actin (left) and quantitative analysis of those protein levels (right). n = 4–6 mice for each group. Data are presented as mean ± SD. *p < 0.05, ** p < 0.01, *** p < 0.001, **** p < 0.0001; one‐way ANOVA with Tukey's post hoc test.
Figure 7
Figure 7
AQP4 deletion activates PPAR‐γ/mTOR‑dependent autophagy and inhibits inflammation response in primary cultured astrocytes treated with LPS. a) Primary astrocytes were immunostained with GFAP (green), DAPI (blue), PPAR‐γ (red) simultaneously, scale bar, 20 µm (left); right panel, quantitative analysis of GFAP and DAPI, PPAR‐γ immunofluorescence intensity. b) The protein levels of p‐mTOR, p‐ULK1, LAMP1, p62, GFAP were determined by Western blot in AQP4+/+ and AQP4−/− astrocytes treated with LPS (left) and quantitative analysis of those protein levels, n = 4–6 for each group (right). c) Primary astrocytes were immunostained with GFAP (green), DAPI (blue), LC3B (red) simultaneously and the AQP4+/+ and AQP4−/− astrocytes treated with LPS, GW9662 or 3‐MA, scale bar, 20 µm. d) The inflammatory cytokines expression levels of TNF‐α, IL‐6, IL‐1β were determined in astrocyte culture media by ELSA in AQP4+/+ and AQP4−/− astrocytes treated with LPS or GW9662. n = 3 for each group. b,d) Data are presented as mean ± SD. * p < 0.05, ** p < 0.01, *** p < 0.001, **** p < 0.0001; one‐way ANOVA with Tukey's post hoc test.
Figure 8
Figure 8
The interaction between AQP4 and Nav1.6 in astrocytes. a) AQP4 was docked into the binding site of the Nav1.6. surface mode. The AQP4 was represented with green lines; Nav1.6 was represented with yellow lines; the hydrogen bond was shown in dotted yellow line. b) Immunofluorescence for colocalization of AQP4 (red) and Nav1.6 (green) in brain slice, scale bar, 100 µm, 50 µm. c) Left, immunofluorescence for colocalization of AQP4 (red) and Nav1.6 (green) in primary astrocytes, scale bar, 40 µm. Right, scatterplot of AQP4 (red) and Nav1.6 (green) pixel intensities of the astrocyte. d) AQP4 coimmunoprecipitates (IP) with Nav1.6. The AQP4+/+ and AQP4−/− primary astrocytes treated with LPS. Total proteins were extracted and immunoprecipitated with anti‐AQP4 antibody beads (left). And total proteins were extracted and immunoprecipitated with anti‐Nav1.6 antibody beads (right). Immunoprecipitates and total protein extracts (input) were immunoblotted with appropriate antibodies as described in the figure. The input represents the total protein extract used in IP. IP, immunoprecipitation; IgG, negative control. e) Left, representative Western blot band for the Nav1.6 in cortex and hippocampus of each group of mice and quantitative analysis of those protein levels, n = 6–7 mice for each group. Right, the Western blot band for the Nav1.6 (upper right) in AQP4+/+ and AQP4−/− primary astrocytes treated with LPS or not and quantitative analysis of this protein levels, n = 5 (lower right). f) The mRNA levels of Nav1.6 was determined by qPCR in cortex and hippocampus of each group of mice, n = 6 mice for each group (left, middle) and in AQP4+/+ and AQP4−/− primary astrocytes treated with LPS or not, n = 6 for each group(right). e,f) Data are presented as mean ± SD. * p < 0.05, ** p < 0.01, *** p < 0.001; one‐way ANOVA with Tukey's post hoc test.
Figure 9
Figure 9
AQP4 regulates sodium‐calcium exchange through Nav1.6 to inhibit LPS‐induced astrocyte PPAR‐γ moving into the nucleus. a) Representative families of VGSC current traces in AQP4+/+ and AQP4−/− primary astrocytes which were stimulated by LPS or not (upper). The membrane potential was held at ‐80 mV, and the currents were elicited by 5 ms test pulses ranging from ‐80 to +40 mV in 5 mV steps. Current‐voltage relationship of VGSC currents in primary astrocytes (lower left). Mean current density of VGSC at ‐25 mV in primary astrocytes under different treatments (lower right). n = 8–13 cells from four independent experiments. b) Representative fluorescence images of primary astrocyte incubated with Fluo‐4 AM dye in different groups. Scale bar, 100 µm. c) Measurement of Fluo‐4 AM fluorescence intensity by microplate reader after AQP4+/+ and AQP4−/− primary astrocytes were treated with TTX, KB‐R7943 or EGTA, ATX II followed by LPS challenge or not. n = 6. d) Representative protein bands of PPAR‐γ in the nucleus after AQP4+/+ and AQP4−/− primary astrocytes treated with TTX, KB‐R7943, EGTA, or ATX II followed by LPS challenge or not (left). Quantitative analysis for PPAR‐γ/laminB1 ratio of relative protein expression in nucleus of all groups, n = 5. (right). Data are presented as mean ± SD. a) ** p < 0.01, **** p < 0.0001, two‐way ANOVA with Tukey's post hoc test; c,d) * p < 0.05, *** p < 0.001, **** p < 0.0001, one‐way ANOVA with Tukey's post hoc test.
Figure 10
Figure 10
AQP4 knockout antagonized PPAR‐γ to alleviate neuronal injury via Nav1.6 activation. a) Primary neurons were immunostained with MAP2 (green). The neurons were stimulated with cell culture media of AQP4+/+ and AQP4−/− primary astrocytes were treated with GW9662, 3‐MA followed by LPS challenge or not. scale bar, 40 µm. b) CCK8 assay was used to detect the neuron viability of each group. Survival rate = (mean absorbance of experimental group/mean absorbance of control group) × 100%. n = 8. c) Representative images of Nissl‐stained sections of cortex and hippocampus from different groups. Scale bar, 500 µm, 100 µm. Right panel, quantification of area and intensity of neuron in the mice cortex and hippocampus among different groups. n = 3 mice for each group. d) Cortical neurons of the six treatment groups, visualized by TEM. TEM analysis showed nuclear pyknosis and nuclear membrane rupture (red arrows) in AQP4+/+‐CLP, AQP4+/+‐CLP+SP, AQP4−/−‐CLP, AQP4−/−‐CLP+ATX II. Scale bar, 1 µm, 500 nm. e) The neurobehavioral scores of different group mice. n = 6–9 mice for each group. Data are presented as mean ± SD. * p < 0.05, ** p < 0.01, *** p < 0.001, one‐way ANOVA with Tukey's post hoc test.
Figure 11
Figure 11
AQP4 deletion activate PPAR‐γ to alleviate neuronal injury via Nav1.6 activation in SAE. The proposed mechanism flowchart depicting interference of AQP4's effect on the progression of SAE. Sepsis can accelerate the formation of the AQP4‐Nav1.6 complex in astrocyte and then causes a rapid influx of Na+ through VGSC. The increase of Na+ influx could cause an increase in intracellular calcium concentration by activating the reverse mode of the Na+/Ca2+ exchanger. Ca2+ overload inhibits PPAR‐γ/mTOR‑dependent autophagy and activates inflammation response in astrocyte, which resulting in neuron injury.

References

    1. Chung H.‐Y., Wickel J., Brunkhorst F. M., Geis C., J. Clin. Med. 2020, 9, 703. - PMC - PubMed
    1. Tian H.‐C., Zhou J.‐F., Weng L.i, Hu X.‐Y., Peng J.‐M., Wang C.‐Y., Jiang W., Du X.‐P., Xi X.‐M., An Y.‐Z., Duan M.‐L., Du B., Chin. Med. J. 2019, 132, 2039. - PMC - PubMed
    1. Thompson K., Venkatesh B., Finfer S., Intern. Med. J. 2019, 49, 160. - PubMed
    1. Pandharipande P. P., Girard T. D., Jackson J. C., Morandi A., Thompson J. L., Pun B. T., Brummel N. E., Hughes C. G., Vasilevskis E. E., Shintani A. K., Moons K. G., Geevarghese S. K., Canonico A., Hopkins R. O., Bernard G. R., Dittus R. S., Ely E. W., N. Engl. J. Med. 2013, 369, 1306. - PMC - PubMed
    1. Angus D. C., Linde‐Zwirble W. T., Lidicker J., Clermont G., Carcillo J., Pinsky M. R., Crit. Care Med. 2001, 29, 1303. - PubMed

Publication types

MeSH terms

Substances

LinkOut - more resources