

Review
doi: 10.1186/s12968-023-00925-0.
Revisiting how we perform late gadolinium enhancement CMR: insights gleaned over 25 years of clinical practice
Affiliations
- PMID: 36922844
- PMCID: PMC10018965
- DOI: 10.1186/s12968-023-00925-0
Item in Clipboard
Review
Revisiting how we perform late gadolinium enhancement CMR: insights gleaned over 25 years of clinical practice
J Cardiovasc Magn Reson.
.
No abstract available
Conflict of interest statement
The authors declare that they have no competing interests.
Figures
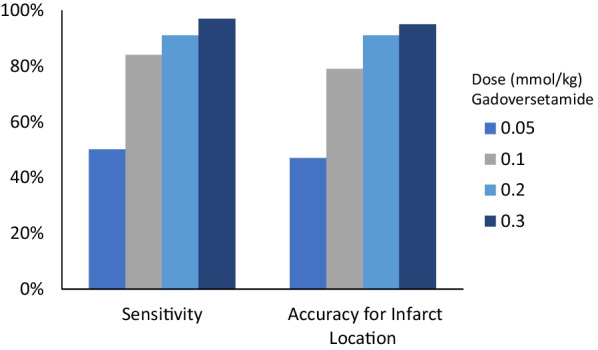
The relationship between the diagnostic performance of late gadolinium enhancement (LGE) and gadoversetamide contrast dose. Adapted from Kim et al. [3]
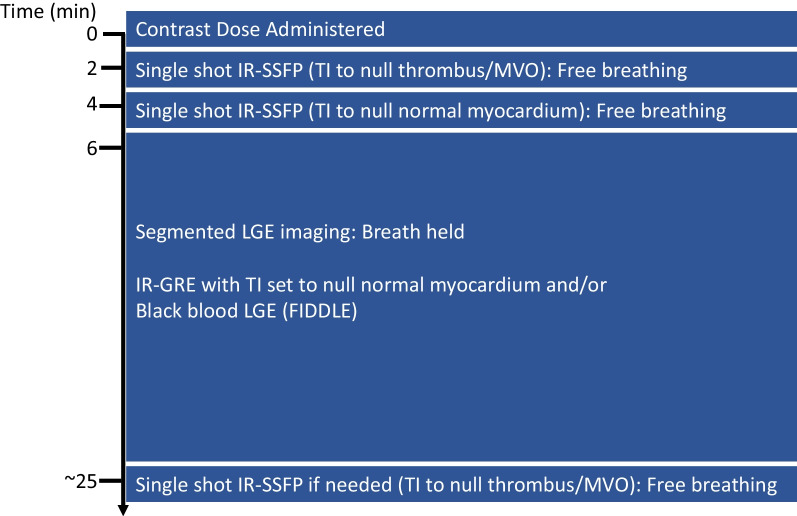
Timeline and LGE pulse sequence variants used at our center. IR-bSSFP: Inversion-recovery balanced steady state free precession, IR-GRE: Inversion recovery gradient echo; TI: Inversion Time; MVO: Microvascular obstruction
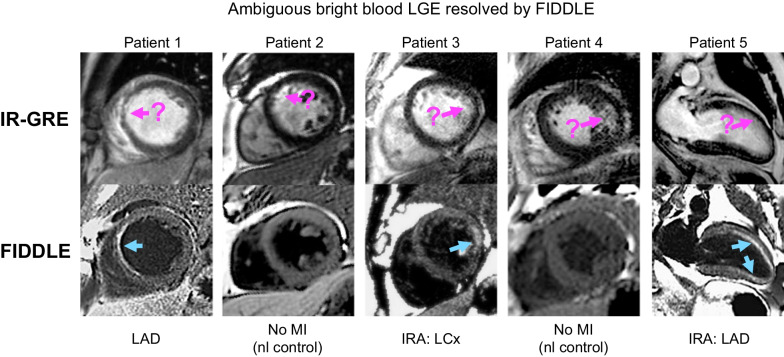
Images in 5 patients (n = 3 with myocardial infarction (MI), n = 2 control patients without MI) in whom the diagnosis of MI was ambiguous on conventional bright blood LGE (IR-GRE). In patients 1 and 2, there is possibly anteroseptal wall hyperenhancement on IR-GRE. FIDDLE shows unequivocal LGE in patient 5, but also demonstrates no LGE in patient 6, who is a normal control. Similarly, in patients 3 and 4, there are ambiguous regions of LGE on the IR-GRE images involving the lateral wall. FIDDLE identifies that patient 3 has lateral wall infarct, while patient 4 is a normal control. In patient 5, FIDDLE demonstrates not only a subendocardial infarct in the anterior wall but also extension into the inferoapical wall. IRA: infarct-related artery; IR-GRE: inversion recovery gradient echo; LAD: left anterior descending; LCx: left circumflex; MI: myocardial infarction; RCA: right coronary artery. Adapted from Kim et al. [6]
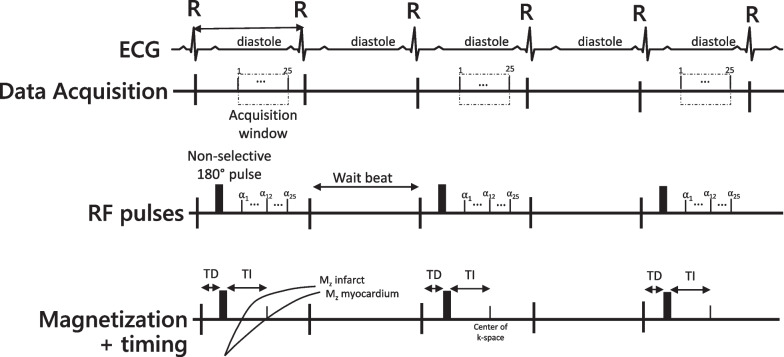
Timing diagram of two-dimensional segmented inversion-recovery fast gradient echo pulse sequence. ECG: The ECG tracing is used to trigger the image acquisition in mid-late diastole. Data Acquisition: The dashed box indicates the time during which the data is acquired (“Acquisition window”) which is controlled by the repetition time and the number of lines of k-space being acquired. RF pulses: The sequence begins with a non-selective 180° inversion pulse, followed by the readout pulses. The subsequent heart beat is a “wait beat” to allow for magnetization recovery between inversion pulses. Magnetization: After the detection of the R-wave, there is a time delay (TD) before the inversion pulse is played. The inversion pulse inverts the magnetization, which recovers based on the tissue T1. The recovery curves for infarct and myocardium are shown to highlight the differences in magnetization recovery due to the differences in post-contrast T1. At the time where the center of k-space is acquired, the magnetization of the myocardium is at the zero crossing, while the infarct magnetization is above the zero crossing. The resulting image contrast is that the myocardium has very little signal (magnetization is near zero) while the infarct is bright (significantly above zero). ECG: electrocardiogram. RF: radiofrequency; TD: trigger delay; TI: inversion time delay; α: shallow flip angle excitation
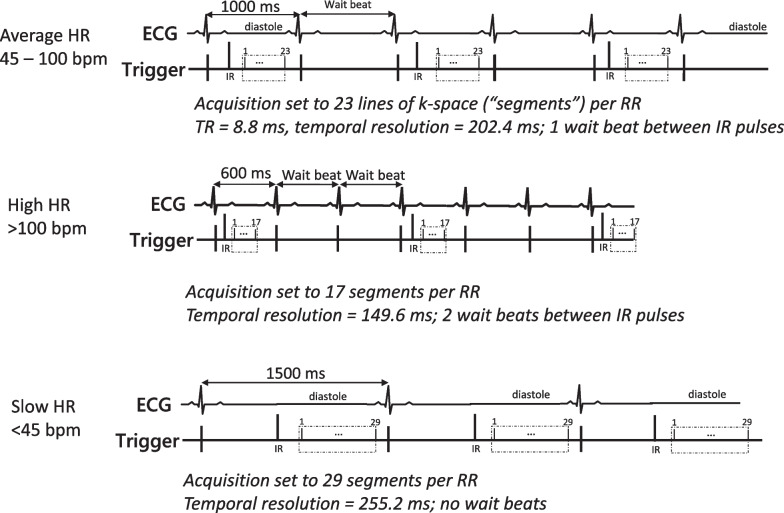
Data acquisition duration and gating factor depending on heart rate. TOP: ECG and readout timings for patients with typical heart rates seen in clinical practice (~ 45–100 bpm). Inversion pulses are played every other heartbeat to allow for longitudinal magnetization recovery between inversion pulses. MIDDLE: In patients with tachycardia (> 100 bpm), two parameter adjustments may be considered. First, the duration of the readout may be reduced by lowering the number of segments (lines per segment), improving the temporal resolution. Second, two wait beats (gating factor of 3) may be used, which allows greater recovery of longitudinal magnetization between inversion pulses. BOTTOM: In patients with bradycardia (< 45 bpm), a gating factor of 1 (no wait beats) can be considered. The time between inversion pulses is greater with very slow heart rates. Accordingly, there is sufficient recovery of longitudinal magnetization with no wait beats between inversion pulses. The duration of the acquisition window may be modestly increased to account for the longer prior of the diastolic standstill period
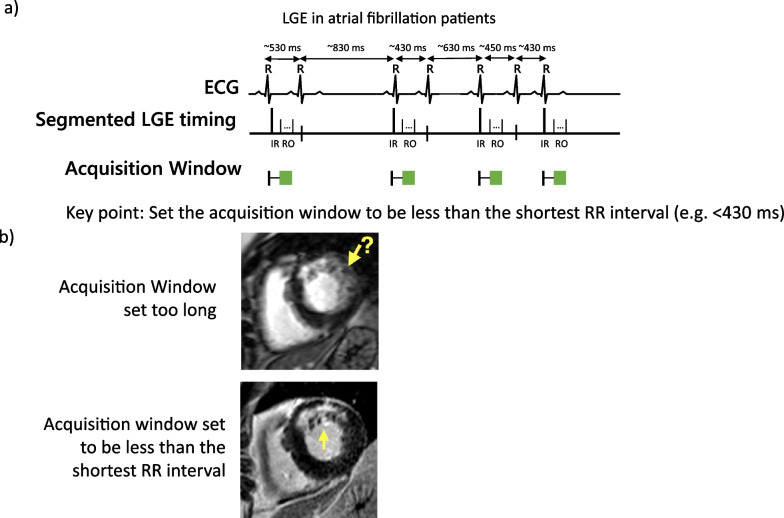
Adjustment to the data acquisition window for patients with atrial fibrillation. a In patients with atrial fibrillation (or other irregular rhythms), we adjust the data acquisition window such that the imaging readout is completed prior to the end of the shortest R–R interval between heart beats. b Examples of LGE images in a patient with atrial fibrillation. The top row shows in which the data acquisition window was set too long (> than the shortest R–R interval). There is substantial blurring of the subendocardium, and it is not clear if an infarct is present. The bottom row from the same patient in whom data acquisition was set to be less than the shortest R–R interval. Image sharpness is improved and the infarct is easily delineated from the blood pool and adjacent normal myocardium
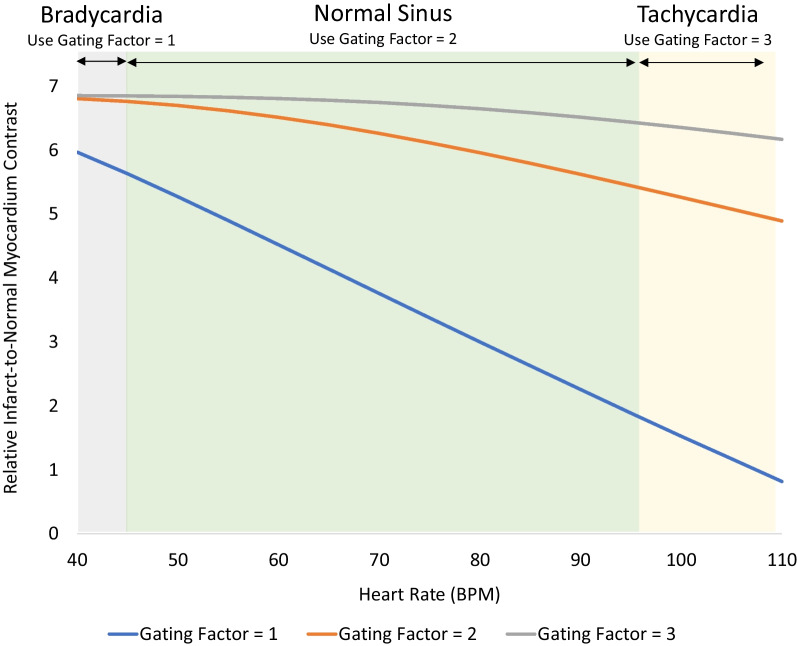
Simulation of relative image contrast for infarcted myocardium as a function of heart rate and gating factor. For patients with typical heart rates (45–100 bpm, green shading), a gating factor of 2 (orange line) is sufficient to allow for the majority of the longitudinal magnetization to recover between repeated inversion pulses with minimal saturation of magnetization. Thus, differences in image intensity between normal and infarcted myocardium are high and relatively flat across these heart rates with a gating factor of 2. For patients with tachycardia (> 100 bpm, yellow shading), a gating factor of 3 (gray line) is preferred since it maintains the time between repeated inversion pulses and allows longitudinal recovery to occur more fully. Compared to a gating factor of 2, the differences in image intensity between normal and infarcted myocardium are better maintained. The increase in total number of heart beats required to complete the image is partially offset by the increase in heart rate. For patients with significant bradycardia (< 45 bpm, gray shading), a gating factor of 1 (blue line) can be considered since the time between inversion pulses is longer and allows sufficient recovery between inversion pulses to occur. The decrease in number of heart beats required to complete the image reduces the breath hold time (assumes PSIR is not employed). Simulations using the Bloch equations assumed a GRE readout with 23 lines of k-space per heart beat, 19 degree readout flip angle, TI set to null normal myocardium, and an infarct T1 of 300 ms. PSIR = phase sensitive inversion recovery
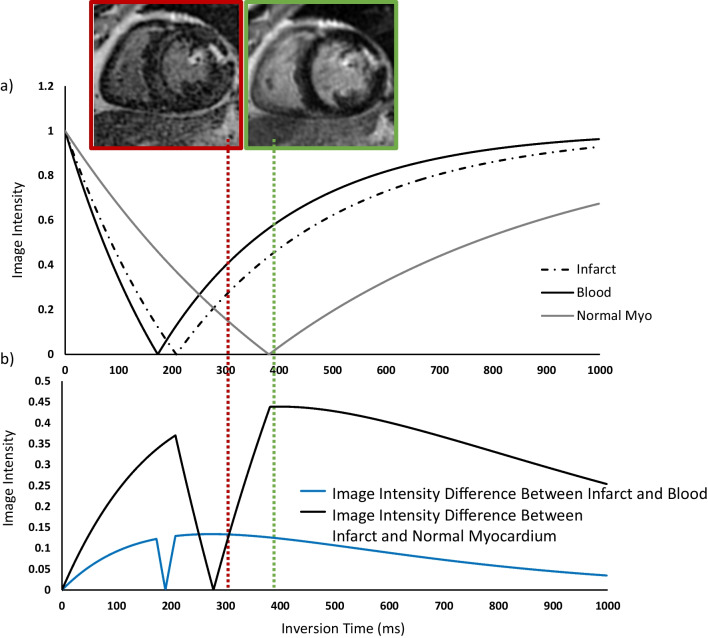
a Image intensity of normal and infarcted myocardium as a function of TI for magnitude reconstruction LGE. Simulations assumed a T1 of normal myocardium is 550 ms and infarcted myocardium is 350 ms, and blood is 300 ms. b Difference in image intensities between infarcted and normal myocardium as function of inversion time for magnitude reconstruction LGE. The time at which the magnetization of normal myocardium crosses zero is defined as the TI to null normal myocardium. This TI is considered ‘optimal’ because the image intensity difference between infarcted and normal myocardium is maximized (green box and line). Selection of a TI that is shorter than the optimal time (left of the green line) is problematic because the image intensity difference between infarct and normal myocardium can be significantly reduced (or possibly eliminated), and the relationship with the selected TI time is not linear. An indication that the TI is set ~ 20–50 ms too short is the presence of ‘etching’ (red box) which occurs at the interface between the blood pool and subendocardium due to the partial volume effect. The voxels situated at this interface include both myocardium (which is below the zero crossing) and blood pool (which is above the zero crossing), leading to a net magnetization of zero; these voxels appear black. The adjacent mid-myocardial voxels (below the zero crossing) and blood pool only voxels (above the zero crossing) are bright. Because of this artifact, we recommend that operators systematically select a TI that is slightly longer than optimal (~ 30 ms). The image intensity difference between infarct and normal myocardium with these slightly longer TIs (right of the green line) is predictable and stable. TI: inversion time
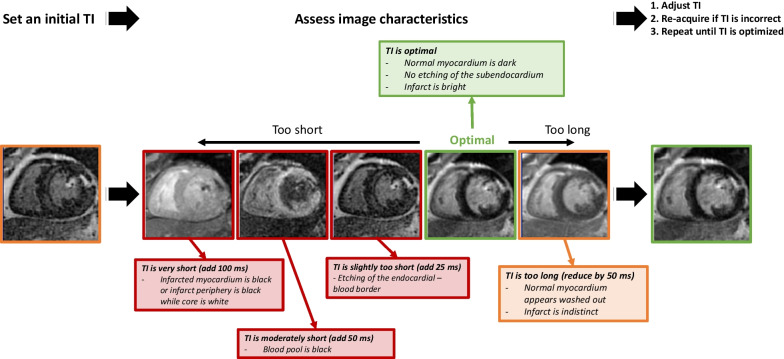
Iterative process for TI selection. After the acquisition of the initial LGE image, operators should adjust the TI based on the appearance of the myocardium. In particular, adjustments are imperative when the TI is set too short. Based on the imaging characteristics seen on the initial image, the TI should be adjusted (typically in small increments of 25–50 ms) accordingly. Using this iterative process, the optimal TI can usually be identified with 2–3 test images
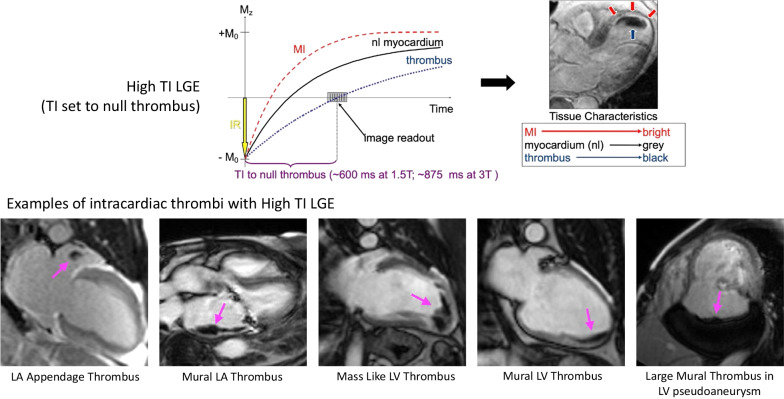
High TI LGE imaging for intracardiac thrombi. Top: Inversion recovery curves for myocardial infarction (MI), normal myocardium, and thrombus are shown. When a TI of 600 ms at 1.5 T or 875 ms at 3 T is used, intracardiac thrombi appear black, while other cardiac structures are gray or bright. Bottom: Examples of various intracardiac thrombi identified by high TI LGE are shown
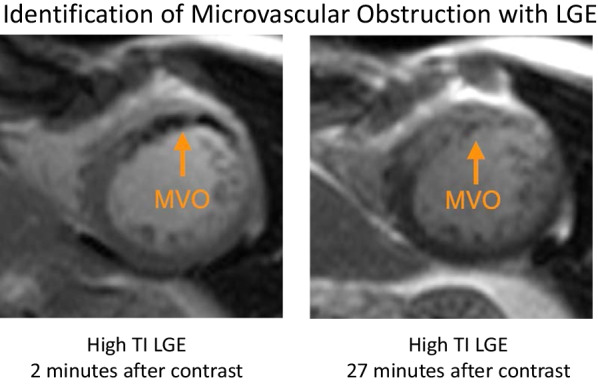
High TI LGE imaging of microvascular obstruction (MVO). Early after contrast administration, the central core of an infarct with MVO (left) appears black on high TI LGE. MVO (right) can be differentiated from thrombus by repeat imaging using the same sequence towards the end of examination. Unlike thrombus, infarcts with MVO will eventually exhibit contrast enhancement. MVO: microvascular obstruction
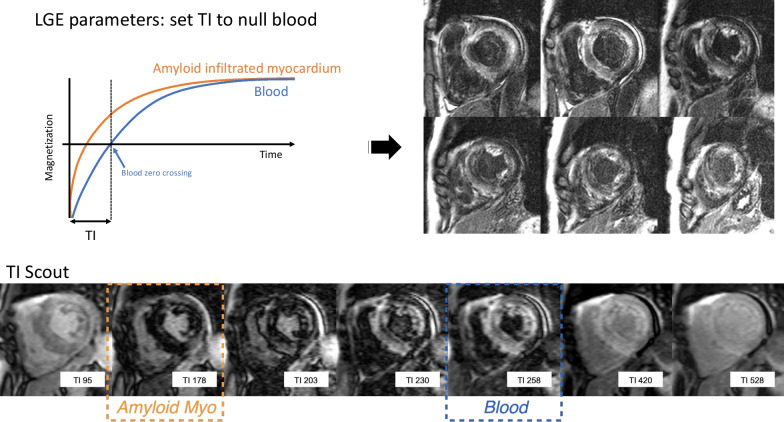
Cardiac amyloidosis. Top: Inversion recovery curves for the subset of patients with cardiac amyloidosis markedly altered gadolinium kinetics (left). Selection of the TI in this subset can often be confusing because, effectively, all the myocardium is abnormal and the null time for myocardium is shorter than blood. In this scenario, selecting an inversion time that null blood highlights the amyloid infiltration, and the regions with greater involvement have higher image intensity (right). Bottom: A TI scout can be used to quickly identify the presence of markedly altered gadolinium kinetics and to aid in the selection of the initial TI selection to null blood
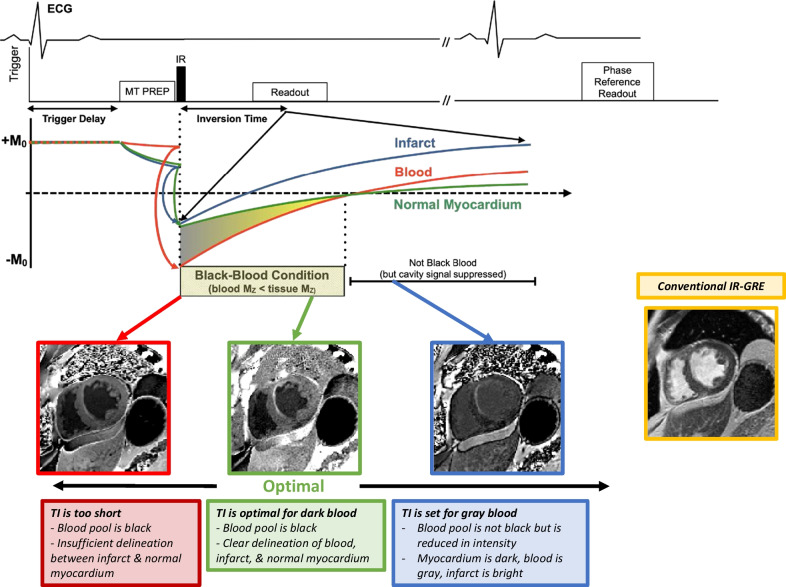
Top: FIDDLE pulse sequence timing diagram. The primary components are the: (1) preparatory module (MT prep), (2) inversion recovery pulse, (3) phase-sensitive reconstruction, and (4) inversion time, such that blood magnetization is less than tissue magnetization (Black-blood Condition). See text for details. MT = magnetization transfer. Bottom: The adjustment of inversion time is based upon image appearance after the acquisition of the first test image using a nominal TI (e.g., ~ 200 ms). Operators can identify the optimal dark blood TI by identifying the maximum inversion time that results in a dark blood image. Adapted from Kim et al. [6]
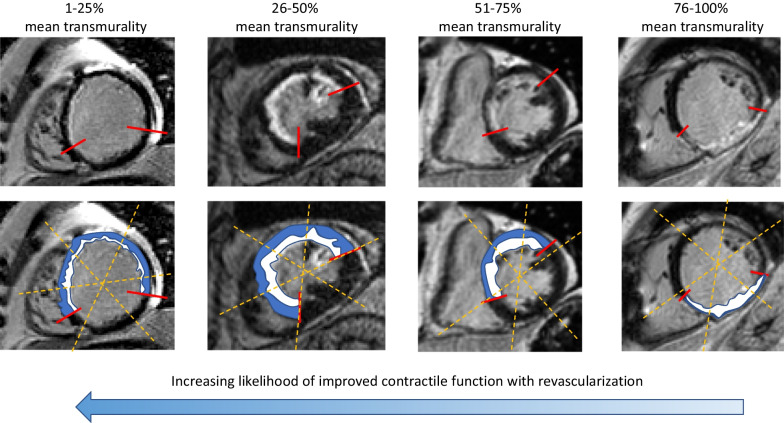
Representative LGE images with different mean transmural extent of infarction. Example images are shown on the top row, with a schematic highlighting the normal myocardium (blue) and the infarcted region (white). Dashed yellow lines represent the borders of the segment, and the red lines show the circumferential extent of the hyperenhancement. Importantly, interpretation should be based on the mean transmural extent of LGE within a segment, rather than the maximum transmural extent
Similar articles
-
Relationship of Myocardial Gadolinium Enhancement to Late Clinical Outcomes: Implications for the COVID-19 era.Heart Lung Circ. 2022 Mar;31(3):e29-e30. doi: 10.1016/j.hlc.2021.08.010. Epub 2021 Nov 1. Heart Lung Circ. 2022. PMID: 34736825 Free PMC article. No abstract available.
-
Myocardial late gadolinium enhancement in specific cardiomyopathies by cardiovascular magnetic resonance: a preliminary experience.J Cardiovasc Med (Hagerstown). 2007 Dec;8(12):1076-9. doi: 10.2459/01.JCM.0000296538.82763.f0. J Cardiovasc Med (Hagerstown). 2007. PMID: 18163027
-
Late Gadolinium Enhancement Cardiac Magnetic Resonance Tissue Characterization for Cancer-Associated Cardiac Masses: Metabolic and Prognostic Manifestations in Relation to Whole-Body Positron Emission Tomography.J Am Heart Assoc. 2019 May 21;8(10):e011709. doi: 10.1161/JAHA.118.011709. J Am Heart Assoc. 2019. PMID: 31072171 Free PMC article.
-
Prognostic Value of Late Gadolinium Enhancement Detected on Cardiac Magnetic Resonance in Cardiac Sarcoidosis.JACC Cardiovasc Imaging. 2023 Mar;16(3):345-357. doi: 10.1016/j.jcmg.2022.10.018. Epub 2023 Jan 11. JACC Cardiovasc Imaging. 2023. PMID: 36752432
-
Machine Learning-Based Segmentation of Left Ventricular Myocardial Fibrosis from Magnetic Resonance Imaging.Curr Cardiol Rep. 2020 Jun 19;22(8):65. doi: 10.1007/s11886-020-01321-1. Curr Cardiol Rep. 2020. PMID: 32562100 Review.
Cited by
-
Cardiac Magnetic Resonance for Structural Aortic Valve Stenosis Procedures.J Clin Med. 2024 Sep 1;13(17):5184. doi: 10.3390/jcm13175184. J Clin Med. 2024. PMID: 39274397 Free PMC article. Review.
-
H-ferritin-nanocaged gadolinium nanoparticles for ultra-sensitive MR molecular imaging.Theranostics. 2024 Feb 24;14(5):1956-1965. doi: 10.7150/thno.93856. eCollection 2024. Theranostics. 2024. PMID: 38505606 Free PMC article.
-
Quantification of Replacement Fibrosis in Aortic Stenosis: A Narrative Review on the Utility of Cardiovascular Magnetic Resonance Imaging.Diagnostics (Basel). 2024 Oct 31;14(21):2435. doi: 10.3390/diagnostics14212435. Diagnostics (Basel). 2024. PMID: 39518402 Free PMC article. Review.
-
Myocardial Damage Patterns in Patients with Left Ventricular Systolic Dysfunction with and Without Coronary Artery Disease Referred for Cardiac Magnetic Resonance.Biomedicines. 2025 Jul 1;13(7):1612. doi: 10.3390/biomedicines13071612. Biomedicines. 2025. PMID: 40722685 Free PMC article.
-
Pre-hospital pulse glucocorticoid therapy in patients with ST-segment elevation myocardial infarction transferred for primary percutaneous coronary intervention: a randomized controlled trial (PULSE-MI).Trials. 2023 Dec 15;24(1):808. doi: 10.1186/s13063-023-07830-y. Trials. 2023. PMID: 38102687 Free PMC article. Clinical Trial.
References
-
- Kim RJ, Albert TS, Wible JH, Elliott MD, Allen JC, Lee JC, Parker M, Napoli A, Judd RM. Gadoversetamide Myocardial Infarction Imaging I. Performance of delayed-enhancement magnetic resonance imaging with gadoversetamide contrast for the detection and assessment of myocardial infarction: an international, multicenter, double-blinded, randomized trial. Circulation. 2008;117:629–637. doi: 10.1161/CIRCULATIONAHA.107.723262. - DOI - PubMed
-
- Weinreb JC, Rodby RA, Yee J, Wang CL, Fine D, McDonald RJ, Perazella MA, Dillman JR, Davenport MS. Use of intravenous gadolinium-based contrast media in patients with kidney disease: Consensus Statements from the American College of Radiology and the National Kidney Foundation. Radiology. 2021;298:28–35. doi: 10.1148/radiol.2020202903. - DOI - PubMed
-
- Sievers B, Elliott MD, Hurwitz LM, Albert TS, Klem I, Rehwald WG, Parker MA, Judd RM, Kim RJ. Rapid detection of myocardial infarction by subsecond, free-breathing delayed contrast-enhancement cardiovascular magnetic resonance. Circulation. 2007;115:236–244. doi: 10.1161/CIRCULATIONAHA.106.635409. - DOI - PubMed
Publication types
MeSH terms
Substances
LinkOut - more resources
Full Text Sources
