. 2023 Mar 15;18(1):10.
doi: 10.1186/s13062-023-00365-x.

Image-based modeling of vascular organization to evaluate anti-angiogenic therapy

Affiliations

Image-based modeling of vascular organization to evaluate anti-angiogenic therapy

David Ascheid et al. Biol Direct. .

Abstract

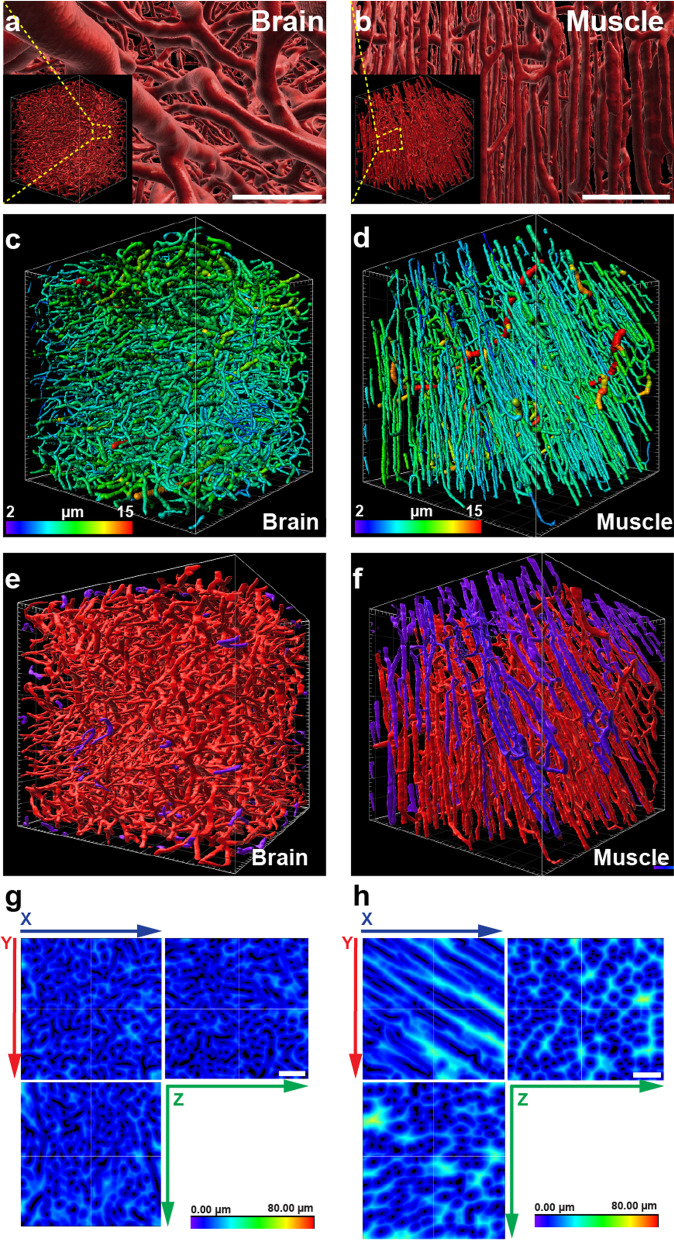
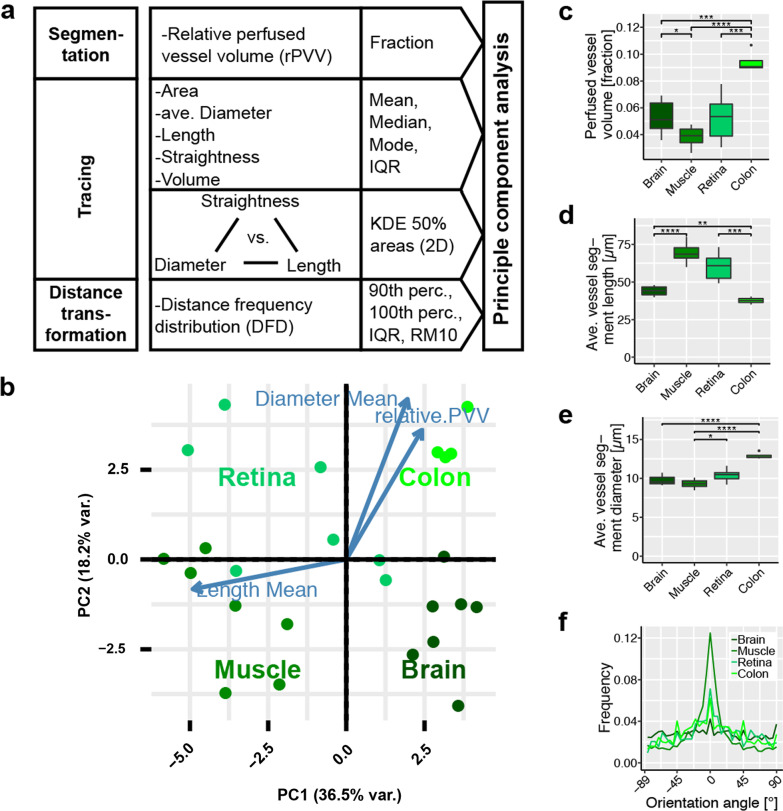
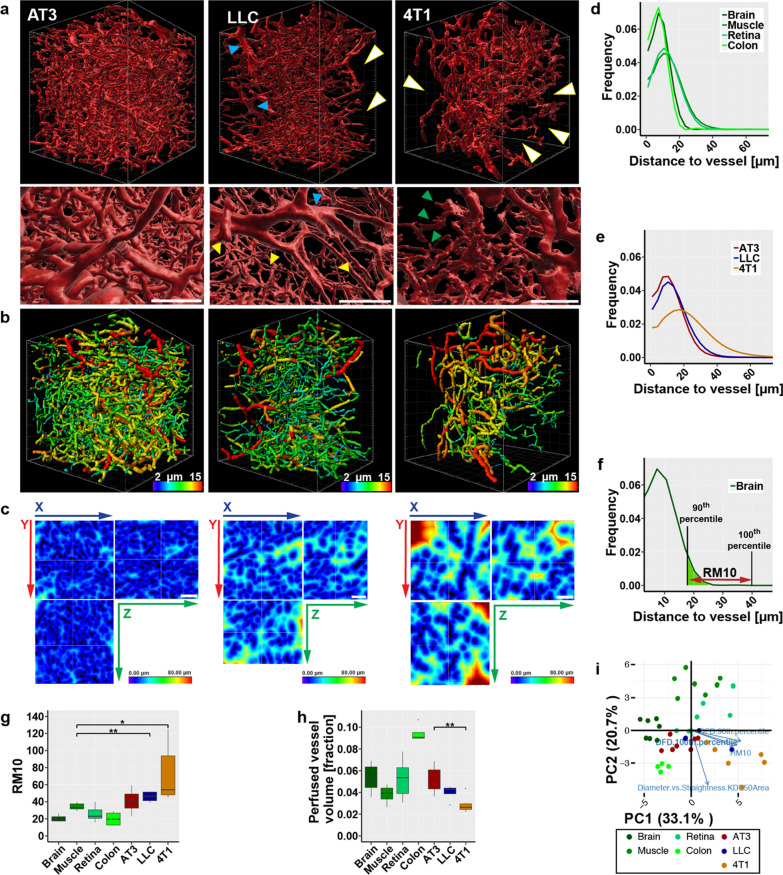
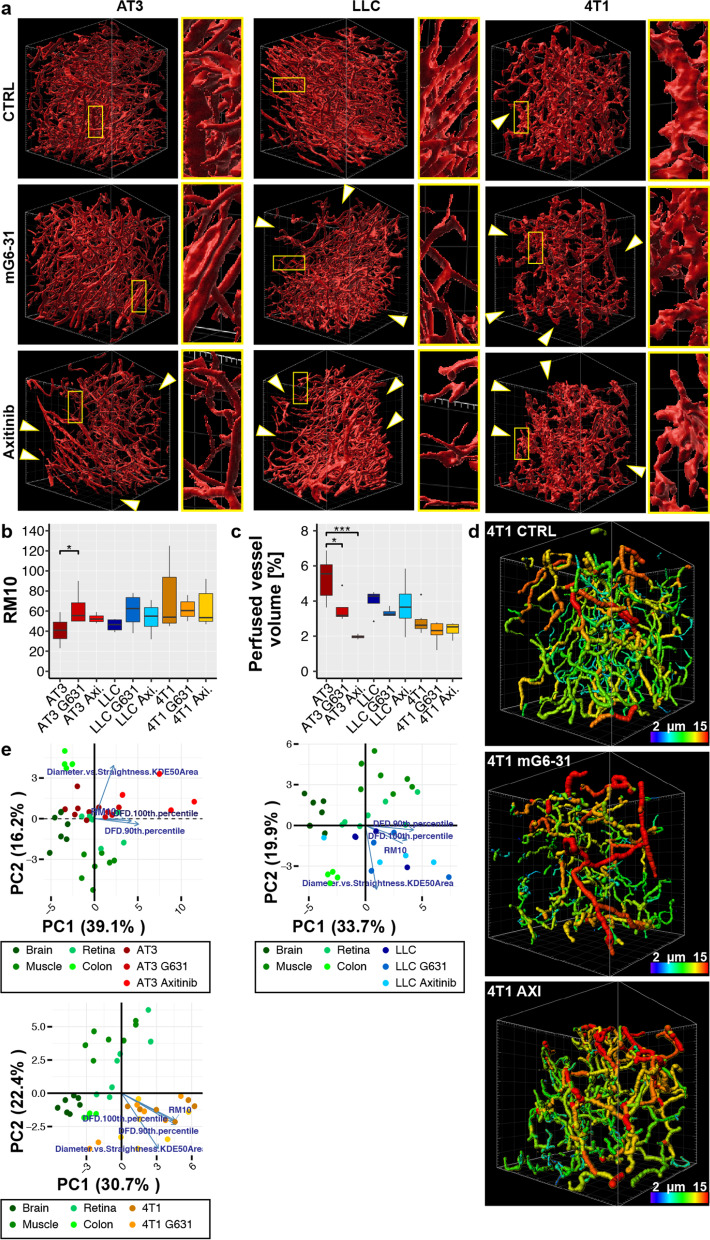
In tumor therapy anti-angiogenic approaches have the potential to increase the efficacy of a wide variety of subsequently or co-administered agents, possibly by improving or normalizing the defective tumor vasculature. Successful implementation of the concept of vascular normalization under anti-angiogenic therapy, however, mandates a detailed understanding of key characteristics and a respective scoring metric that defines an improved vasculature and thus a successful attempt. Here, we show that beyond commonly used parameters such as vessel patency and maturation, anti-angiogenic approaches largely benefit if the complex vascular network with its vessel interconnections is both qualitatively and quantitatively assessed. To gain such deeper insight the organization of vascular networks, we introduce a multi-parametric evaluation of high-resolution angiographic images based on light-sheet fluorescence microscopy images of tumors. We first could pinpoint key correlations between vessel length, straightness and diameter to describe the regular, functional and organized structure observed under physiological conditions. We found that vascular networks from experimental tumors diverted from those in healthy organs, demonstrating the dysfunctionality of the tumor vasculature not only on the level of the individual vessel but also in terms of inadequate organization into larger structures. These parameters proofed effective in scoring the degree of disorganization in different tumor entities, and more importantly in grading a potential reversal under treatment with therapeutic agents. The presented vascular network analysis will support vascular normalization assessment and future optimization of anti-angiogenic therapy.

Keywords: 3D image analysis; Cancer; Light sheet fluorescence microscopy; Optical clearing; Tumor microenvironment; Vascular structure.


Conflict of interest statement

The authors declare no conflicts of interest. We further declare that the funders had no role in the design of the study; in the collection, analyses, or interpretation of data; in the writing of the manuscript; or in the decision to publish the results.

Figures

Fig. 1
Fig. 1
Vascular structures in healthy organs. a Representative 3D-projection of the perfused vasculature in the frontal cortex of the murine brain after segmentation. SB: 100 µm. Insert: full representation of the tissue fragment acquired by LSFM. Grid scale: 50 µm. b Representative 3D-projection of the perfused vasculature in the murine skeletal muscle after segmentation. SB: 100 µm. Insert: full representation of the tissue fragment acquired by LSFM. Grid scale: 50 µm. c Tracing results of perfused vessels in the murine brain. Vessel segments are displayed color-coded according to average diameters. Grid scale: 50 µm; Color scale: Average vessel segment diameter: 2-15 µm. d Tracing results of perfused vessels in the murine skeletal muscle. Vessel segments are displayed color-coded according to average diameters. Grid scale: 50 µm; Color scale: Average vessel segment diameter: 2-15 µm. e Rendering of segmented vasculature in the murine brain. The majority of vessels in the displayed cubic section forms an interconnected structure (red). On the surfaces of the displayed structure are few vessel segments (purple) observable that are not connected within the visible volume to the bulk of vessels. Grid scale: 50 µm. f Rendering of segmented vasculature in the murine skeletal muscle. The majority of vessels in the displayed cubic section forms an interconnected structure (red). On the surfaces of the displayed structure several large vessel segments (purple) are observable that are not connected within the visible volume to the bulk of vessels. Grid scale: 50 µm. g Heatmap display of distances from nearest perfused vessel in the murine brain. SB: 100 µm. h Heatmap display of distances from nearest perfused vessel in the murine skeletal muscle. SB: 100 µm
Fig. 2
Fig. 2
Evaluation process and statistical analysis: Results for healthy organs. a Schematic representation of the approach for determine variables used in principal component analysis (PCA). b PCA for the healthy tissues. Orientations of the three highest ranked variables are shown as blue arrows. c Relative perfused vessel volume (rPVV) as fraction of the whole tissue volume. n ≥ 6. d Average vessel segment length in selected organs. n ≥ 6. e Average vessel segment diameter in selected organs. n ≥ 6. f Vessel orientation angle within the XY-plane in selected organs. Angles centered around most frequent orientation at 0°. n ≥ 6, for clarity only the average values are shown. Error bars: ± SEM. Asterisks display results from statistical tests with *: P < 0.05, **: P < 0.01, ***: P < 0.001, ****: P < 0.0001
Fig. 3
Fig. 3
Comparison of selected intravital stained tumors with healthy organs. a Segmentation of the perfused vasculature in three different tumors. Detail showing the differences in surface structure of the vessels. White arrowheads: areas void of perfused vessels. Blue arrowheads: enlarged vessels. Yellow arrowheads: small capillaries. Green arrowheads: irregular protrusion on vessels in 4T1 tumors. Grid scale: 50 µm, SB: 100 µm. b Tracing results of perfused vessels in the respective tumor models. Vessel segments are displayed color-coded according to average diameters. Grid scale: 50 µm. c Heatmaps displaying distances from nearest perfused vessel in the respective tumors. SB: 100 µm. d Distance frequency distribution to closest perfused vessel in healthy organs. n ≥ 4. e Distance frequency distribution to closest perfused vessel in tumors. n ≥ 4. f Graphical explanation of the RM10 value on the example of the distance frequency distribution in the brain. g Comparison of RM10 values of normal organs and tumors. n ≥ 4. h Comparison of perfused vessel volume as fraction from total tissue volume of normal organs and tumors. n ≥ 4. i Results from PCA of vascular parameters in normal organs and in the three tumor models. Orientation of four highly ranked selected variables (blue arrows) are shown. Error bars: ± SEM. Asterisks display results from statistical tests with *: P < 0.05, **: P < 0.01, ***: P < 0.001, ****: P < 0.0001
Fig. 4
Fig. 4
Effect of anti-angiogenic treatment on vasculature of tumors. a Segmentation of the perfused vasculature in different tumors including lineup of treatment results with the two anti-angiogenic agents mG6-31 and axitinib. White arrows indicate larger areas void of perfused vessels. Grid scale: 50 µm. b Comparison of RM10 values between tumors and tumors treated with mG6-31 or axitinib. n ≥ 4. c Comparison of relative perfused vessel volume between tumors and tumors treated with mG6-31 or axitinib. n ≥ 4. d Tracing results of perfused vessels in 4T1 tumors after treatment with mG6-31 or axitinib. Vessel segments are displayed color-coded according to average diameters. Treatment did not result in a more homogeneous distribution of vessel diameters, but overall vessel diameter was increased. Grid scale: 50 µm. e Results from PCA of vascular parameters in normal organs and in the three tumor models after anti- angiogenic therapy with either mG6-31 or axitinib. Orientation of four highly ranked selected variables (blue arrows) are shown. Error bars: ± SEM. Asterisks display results from statistical tests with *: P < 0.05, **: P < 0.01, ***: P < 0.001, ****: P < 0.0001
Fig. 5
Fig. 5
Analysis of vessel average diameter versus vessel straightness. a Scatterplot of vessel average diameters vs vessel straightness of healthy tissue. b Scatterplot of vessel average diameters vs vessel straightness of control tumors and after tumors after antiangiogenic treatment. Each panel shows only one representative tissue sample for clarity. Black line contours 50% kernel density estimate area (KDE area) and grey line contours 90% KDE area. c Comparison of the 50% KDE Area in healthy tissue and in tumor tissue. n ≥ 4. d Comparison of the 50% KDE Area in tumor tissue and in tumor tissue after anti-angiogenic treatment with mG631 or Axitinib. n = 4–6. Error bars: ± SEM. Asterisks display results from statistical tests with *: P < 0.05, **: P < 0.01, ***: P < 0.001, ****: P < 0.0001

References

    1. Bates DO. Vascular endothelial growth factors and vascular permeability. Cardiovasc Res. 2010;87(2):262–271. doi: 10.1093/cvr/cvq105. - DOI - PMC - PubMed
    1. Frisbee JC. Vascular dysfunction in obesity and insulin resistance. Microcirculation. 2007;14(4–5):269–271. doi: 10.1080/10739680701296705. - DOI - PubMed
    1. Sprague AH, Khalil RA. Inflammatory cytokines in vascular dysfunction and vascular disease. Biochem Pharmacol. 2009;78(6):539–552. doi: 10.1016/j.bcp.2009.04.029. - DOI - PMC - PubMed
    1. Jain RK. Normalizing tumor vasculature with anti-angiogenic therapy: a new paradigm for combination therapy. Nat Med. 2001;7(9):987–989. doi: 10.1038/nm0901-987. - DOI - PubMed
    1. Gilkes DM, et al. Collagen prolyl hydroxylases are essential for breast cancer metastasis. Cancer Res. 2013;73(11):3285–3296. doi: 10.1158/0008-5472.CAN-12-3963. - DOI - PMC - PubMed

Publication types

MeSH terms

Substances