. 2023 Mar 16;18(1):17.
doi: 10.1186/s13024-023-00610-x.

Astrocytic APOE4 removal confers cerebrovascular protection despite increased cerebral amyloid angiopathy

Affiliations

Astrocytic APOE4 removal confers cerebrovascular protection despite increased cerebral amyloid angiopathy

Monica Xiong et al. Mol Neurodegener. .

Abstract

Background: Alzheimer Disease (AD) and cerebral amyloid angiopathy (CAA) are both characterized by amyloid-β (Aβ) accumulation in the brain, although Aβ deposits mostly in the brain parenchyma in AD and in the cerebrovasculature in CAA. The presence of CAA can exacerbate clinical outcomes of AD patients by promoting spontaneous intracerebral hemorrhage and ischemia leading to CAA-associated cognitive decline. Genetically, AD and CAA share the ε4 allele of the apolipoprotein E (APOE) gene as the strongest genetic risk factor. Although tremendous efforts have focused on uncovering the role of APOE4 on parenchymal plaque pathogenesis in AD, mechanistic studies investigating the role of APOE4 on CAA are still lacking. Here, we addressed whether abolishing APOE4 generated by astrocytes, the major producers of APOE, is sufficient to ameliorate CAA and CAA-associated vessel damage.

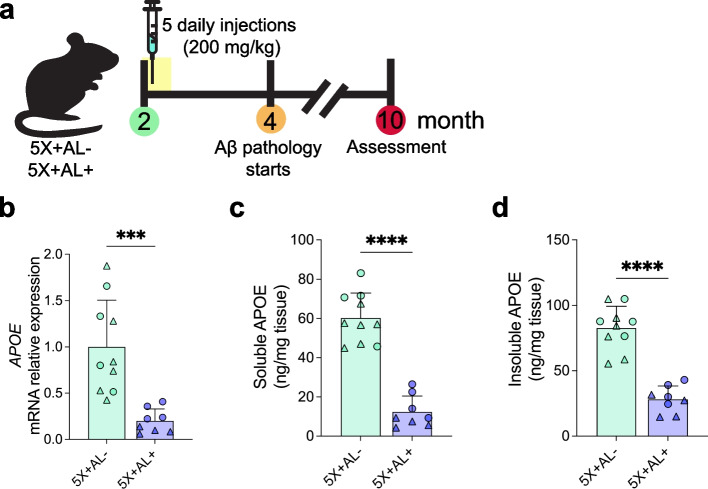
Methods: We generated transgenic mice that deposited both CAA and plaques in which APOE4 expression can be selectively suppressed in astrocytes. At 2-months-of-age, a timepoint preceding CAA and plaque formation, APOE4 was removed from astrocytes of 5XFAD APOE4 knock-in mice. Mice were assessed at 10-months-of-age for Aβ plaque and CAA pathology, gliosis, and vascular integrity.

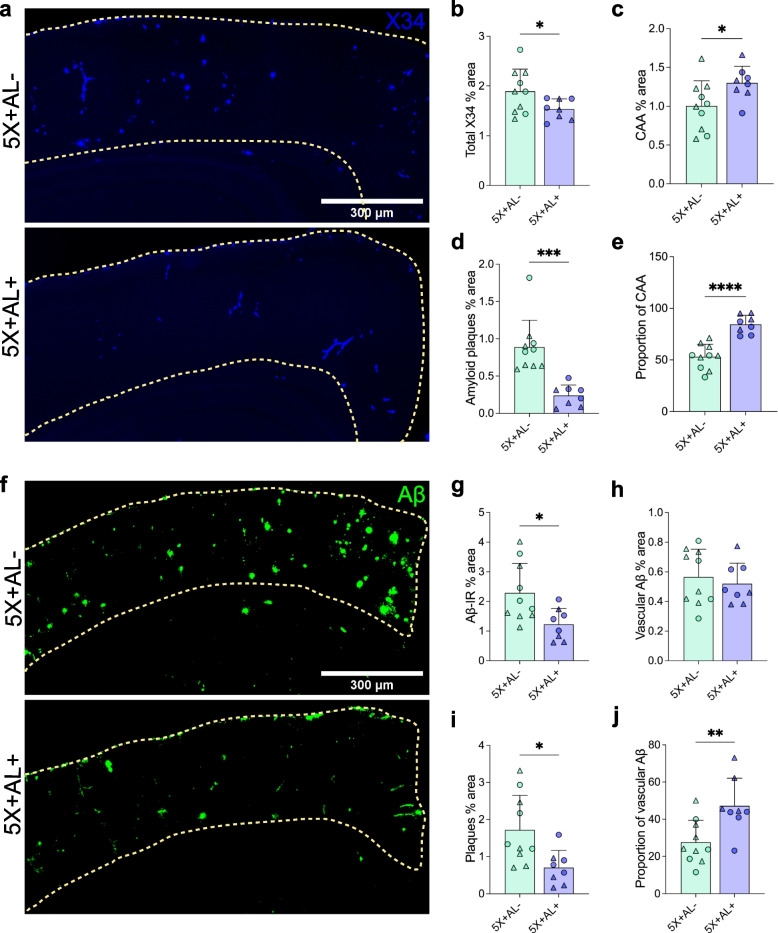
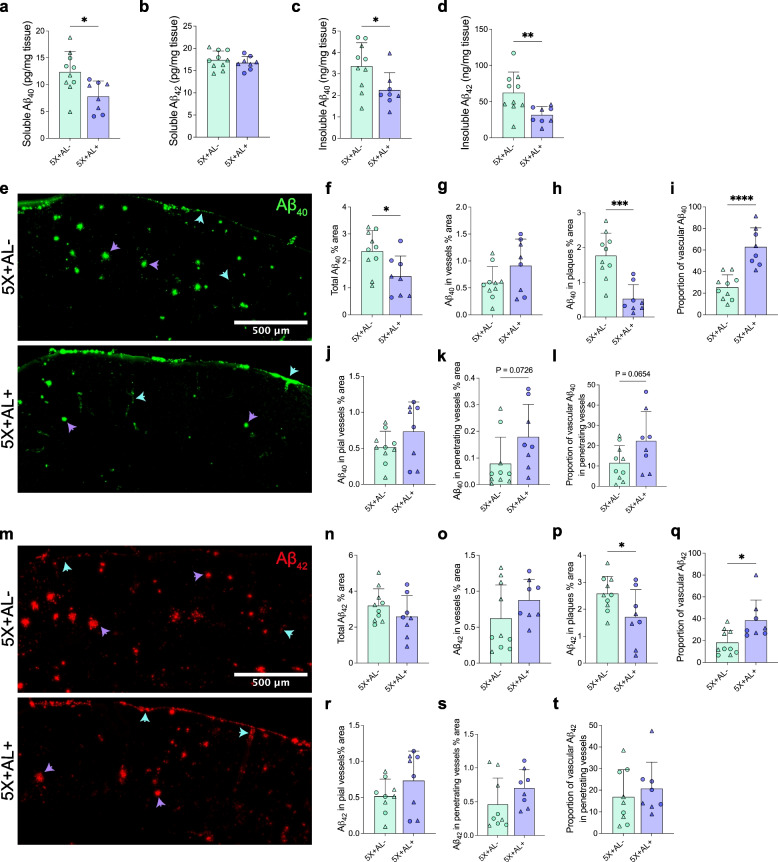
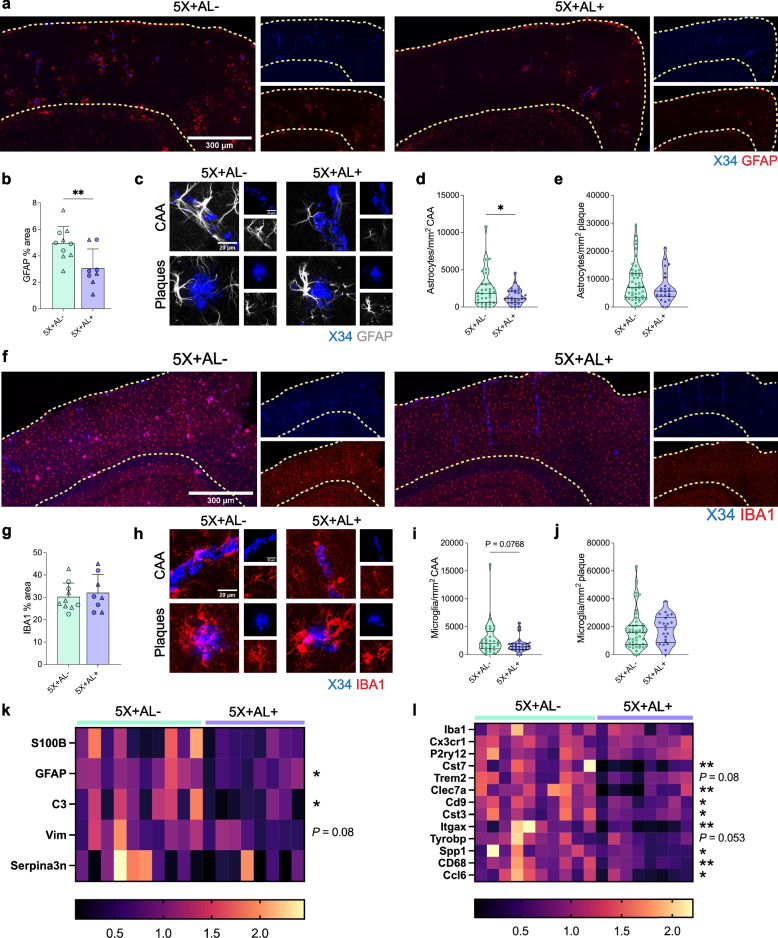
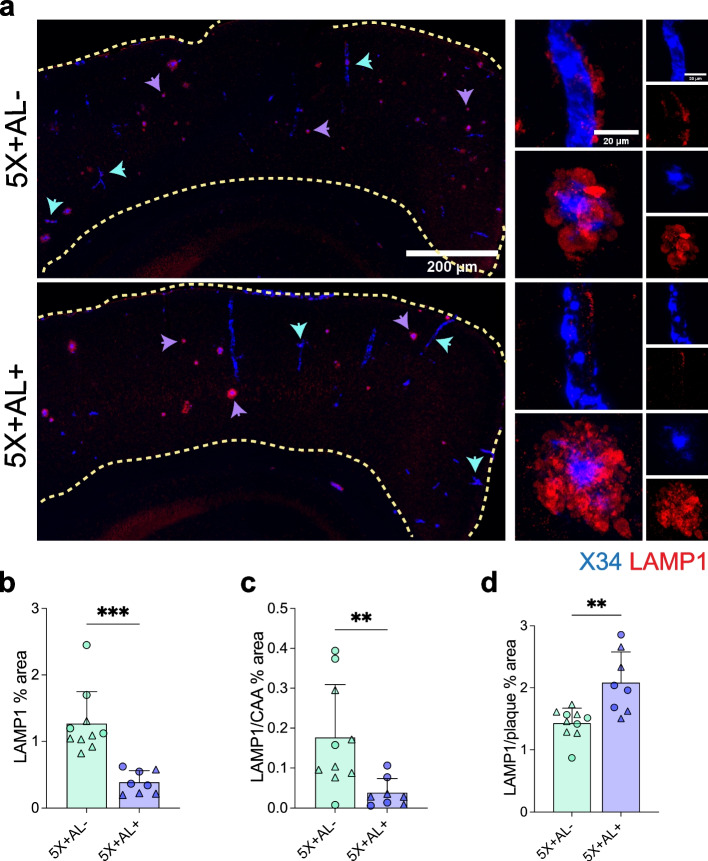
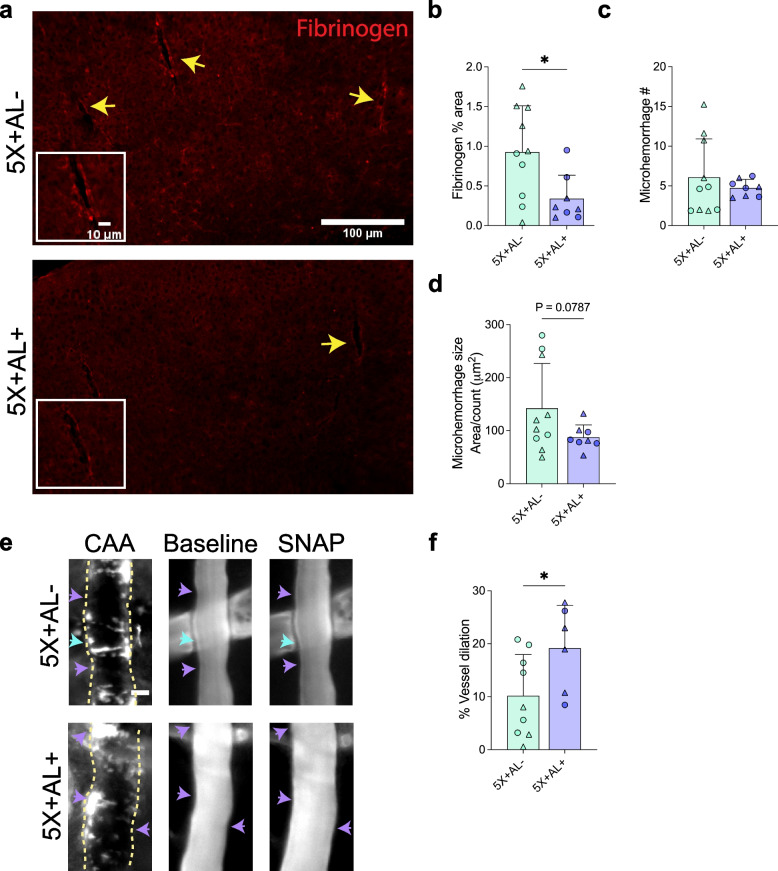
Results: Reducing the levels of APOE4 in astrocytes shifted the deposition of fibrillar Aβ from the brain parenchyma to the cerebrovasculature. However, despite increased CAA, astrocytic APOE4 removal reduced overall Aβ-mediated gliosis and also led to increased cerebrovascular integrity and function in vessels containing CAA.

Conclusion: In a mouse model of CAA, the reduction of APOE4 derived specifically from astrocytes, despite increased fibrillar Aβ deposition in the vasculature, is sufficient to reduce Aβ-mediated gliosis and cerebrovascular dysfunction.

Keywords: APOE; Amyloid-β; Astrocyte; Cerebral amyloid angiopathy; Cerebrovasculature.


Conflict of interest statement

M.X. is an employee of Genentech. D.M.H. is as an inventor on a patent licensed by Washington University to NextCure on the therapeutic use of anti-APOE antibodies. D.M.H. co-founded and is on the scientific advisory board of C2N Diagnostics. D.M.H. is on the scientific advisory board of Denali, Genentech, and Cajal Neuroscience and consults for Alector. All other authors declare that they have no competing interests to disclose.

Figures

Fig. 1
Fig. 1
Tamoxifen-induced Cre recombination reduces both APOE mRNA and protein. a Schematic timeline of tamoxifen treatment (5 daily injections at 200 mg/kg) in 2-month-old 5XFAD (line 7031) x APOE4flox/flox (5X+AL-) or 5XFAD (line 7031) x APOE4flox/flox x Aldhl1l-Cre/ERT2 (5X+AL+) mice, assessed at 10-months of age. b Relative expression of APOE mRNA normalized to beta-actin in cortex. c, d PBS-soluble and guanidine-HCL-soluble (“insoluble”) APOE protein concentrations assessed by ELISA from cortex. Data expressed as mean ± SD, student’s t-test (two-sided) performed for all statistical analyses except (b), where Welch’s t-test was performed. ∆ = males, ○ = females. ***P < 0.001, ****P < 0.0001. No other statistical comparisons are significant unless indicated
Fig. 2
Fig. 2
Removal of astrocytic APOE4 before amyloid deposition shifts Aβ distribution from plaques to the cerebrovasculature. ad, X34 staining for fibrillar plaques/CAA (a) with percent area coverage of total X34 (b), CAA (c), and amyloid plaques (d) in the cortex overlying the hippocampus of 10-month-old 5X+AL- or 5X+AL+ mice after astrocytic APOE4 removal at 2-months-of-age. e, Proportion of CAA in total X34+ staining. f–i, Aβ immunoreactivity (Aβ-IR) (f) with percent area coverage of total Aβ-IR (g), vascular Aβ-IR (h), and plaques (i) in the cortex overlying the hippocampus. j Proportion of vascular Aβ in total Aβ-IR. Scalebar: 300 µm. Data expressed as mean ± SD, unpaired student’s t-test (two-sided) performed for all statistical analyses except (b), where Welch’s t-test was performed. ∆ = males, ○ = females. *P < 0.05, **P < 0.01, ***P < 0.001, ****P < 0.0001. No other statistical comparisons are significant unless indicated
Fig. 3
Fig. 3
Astrocytic APOE4 regulates the distribution of Aβ40 and Aβ42 deposition in plaques, parenchymal vessels, and leptomeningeal vessels. ad, PBS-soluble and guanidine-HCL-soluble (“insoluble”) Aβ40 and Aβ42 protein concentrations assessed by ELISA from cortex. eh40 immunoreactivity (IR) (e) with percent area coverage of total Aβ40 (f), total vascular Aβ40 (g), and Aβ40 in plaques (h). i Proportion of vascular Aβ40 in total Aβ40 IR. j, k40 IR restricted to pial vessels (j) and penetrating vessels (k). (l) Proportion of vascular Aβ40 in penetrating vessels out of total vascular Aβ40. mp, Aβ42 immunoreactivity (IR) (m) with percent area coverage of total Aβ42 (n), total vascular Aβ42 (o), and Aβ42 in plaques (p). q Proportion of vascular Aβ42 in total Aβ42 IR. r, s, Aβ42 IR restricted to pial vessels (r) and penetrating vessels (s). t Proportion of vascular Aβ42 in penetrating vessels out of total vascular Aβ42. Blue arrow = vascular Aβ. Purple arrows = plaques. Scalebar: 500 µm. Data expressed as mean ± SD, student’s t-test (two-sided) performed for all statistical analyses except (d), where Welch’s t-test was performed. ∆ = males, ○ = females. *P < 0.05, *P < 0.01, ***P < 0.001, ****P < 0.0001. No other statistical comparisons are significant unless indicated
Fig. 4
Fig. 4
Depletion of APOE in astrocytes diminishes certain disease-associated glial signatures. ae, GFAP+ astrocytic staining (a) and quantification of area coverage (b) in the cortex of 10-month-old 5X+AL- or 5X+AL+ mice. Scalebar: 300 µm. Representative images (c) and quantification of the number of astrocytes surrounding CAA (d) or plaques (e). Scalebar: 20 µm. Each point represents the number of astrocytes surrounding a single CAA or plaque normalized to that CAA or plaque area from n = 8–10 mice per group. f–j, IBA1+ microglial coverage (f) and quantification of area coverage (g) in the cortex overlying the hippocampus. Scalebar: 300 µm. Per plaque analysis of number of microglia clustering CAA (h, i) or plaques (j). Scalebar: 20 µm. Each point represents the number of microglia surrounding a single CAA or plaque normalized to that CAA or plaque area from n = 8–10 mice per group. k, l, Relative mRNA expression of homeostatic and disease-associated astrocytic (k) and microglial genes (l). Data imputed for Clec7a mRNA (column 10) but not used in statistical analysis. Each column represents an individual mouse. Data expressed as mean ± SD, student’s t-test (two-sided) performed for all statistical analyses except (d), (e), (kS100β), and (lCst7, Cst3, Itgax, Spp1) where Welch’s t-test was performed. ∆ = males, ○ = females. *P < 0.05, **P < 0.01. No other statistical comparisons are significant unless indicated
Fig. 5
Fig. 5
Astrocytic APOE removal protects against dystrophic neurites. a–d, LAMP1 staining for dystrophic neurites (a) with quantification of the percentage of total LAMP1 in the cortex (b), percent area coverage of LAMP1 staining around CAA normalized to percent area covered by X34+ CAA (c), and percent area coverage of LAMP1 staining around plaques normalized to percent area covered by X34+ plaques (d). Scalebar: 200 µm. Purple arrowheads: LAMP1 around plaques. Blue arrowheads: LAMP1 around CAA. Data expressed as mean ± SD, student’s t-test (two-sided) performed for all statistical analyses except (b) and (c), where Welch’s t-test was performed. ∆ = males, ○ = females. *P < 0.05, **P < 0.01, ****P < 0.0001. No other statistical comparisons are significant unless indicated
Fig. 6
Fig. 6
Vascular degeneration is ameliorated despite elevated CAA. a, b Staining for the blood-derived protein fibrinogen (a) with quantification of percent area covered (b) in the cortex of 10-month-old 5X+AL- or 5X+AL+ mice. Yellow arrow: fibrinogen staining. Scalebar: 100 µm. c, d, Average microhemorrhage number (c) and size (d) via Prussian blue staining. e, f, In vivo assessment of leptomeningeal function measured by percent vasodilatory change from baseline after topical application of vascular smooth muscle cell-dependent molecule (SNAP). Purple arrowheads: Increased dilation. Blue arrowheads: No change in dilation. Data from 9 vessels in 4 mice (5X+AL-) and 6 vessels in 3 mice (5X+AL+). Scalebar: 15 µm. SNAP = S-Nitroso-N-acetylpenicillamine. Data expressed as mean ± SD, student’s t-test (two-sided) performed for all statistical analyses except (c) and (d), where Welch’s t-test was performed. ∆ = males, ○ = females. *P < 0.05, ***P < 0.001. No other statistical comparisons are significant unless indicated

References

    1. Attems J, Jellinger KA, Lintner F. Alzheimer’s disease pathology influences severity and topographical distribution of cerebral amyloid angiopathy. Acta Neuropathol. 2005;110:222–231. doi: 10.1007/s00401-005-1064-y. - DOI - PubMed
    1. Long JM, Holtzman DM. Alzheimer disease: an update on pathobiology and treatment strategies. Cell. 2019;179:312–339. doi: 10.1016/j.cell.2019.09.001. - DOI - PMC - PubMed
    1. Hanseeuw BJ, Betensky RA, Jacobs HIL, Schultz AP, Sepulcre J, Becker JA, Cosio DMO, Farrell M, Quiroz YT, Mormino EC, Buckley RF, Papp KV, Amariglio RA, Dewachter I, Ivanoiu A, Huijbers W, Hedden T, Marshall GA, Chhatwal JP, Rentz DM, Sperling RA, Johnson K. Association of Amyloid and Tau with cognition in preclinical alzheimer disease: a longitudinal study. JAMA Neurol. 2019;76:915–924. doi: 10.1001/jamaneurol.2019.1424. - DOI - PMC - PubMed
    1. Greenberg SM, Bacskai BJ, Hernandez-Guillamon M, Pruzin J, Sperling R, van Veluw SJ. Cerebral amyloid angiopathy and Alzheimer disease — one peptide, two pathways. Nat Rev Neurol. 2020;16:30–42. doi: 10.1038/s41582-019-0281-2. - DOI - PMC - PubMed
    1. Pfeifer LA, White LR, Ross GW, Petrovitch H, Launer LJ. Cerebral amyloid angiopathy and cognitive function: the HAAS autopsy study. Neurology. 2002;58:1629–1634. doi: 10.1212/WNL.58.11.1629. - DOI - PubMed

Publication types