. 2023 Mar 15;11(1):44.
doi: 10.1186/s40478-023-01540-x.

Loss of MBNL1-mediated retrograde BDNF signaling in the myotonic dystrophy brain

Affiliations

Loss of MBNL1-mediated retrograde BDNF signaling in the myotonic dystrophy brain

Pei-Ying Wang et al. Acta Neuropathol Commun. .

Abstract

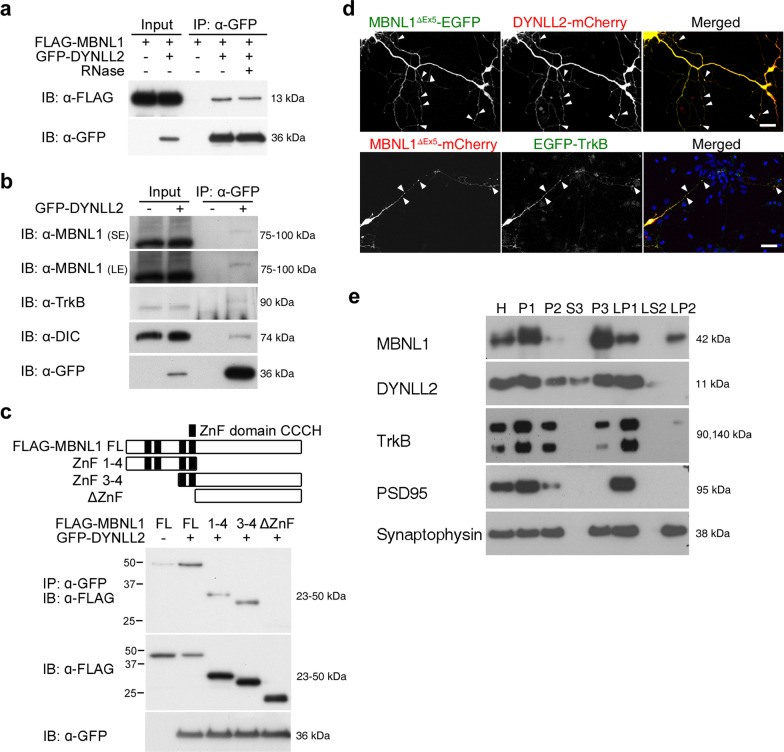
Reduced brain volume including atrophy in grey and white matter is commonly seen in myotonic dystrophy type 1 (DM1). DM1 is caused by an expansion of CTG trinucleotide repeats in the 3' untranslated region (UTR) of the Dystrophia Myotonica Protein Kinase (DMPK) gene. Mutant DMPK mRNA containing expanded CUG RNA (DMPK-CUGexp) sequesters cytoplasmic MBNL1, resulting in morphological impairment. How DMPK-CUGexp and loss of MBNL1 cause histopathological phenotypes in the DM1 brain remains elusive. Here, we show that BDNF-TrkB retrograde transport is impaired in neurons expressing DMPK-CUGexp due to loss of cytoplasmic MBNL1 function. We reveal that mature BDNF protein levels are reduced in the brain of the DM1 mouse model EpA960/CaMKII-Cre. Exogenous BDNF treatment did not rescue impaired neurite outgrowth in neurons expressing DMPK-CUGexp, whereas overexpression of the cytoplasmic MBNL1 isoform in DMPK-CUGexp-expressing neurons improved their responsiveness to exogenous BDNF. We identify dynein light chain LC8-type 2, DYNLL2, as an MBNL1-interacting protein and demonstrate that their interaction is RNA-independent. Using time-lapse imaging, we show that overexpressed MBNL1 and DYNLL2 move along axonal processes together and that MBNL1-knockdown impairs the motility of mCherry-tagged DYNLL2, resulting in a reduced percentage of retrograde DYNLL2 movement. Examination of the distribution of DYNLL2 and activated phospho-TrkB (pTrkB) receptor in EpA960/CaMKII-Cre brains revealed an increase in the postsynaptic membrane fraction (LP1), indicating impaired retrograde transport. Finally, our neuropathological analysis of postmortem DM1 tissue reveals that reduced cytoplasmic MBNL1 expression is associated with an increase in DYNLL2 and activated pTrkB receptor levels in the synaptosomal fraction. Together, our results support that impaired MBNL1-mediated retrograde BDNF-TrkB signaling may contribute to the histopathological phenotypes of DM1.

Keywords: BDNF; DYNLL2; MBNL1; Myotonic dystrophy; Retrograde transport.


Conflict of interest statement

The authors have no competing interests.

Figures

Fig. 1
Fig. 1
Loss of cytoplasmic MBNL1 expression impairs responsiveness to BDNF supplementation in neurons. (a) Examination of BDNF levels by Western blotting analysis in brains from control and EpA960/CaMKII-Cre mice aged one to 1.5 years. Three non-Tg and one EpA960 mice were included as controls. Quantification of BDNF levels, normalized with GAPDH, are shown at right. (b, c) Effect of BDNF treatment on axon development in neurons expressing Dmpk-CUG960 mRNA or upon MBNL1 depletion. (d) Effect of cytoplasmic MBNL1 overexpression on neuronal responsiveness to BDNF treatment. Neurons were transfected with plasmids expressing Dmpk-CUG960 mRNA (DMPK-CUG960) or Dmpk mRNA control (DMPK-CUG0) in (b), with plasmids expressing Mbnl1 shRNA (pLKO-shMbnl1) or control shRNA (pLKO) in (c), or with plasmids expressing Dmpk-CUG960 plus cytoplasmic MBNL1 (FLAG-MBNL1ΔEx5) or Dmpk mRNA control alone in (d). Plasmid expressing GFP was co-transfected to label neuronal morphology. Quantification of total axon length is shown at right. Numbers of neurons (n, from three independent cultured neuronal preparations and transfections) used for quantification are indicated. Data are mean ± SEM. *p < 0.05, **p < 0.01, ***p < 0.001, by Student’s t-test (a) or one-way ANOVA with Holm-Sidak test (b-d). Scale bar: b-d, 100 μm
Fig. 2
Fig. 2
MBNL1 interacts with cytoplasmic DYNLL2 in an RNA-independent manner. (a) Examination of FLAG-MBNL1ΔEx5 and GFP-DYNLL2 binding by immunoprecipitation using an anti-GFP antibody in Neuro2A cells treated with or without RNase treatment. (b) Immunoprecipitation analysis using an anti-GFP antibody to determine binding between endogenous ubiquitinated MBNL1, TrkB and dynein intermediate chain (DIC) in cells expressing GFP-DYNLL2. SE, shorter exposure time. LE, longer exposure time. (c) Identification of the DYNLL2 binding domain on MBNL1. Truncated MBNL1 constructs are illustrated on top. An anti-GFP antibody was used to perform immunoprecipitation. ZnF, zinc-finger domains. (d) Examination of the distribution of cytoplasmic MBNL1 and DYNLL2 (top) or TrkB (bottom) in neurons using plasmids expressing EGFP-tagged or mCherry-tagged MBNL1ΔEx5 with DYNLL2-mCherry or EGFP-TrkB. Arrowheads indicate colocalization region along the neurite. (e) Distribution of MBNL1, TrkB and DYNLL2 proteins in the homogenate (H), nuclei and other large debris (P1), crude synaptosomal fraction (P2), cytosolic soluble fraction (S3), light membrane fraction (P3), synaptosomal membrane fraction (LP1), soluble fraction (LS2), and crude synaptic vesicle fraction (LP2). PSD95 and synaptophysin were used as markers for synaptic compartments. Scale bar: d, 20 μm
Fig. 3
Fig. 3
Loss of MBNL1 impairs DYNLL2 motility in neurons. (a) Time-lapse imaging of the MBNL1 movement in neurons expressing mCherry-tagged MBNL1. A respective kymograph is shown at the bottom. Quantification of the indicated types of movement from a total of 121 neurons is shown at right. (b) Movement of MBNL1ΔEx5 and DYNLL2 in neuronal axons. Anterograde (marked “1”), retrograde (marked “2”) and stationary (marked “3”) movements have been labeled. (c) Time-lapse analysis showing the movement of overexpressed DYNLL2 in MBNL1-depleted neurons. Neurons were transfected with DYNLL2-mCherry, Mbnl1 shRNA (shMbnl1) or control shRNA (pLKO) as indicated. (d) Number of DYNLL2-mCherry movement events categorized into 4 different movement types was listed. Quantification of different DYNLL2-mCherry movements in the control and MBNL1-depleted neurons. Stationary DYNLL2-mCherry is indicated by an arrowhead. Scale bars: a-c, 40 μm. Data are mean ± SEM. *P < 0.05 by Student’s t-test
Fig. 4
Fig. 4
Impaired retrograde transport of BDNF-TrkB signaling in the DM1 mouse brain. (a) Expression levels of DYNLL2 and p-TrkB in the EpA960/CaMKII-Cre and control mouse brains. The control group includes two non-Tg and one EpA960 animals. Relative amounts of DYNLL2 and p-TrkB are normalized according to GAPDH and TrkB, respectively. (b) Representative TrkB immunoreactivity of cortical-layer V neurons in EpA960/CaMKII-Cre mice at age 6 months. Quantification of the intensity of TrkB immunoreactivity in the proximal neurite region. TrkB immunoreactivity in the cell body is indicated by arrowhead. V, layer V neurons. Number of animals (N) and number of neurons (n) in each group is indicated. Data are mean ± SEM. *p < 0.05, **p < 0.01 by Student’s t-test. Scale: 50 μm
Fig. 5
Fig. 5
Impaired retrograde transport of BDNF-TrkB signaling in human postmortem DM1 brain. (a) Examination of cytoplasmic MBNL1 and dendrite integrity in the cerebral cortex of individual with DM1. Neuron expressing MBNL1 was marked with arrowhead. Fragmented dendrites are indicated by arrows (a7). (a8) Enlarged image from the inset in a7 shows the colocalization of MBNL1 with RNA foci in the nucleus. (b) Examination of p-TrkB and DYNLL2 levels in the P2 fraction from postmortem brain tissues of normal and DM1 individuals. HSP90 was detected as a loading control. (c) Representative TrkB immunoreactivity in the cell body of cortical neurons in DM1 brain. Number of human brain (N) and number of neurons (n) in each group is indicated. Data are presented as mean ± SEM. *p < 0.05, **p < 0.01, ***P < 0.001 by Student’s t-test. Scale: a1-7, 50 μm; a8, 10 μm; c, 20 μm

References

    1. Martinello F, Piazza A, Pastorello E, Angelini C, Trevisan C. Clinical and neuroimaging study of central nervous system in congenital myotonic dystrophy. J Neurol. 1999;246:186–192. doi: 10.1007/s004150050332. - DOI - PubMed
    1. Meola G, Sansone V. Cerebral involvement in myotonic dystrophies. Muscle Nerve. 2007;36:294–306. doi: 10.1002/mus.20800. - DOI - PubMed
    1. Tanabe Y, Iai M, Tamai K, Fujimoto N, Sugita K. Neuroradiological findings in children with congenital myotonic dystrophy. Acta Paediatr. 1992;81:613–617. doi: 10.1111/j.1651-2227.1992.tb12312.x. - DOI - PubMed
    1. Hashimoto T, Tayama M, Miyazaki M, Murakawa K, Kawai H, Nishitani H, et al. Neuroimaging study of myotonic dystrophy. I. Magnetic resonance imaging of the brain. Brain Dev. 1995;17:24–7. doi: 10.1016/0387-7604(94)00096-G. - DOI - PubMed
    1. Ranum LP, Cooper TA. RNA-mediated neuromuscular disorders. Annu Rev Neurosci. 2006;29:259–277. doi: 10.1146/annurev.neuro.29.051605.113014. - DOI - PubMed

Publication types

MeSH terms

LinkOut - more resources