. 2022 Jun 14;2(6):434-446.
doi: 10.1158/2767-9764.CRC-21-0100. eCollection 2022 Jun.

Proteome Analysis of Pancreatic Tumors Implicates Extracellular Matrix in Patient Outcome

Affiliations

Proteome Analysis of Pancreatic Tumors Implicates Extracellular Matrix in Patient Outcome

Laxmi Silwal-Pandit et al. Cancer Res Commun. .

Abstract

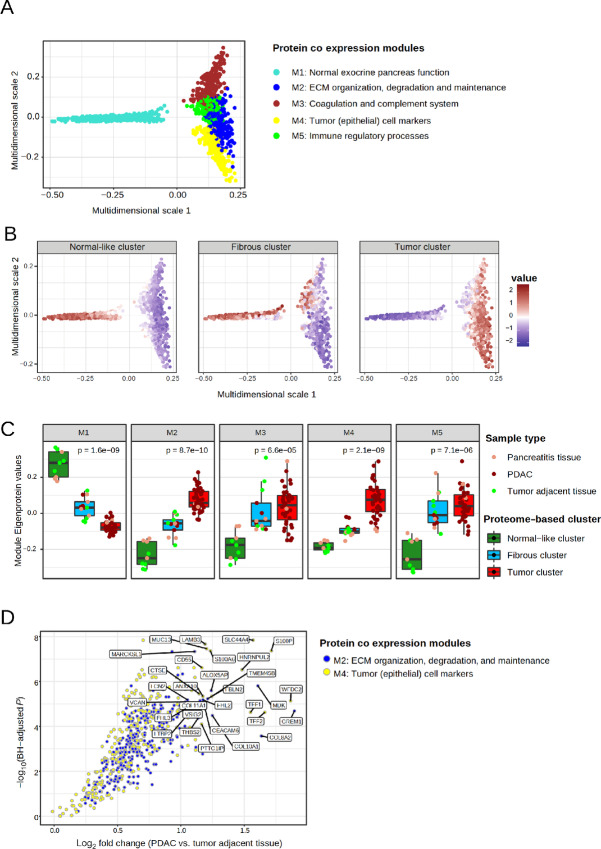
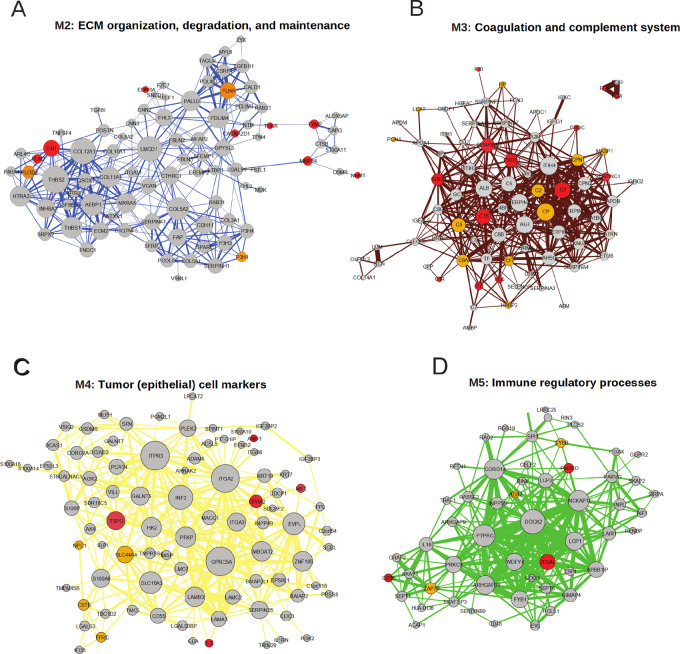
Pancreatic cancer remains a disease with unmet clinical needs and inadequate diagnostic, prognostic, and predictive biomarkers. In-depth characterization of the disease proteome is limited. This study thus aims to define and describe protein networks underlying pancreatic cancer and identify protein centric subtypes with clinical relevance. Mass spectrometry-based proteomics was used to identify and quantify the proteome in tumor tissue, tumor-adjacent tissue, and patient-derived xenografts (PDX)-derived cell lines from patients with pancreatic cancer, and tissues from patients with chronic pancreatitis. We identified, quantified, and characterized 11,634 proteins from 72 pancreatic tissue samples. Network focused analysis of the proteomics data led to identification of a tumor epithelium-specific module and an extracellular matrix (ECM)-associated module that discriminated pancreatic tumor tissue from both tumor adjacent tissue and pancreatitis tissue. On the basis of the ECM module, we defined an ECM-high and an ECM-low subgroup, where the ECM-high subgroup was associated with poor prognosis (median survival months: 15.3 vs. 22.9 months; log-rank test, P = 0.02). The ECM-high tumors were characterized by elevated epithelial-mesenchymal transition and glycolytic activities, and low oxidative phosphorylation, E2F, and DNA repair pathway activities. This study offers novel insights into the protein network underlying pancreatic cancer opening up for proteome precision medicine development.

Significance: Pancreatic cancer lacks reliable biomarkers for prognostication and treatment of patients. We analyzed the proteome of pancreatic tumors, nonmalignant tissues of the pancreas and PDX-derived cell lines, and identified proteins that discriminate between patients with good and poor survival. The proteomics data also unraveled potential novel drug targets.


Conflict of interest statement

J. Lehtio reports other from Fenomark Diagnostics outside the submitted work; and J. Lehtio is involved in Cancer Core Europe BoB trial financed by Roche (not related to this work). No other disclosures were reported.

Figures

FIGURE 1
FIGURE 1
The pancreas proteome. A, The pancreas proteome analyses workflow. B, Hierarchical clustering of the proteins mapping to 7,699 gene symbols quantified in all 72 samples. C, Principal component analysis plot of the proteome data. Each dot represents a sample and each color represents the type of sample.
FIGURE 2
FIGURE 2
Coexpressed protein modules identified by WGCNA. A, Cluster dendrogram showing the corresponding protein dendrograms and module assignment of the proteins. Representative enrichments in each module are presented below (see Supplementary Tables S5–S9 for all enrichments). B, Heatmap of correlation between Module Eigenproteins illustrating (dis)similarities between modules. C, Heatmap of Topological Overlap Matrix illustrating higher intra-connectedness between proteins of the same modules. Rows and columns correspond to proteins, dark colors represent low topological overlap (low intra-connectedness), and progressively lighter orange and yellow colors represent higher topological overlap (high intra-connectedness).
FIGURE 3
FIGURE 3
MDS of the TOM dissimilarity matrix and association of the protein modules to different tissues of the pancreas. A, MDS plot where each dot denotes a protein and the color represents the module the protein belongs to. B, MDS plot stratified by proteome-based clusters. Each protein is colored by the average expression in the proteome-based clusters (red, high expression; purple, low expression). C, Association of the coexpression protein modules (M1-M5) to the proteome-based clusters. Color of the dot indicate sample type. The P value denotes significance by Kruskal–Wallis test. D, Volcano plot illustrating differential protein abundances in PDAC versus tumor adjacent tissue. The log2 fold change in protein abundance is represented on the x-axis and Benjamini–Hochberg adjusted P values (on negative log scale) is shown on the y-axis. Each dot represents a protein and is colored by the coexpression module that the protein belongs to. The 15 most significant proteins of M2 and M4 are labeled.
FIGURE 4
FIGURE 4
M2 module with enriched pathways, relation to Moffitt transcriptomic subtypes and patient outcome. A, Consensus clustered heatmap of top 50 proteins (based on correlation to Module Eigenprotein) of module M2 enriched for ECM proteins; patients get stratified into two clusters. B, Kaplan–Meier curve showing overall survival trends in the protein-based ECM subgroups C. Enriched pathways in the ECM-high versus ECM-low subtypes.
FIGURE 5
FIGURE 5
Differences between the PDAC and the pancreatitis proteome. A, Boxplots illustrating the expression of Module Eigenproteins in PDAC versus pancreatitis samples. B, Volcano plot illustrating differential protein abundances in PDAC versus pancreatitis samples. The fold change (log2) in protein abundance is represented on the x-axis and Benjamini–Hochberg adjusted P values (on negative log scale) is on the y-axis. Each dot denotes a protein, colored by the coexpression module the protein belongs to. The top 10 significant proteins of M1, M2, and M4 are labeled.
FIGURE 6
FIGURE 6
Protein network of the protein modules including proteins with intercorrelations > 0.3 and correlation to Module Eigenprotein > 0.7. The size of the nodes represents degrees, and thickness of the edges represents edge weight. Targets of FDA-approved drugs (all indications) within each module are marked red and potential targets are marked orange. A, Module M2. B, Module M3. C, Module M4. D, Module M5. String protein networks corresponding to M2–M5 are represented in Supplementary Figs. S8–S11, respectively. M1 is excluded from the analysis due its specific association to the normal pancreas function and its low expression in the tumor tissue which makes it less relevant for drug targets.

References

    1. Siegel RL, Miller KD, Jemal A. Cancer statistics, 2020. CA Cancer J Clin 2020;70:7–30. - PubMed
    1. Waddell N, Pajic M, Patch A-M, Chang DK, Kassahn KS, Bailey P, et al. . Whole genomes redefine the mutational landscape of pancreatic cancer. Nature 2015;518:495–501. - PMC - PubMed
    1. Bailey P, Chang DK, Nones K, Johns AL, Patch AM, Gingras MC, et al. . Genomic analyses identify molecular subtypes of pancreatic cancer. Nature 2016;531:47–52. - PubMed
    1. Raphael BJ, Hruban RH, Aguirre AJ, Moffitt RA, Yeh JJ, Stewart C, et al. . Integrated Genomic Characterization of Pancreatic Ductal Adenocarcinoma. Cancer Cell 2017;32:185–203. - PMC - PubMed
    1. Collisson EA, Sadanandam A, Olson P, Gibb WJ, Truitt M, Gu S, et al. . Subtypes of pancreatic ductal adenocarcinoma and their differing responses to therapy. Nat Med 2011;17:500–3. - PMC - PubMed

Publication types