. 2023 Feb 27:14:1058582.
doi: 10.3389/fgene.2023.1058582. eCollection 2023.

Identification and validation of metabolism-related hub genes in idiopathic pulmonary fibrosis

Affiliations

Identification and validation of metabolism-related hub genes in idiopathic pulmonary fibrosis

Youjie Zeng et al. Front Genet. .

Abstract

Background: Idiopathic pulmonary fibrosis (IPF) is a fatal and irreversible interstitial lung disease. The specific mechanisms involved in the pathogenesis of IPF are not fully understood, while metabolic dysregulation has recently been demonstrated to contribute to IPF. This study aims to identify key metabolism-related genes involved in the progression of IPF, providing new insights into the pathogenesis of IPF. Methods: We downloaded four datasets (GSE32537, GSE110147, GSE150910, and GSE92592) from the Gene Expression Omnibus (GEO) database and identified differentially expressed metabolism-related genes (DEMRGs) in lung tissues of IPF by comprehensive analysis. Then, we performed GO, KEGG, and Reactome enrichment analyses of the DEMRGs. Subsequently, key DEMRGs were identified by machine-learning algorithms. Next, miRNAs regulating these key DEMRGs were predicted by integrating the GSE32538 (IPF miRNA dataset) and the miRWalk database. The Cytoscape software was used to visualize miRNA-mRNA regulatory networks. In addition, the relative levels of immune cells were assessed by the CIBERSORT algorithm, and the correlation of key DEMRGs with immune cells was calculated. Finally, the mRNA expression of the key DEMRGs was validated in two external independent datasets and an in vivo experiment. Results: A total of 101 DEMRGs (51 upregulated and 50 downregulated) were identified. Six key DEMRGs (ENPP3, ENTPD1, GPX3, PDE7B, PNMT, and POLR3H) were further identified using two machine-learning algorithms (LASSO and SVM-RFE). In the lung tissue of IPF patients, the expression levels of ENPP3, ENTPD1, and PDE7B were upregulated, and the expression levels of GPX3, PNMT, and POLR3H were downregulated. In addition, the miRNA-mRNA regulatory network of key DEMRGs was constructed. Then, the expression levels of key DEMRGs were validated in two independent external datasets (GSE53845 and GSE213001). Finally, we verified the key DEMRGs in the lung tissue of bleomycin-induced pulmonary fibrosis mice by qRT-PCR. Conclusion: Our study identified key metabolism-related genes that are differentially expressed in the lung tissue of IPF patients. Our study emphasizes the critical role of metabolic dysregulation in IPF, offers potential therapeutic targets, and provides new insights for future studies.

Keywords: IPF; bioinformatics; biomarker; differentially expressed genes; gene expression omnibus; hub genes; metabolic; metabolism.


Figures

FIGURE 1
FIGURE 1
The overall flow chart of this study.
FIGURE 2
FIGURE 2
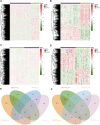
Identification of DEMRGs in IPF. (A) Heatmap of DEMRGs in GSE32537 (203 upregulated and 336 downregulated DEMRGs). (B) Heatmap of DEMRGs in GSE110147 (279 upregulated and 402 downregulated DEMRGs). (C) Heatmap of DEMRGs in GSE150910 (263 upregulated and 231 downregulated DEMRGs). (D) Heatmap of DEMRGs in GSE92592 (267 upregulated and 211 downregulated DEMRGs). (E) The Venn diagram identified fifty-one commonly upregulated DEMRGs. (F) The Venn diagram identified fifty commonly downregulated DEMRGs.
FIGURE 3
FIGURE 3
Functional enrichment analysis of DEMRGs. The dot size indicates the number of DEMRGs enriched to the corresponding term, and the dot color indicates the enrichment significance of the corresponding term. (A) The top 10 significantly enriched terms for Gene ontology biological process. (B) The top 10 significantly enriched terms for Gene ontology cellular component (C) The top 10 significantly enriched terms for Gene ontology molecular function. (D) The top 10 significantly enriched terms for the KEGG pathway. (E) The top 10 significantly enriched terms for the Reactome pathway.
FIGURE 4
FIGURE 4
Identification of IPF key DEMRGs by using two machine-learning algorithms. (A) Twenty-three gene signatures were extracted via LASSO regression. (B) Ten gene signatures were extracted via SVM-RFE. (C) The Venn diagram identified six overlapping DEMRGs shared by LASSO and SVM-RFE. Therefore, the six overlapping DEMRGs were identified as key DEMRGs.
FIGURE 5
FIGURE 5
Identification of miRNA-mRNA regulatory networks of Key DEMRGs. (A) Heatmap of DEmiRNAs in GSE32538 (59 upregulated and 103 downregulated DEmiRNAs). (B) Venn diagram showing the intersecting miRNAs between DEmiRNAs and the predicted miRNAs. (C) The metabolism-related miRNA-mRNA regulatory network contained 60 DEmiRNAs and 5 DEMRGs. Red nodes represent upregulated key DEMRGs or DEmiRNAs in IPF lung tissue, and green nodes represent downregulated key DEMRGs or DEmiRNAs in IPF lung tissue.
FIGURE 6
FIGURE 6
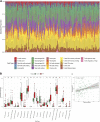
Immune cell infiltration in IPF. (A) Histogram of the proportion of each type of immune cell in the lung tissue of 119 IPF patients and 50 controls in the GSE32537 dataset. (B) Boxplot of the relative expression of each immune cell subtype between the IPF patients and healthy controls. (C) M2 macrophage expression was positively correlated with the expression level of ENPP3. *p < 0.05; **p < 0.01; ***p < 0.001; ****p < 0.0001.
FIGURE 7
FIGURE 7
The expression levels of six key DEMRGs were validated in two independent external datasets (GSE53845 and GSE213001): ENPP3, ENTPD1, and PDE7B were significantly upregulated in IPF lung tissue (p < 0.05), while GPX3, PNMT, and POLR3H were significantly downregulated in IPF lung tissue (p < 0.05).
FIGURE 8
FIGURE 8
Validation of Key DEMRGs by qRT-PCR. Values represent means ± SD, n = 6/group. *p < 0.05; **p < 0.01; ***p < 0.001.

References

    1. Bargagli E., Refini R. M., D'Alessandro M., Bergantini L., Cameli P., Vantaggiato L., et al. (2020). Metabolic dysregulation in idiopathic pulmonary fibrosis. Int. J. Mol. Sci. 21, 5663. 10.3390/ijms21165663 - DOI - PMC - PubMed
    1. Botta M., Audano M., Sahebkar A., Sirtori C. R., Mitro N., Ruscica M. 2018. PPAR agonists and metabolic syndrome: An established role? Int. J. Mol. Sci., 19, 1197, 10.3390/ijms19041197 - DOI - PMC - PubMed
    1. Cai Y., Sugimoto C., Arainga M., Alvarez X., Didier E. S., Kuroda M. J. 2014. In vivo characterization of alveolar and interstitial lung macrophages in rhesus macaques: Implications for understanding lung disease in humans. J. Immunol, 192, 2821, 10.4049/jimmunol.1302269 - DOI - PMC - PubMed
    1. Cauwels A., Rogge E., Vandendriessche B., Shiva S., Brouckaert P. (2014). Extracellular ATP drives systemic inflammation, tissue damage and mortality. Cell Death Dis. 5, e1102. 10.1038/cddis.2014.70 - DOI - PMC - PubMed
    1. Cho S. J., Moon J. S., Lee C. M., Choi A. M., Stout-Delgado H. W. 2017. Glucose transporter 1-dependent glycolysis is increased during aging-related lung fibrosis, and phloretin inhibits lung fibrosis. Am. J. Respir. Cell Mol. Biol., 56, 521, 10.1165/rcmb.2016-0225OC - DOI - PMC - PubMed