. 2023 Mar 28;42(3):112255.
doi: 10.1016/j.celrep.2023.112255. Epub 2023 Mar 14.

Neonatal SHIV infection in rhesus macaques elicited heterologous HIV-1-neutralizing antibodies

Affiliations

Neonatal SHIV infection in rhesus macaques elicited heterologous HIV-1-neutralizing antibodies

Bhavna Hora et al. Cell Rep. .

Abstract

Infants and children infected with human immunodeficiency virus (HIV)-1 have been shown to develop neutralizing antibodies (nAbs) against heterologous HIV-1 strains, characteristic of broadly nAbs (bnAbs). Thus, having a neonatal model for the induction of heterologous HIV-1 nAbs may provide insights into the mechanisms of neonatal bnAb development. Here, we describe a neonatal model for heterologous HIV-1 nAb induction in pathogenic simian-HIV (SHIV)-infected rhesus macaques (RMs). Viral envelope (env) evolution showed mutations at multiple sites, including nAb epitopes. All 13 RMs generated plasma autologous HIV-1 nAbs. However, 8/13 (62%) RMs generated heterologous HIV-1 nAbs with increasing potency over time, albeit with limited breadth, and mapped to multiple nAb epitopes, suggestive of a polyclonal response. Moreover, plasma heterologous HIV-1 nAb development was associated with antigen-specific, lymph-node-derived germinal center activity. We define a neonatal model for heterologous HIV-1 nAb induction that may inform future pediatric HIV-1 vaccines for bnAb induction in infants and children.

Keywords: CP: Immunology; HIV-1 Env glycosylation; HIV-1 env evolution; autologous SHIV NAbs; germinal center activity; neonatal SHIV infection; neonatal heterologous NAbs; neonatal immunity; transcriptomics.


Conflict of interest statement

Declaration of interests The authors declare no competing interests.

Figures

Figure 1.
Figure 1.. Study design and viral dynamics
(A) Sampling timeline following SHIV-infection in neonatal rhesus macaques (N = 13). Peripheral blood (bimonthly) and lymph node tissue sections (6 month intervals) were collected over time as shown. The sampling within the first 4 months of SHIV challenge varied across animals due to technical and biological variables. (B) Information on the cohort of neonatal rhesus macaques (RMs) studied including their sex, genotype for SIV-restrictive Mamu alleles (negative [−] and positive [+]), and viral inoculum used to establish infection at the indicated time point post-birth. (C) Viral load dynamics. SIV gag RNA was measured via qPCR to assess plasma viral loads and was reported as RNA copies/mL (log10). Each symbol represents an individual animal; animals with persistent high viral loads of ≥ ~103 RNA copies/mL are shown in colored circles, whereas animals with lower viral loads below 103 RNA copies/mL over time are shown in black symbols. The horizontal dash line represents the limit of detection of the assay (1.79 RNA copies/mL).
Figure 2.
Figure 2.. Longitudinal HIV-1 env sequencing in neonatal SHIV infection
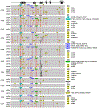
Env sequence evolution visualized using a pixel plot of amino acid alignments of sequences obtained from eleven RMs at different time points. Env sequences were amplified via single-genome sequencing (SGS) of plasma vRNA in samples where vRNA copies were ≥103/mL. For each animal, 30–60 sequences were generated from each time point (M, months after SHIV infection). The transmitted/founder (T/F) CH848 1017.DT.E169K sequence is depicted schematically at the top. Amino acid substitutions and indels (insertions or deletions) relative to the T/F strain are colored red and black, respectively. Tags indicate amino positions (HXB2 numbering) of the mutations that reached 75% frequency of T/F loss in at least two animals.
Figure 3.
Figure 3.. Mutational patterns in HIV-1 Env nAb epitopes following SHIV infection of neonatal RMs
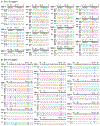
(A) SGS (N, number of sequences; M, months after SHIV infection) in SHIV-infected RMs showed selection and fixation of mutations in strands B and C of the V2 region. Mutations at positions 166, 167, 168, 169, 170, 171, and 172 are colored cyan, dark blue, purple, red, orange, green, and pink, respectively. (B) Sequential V3 loop sequences showed selection and fixation of mutations in the GDIR motif. Lysine (K)-to-arginine (R) reversion at position 327 is colored in blue. Mutations at positions 325 and 326 are highlighted in dark red.
Figure 4.
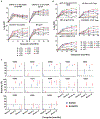
Figure 4.. Binding profile of plasma antibodies elicited by SHIV infection in neonatal RMs
Longitudinal plasma spanning 24 months post-SHIV infection in RMs infected soon after birth were tested for binding autologous (CH848 10.17 DT.E169K) SOSIP trimer and gp120 monomer and for heterologous M.CON-S V3 peptide and MN gp41 (A), as well as for heterologous V1V2 peptides (B). Binding was measured in ELISA, and the binding titers were reported as log AUC. The color code per animal ID is described in Figure 1. Due to limited sample availability in newborn RMs, plasma from HIV-1− dams corresponding to each neonate RM was used as month 0 sample per animal in ELISAs. (C) Competition ELISA of longitudinal plasma against B-PG9 and B-DH270 binding to CH848 10.17 DT.E169K gp120. Each sample was run in duplicates or triplicates in two separate assays. Shown is the average percentage of blocking and standard deviation (error bars) of plasma samples in the presence of B-PG9 or B-DH270 relative to binding by B-PG9 or B-DH270 alone.
Figure 5.
Figure 5.. Neutralization profile of plasma antibodies elicited by SHIV infection in neonatal RMs
(A) Longitudinal plasma Abs spanning 24 months of SHIV infection in RMs infected soon after birth were tested for neutralization of autologous SHIV CH848 10.17 DT.E169K in TZM-bl cells. Neutralization titer was measured as log ID50 (reciprocal dilution), and error bars indicate geometric mean and standard deviation. Statistics (Mann-Whitney test, GraphPad Prism 9.2.0): *p < 0.05 and ***p < 0.001. (B) Plasma at 6–8 and 18 months post-SHIV infection in all RMs were tested for neutralization of autologous SHIV CH848 10.17 DT.E169K (−V1 glycans), black bars, and CH848 10.17 E169K (+V1 glycans), gray bars, in TZM-bl cells. Neutralization titer was measured as log ID50 (reciprocal dilution). (C) Tally of heterologous HIV-1 strains with increasing neutralization titers over time in eleven RMs where we detected heterologous plasma neutralizing activity. Neutralization breadth was reported as a percentage of the viruses tested by longitudinal samples per animal that had increasing neutralizing titers over time. (D) Neutralization curves of plasma from representative RMs with maximal neutralization titers against heterologous tier 2 HIV-1 strains and murine leukemia virus (MuLV). The percentage of viral quasi-species neutralized per virus by serially diluted plasma samples is shown, and the dash lines indicate 0% and 50% neutralization points; the latter may be used to determine plasma dilution that achieves optimal neutralization. (E) Plasma from representative RMs with highest neutralization titers against heterologous tier 2 HIV-1 strains were tested for neutralization of HIV-1 25710 (top panel), SHIV ZM233 (middle panel), and HIV-1 X1632 (bottom panel) bearing wild-type (WT) and mutant Envs. Mutations were created in the V2 region of nAb epitopes. The dotted horizontal line is used to determine the plasma dilution that can achieve 50% inhibition of viral infection. (F) Plasma from representative RMs with highest neutralization titers against heterologous tier 2 HIV-1 25710 was tested for neutralization of HIV-1 25710 bearing WT and mutant Envs with glycan deletions (N332A and N280D) and insertions (V295N) in bnAb epitopes. Neutralization curves showing plasma sensitivity to WT and mutant viruses are shown.
Figure 6.
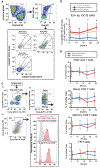
Figure 6.. GC activity in SHIV-infected neonatal RMs
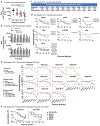
(A) Flow cytometric gating strategy to identify GC B cells (CD20+Bcl6+Ki67+), proliferating non-GC B cells (CD20+Bcl6−Ki67+), and resting B cells (CD20+Bcl6−Ki67−) in LNs. Env-specific cells in each B cell compartment were identified with fluorochrome-conjugated baits representing the autologous Env (CH848 10.17 DT.E169K) and a similar Env strain with a V3-glycan mutation (CH848 10.17 DT_N332A) to limit detection of non-specific B cells. (B) Frequencies of Env-specific GC B cells in neonate RM bnAbers versus non-bnAbers (blue); the gray line shows the average of all animals. Each dot represents the mean ± SD frequency of Env-specific GC B cells as a percentage of total B cells for that time point. *p < 0.05, Wilcoxon exact test, comparing bnAb versus non-bnAb RM groups. (C) Gating strategy for flow cytometric enumeration of total CD4 T cells, naive CD4 T cells, memory CD4 T cells, and TFH cells. (D) Frequencies of total CD4 T cells, naive CD4 T cells, memory CD4 T cells, and TFH cells (as a percentage of viable lymph node cells) in RM bnAbers (red) versus non-bnAbers (blue). The mean ± SD frequency is shown for each time point.
Figure 7.
Figure 7.. Transcriptomics of peripheral blood cells in SHIV-infected neonatal RMs
(A) Uniform manifold approximation and projection (UMAP) visualization of single cells that clustered based on gene expression profiles from total PBMCs of nine SHIV-infected and three SHIV-naive RMs. Each dot represents a single cell in each of 12 clusters (color coded). (B) Frequency of cells per cluster from one of three groups of RMs: (1) heterologous neutralization (SHIV+); (2) autologous neutralization (SHIV+); and (3) SHIV naive. The cluster number and cells per cluster are shown below each bar on the graph. Bars are color coded based on RM groupings 1–3 described above. (C) Immune cell subsets inferred by SingleR based on transcriptome sequencing. The 10 cell subsets were color coded and labeled on the UMAP. The number of cells studied is indicated in brackets next to each cell type/subset. (D) Frequency of cell subsets in RMs from three groups (1–3) described in (B). The number of cells studied is indicated in brackets next to each cell subset. Bars are color coded based on cell subsets. (E) Venn diagram showing number of differentially expressed genes (DEGs) in group 1 versus 3 and group 2 versus 3 of PBMCs from RMs. (F) Heatmap showing the top 20 DEGs that overlapped between the comparisons shown in (E).

References

    1. Haynes BF, and Burton DR (2017). Developing an hiv vaccine. Science 355, 1129–1130. - PMC - PubMed
    1. Haynes BF, Burton DR, and Mascola JR (2019). Multiple roles for hiv broadly neutralizing antibodies. Sci. Transl. Med 11, eaaz2686. - PMC - PubMed
    1. Williams WB, Wiehe K, Saunders KO, and Haynes BF (2021). Strategies for induction of hiv-1 envelope-reactive broadly neutralizing antibodies. J. Int. AIDS Soc 24, e25831. - PMC - PubMed
    1. Goo L, Chohan V, Nduati R, and Overbaugh J (2014). Early development of broadly neutralizing antibodies in hiv-1-infected infants. Nat. Med 20, 655–658. - PMC - PubMed
    1. Muenchhoff M, Adland E, Karimanzira O, Crowther C, Pace M, Csala A, Leitman E, Moonsamy A, McGregor C, Hurst J, et al. (2016). Nonprogressing hiv-infected children share fundamental immunological features of nonpathogenic siv infection. Sci. Transl. Med 8, 358ra125. 358ra125. - PMC - PubMed

Publication types