. 2023 Mar 15;111(6):839-856.e5.
doi: 10.1016/j.neuron.2023.02.023.

Subcellular mRNA localization and local translation of Arhgap11a in radial glial progenitors regulates cortical development

Affiliations

Subcellular mRNA localization and local translation of Arhgap11a in radial glial progenitors regulates cortical development

Louis-Jan Pilaz et al. Neuron. .

Abstract

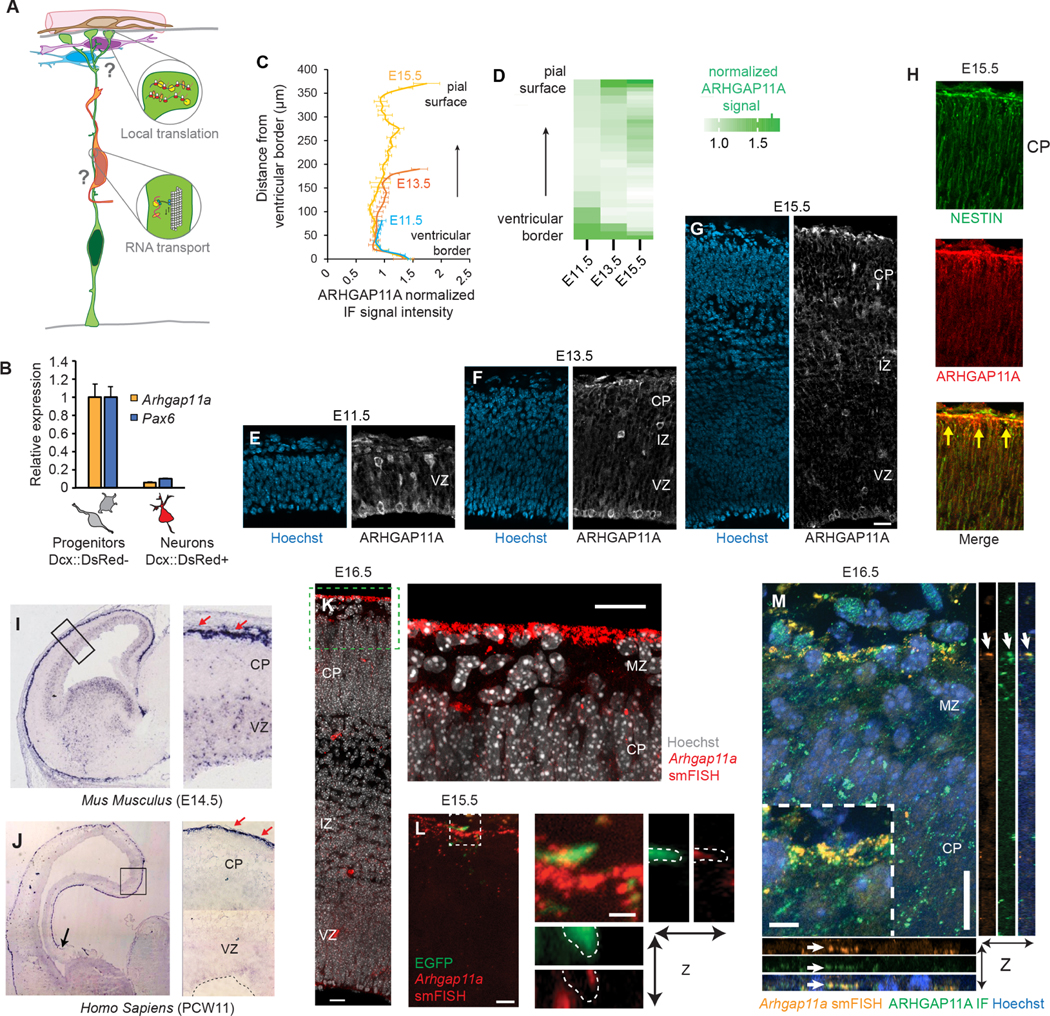
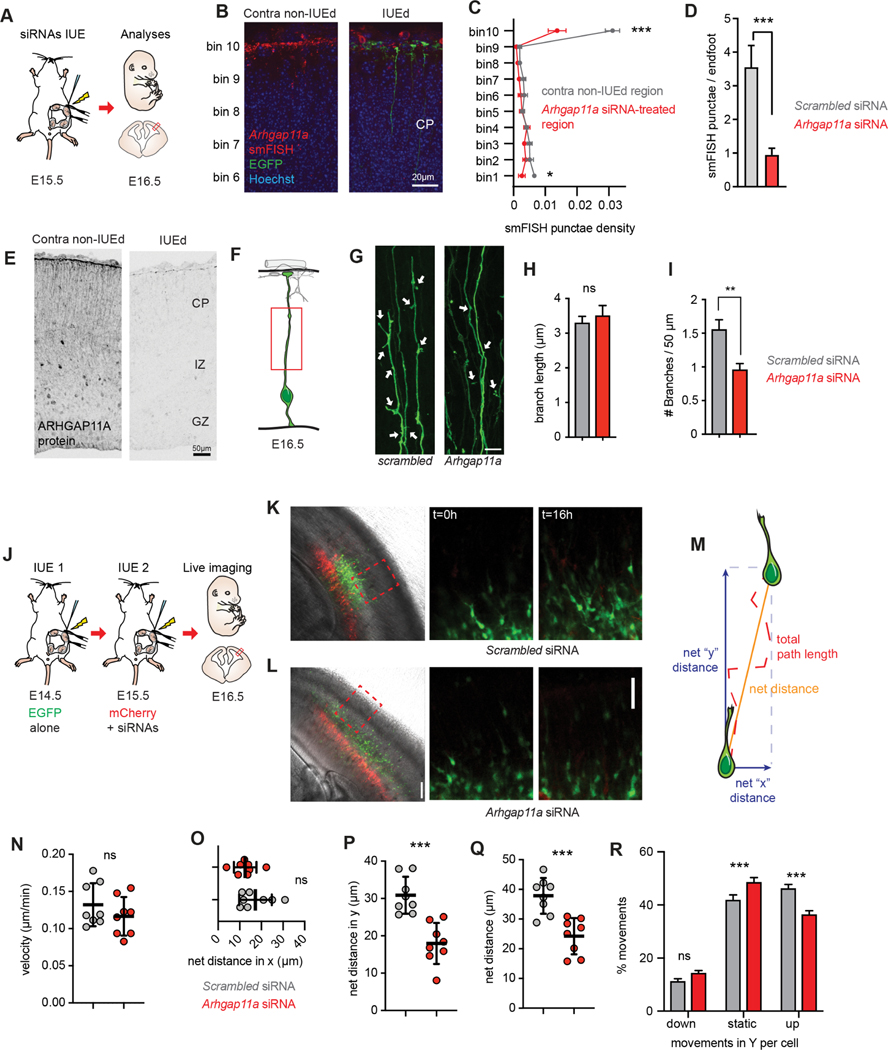
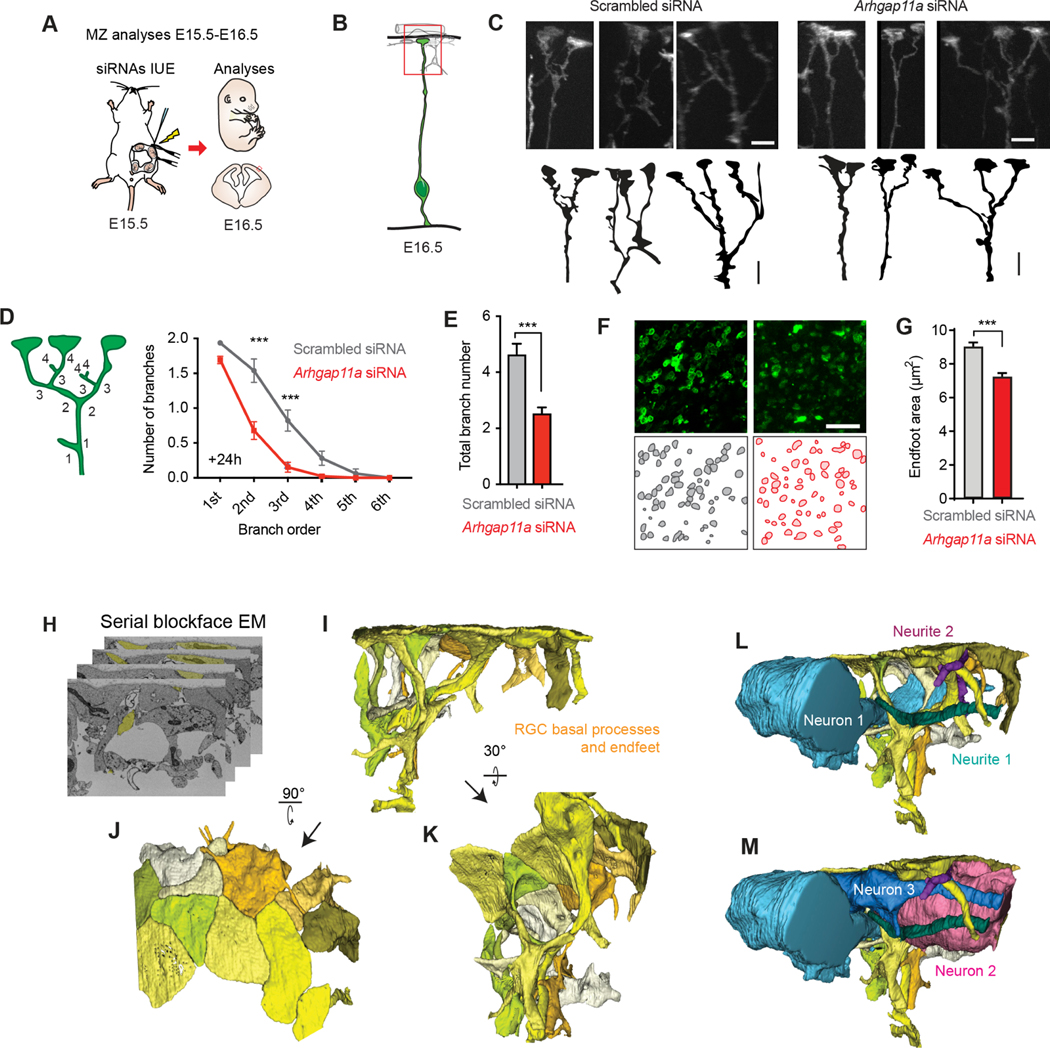
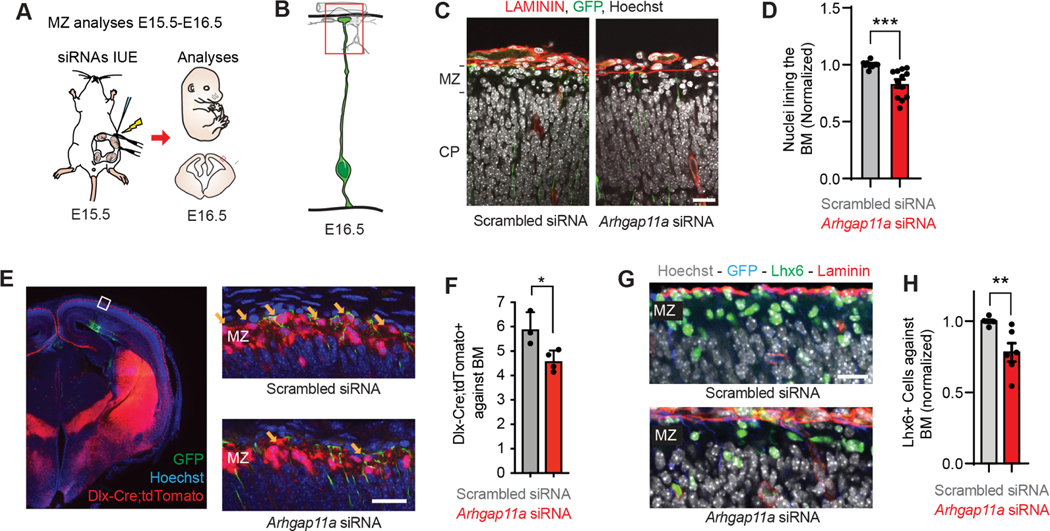
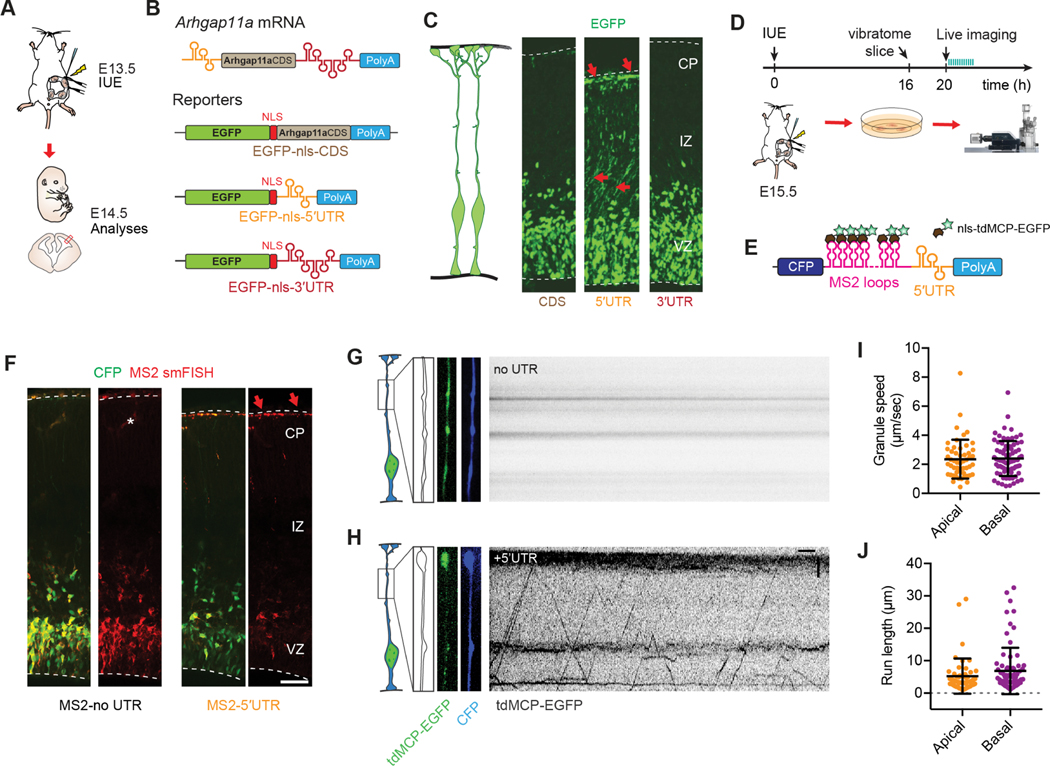
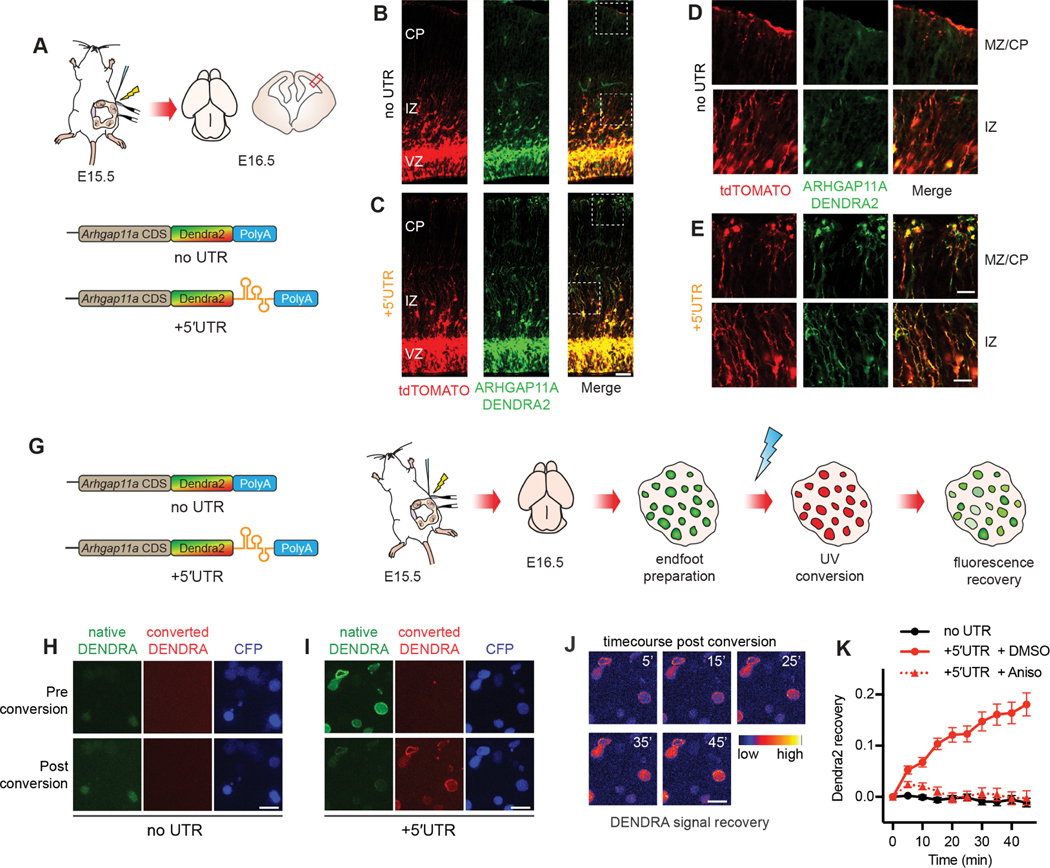
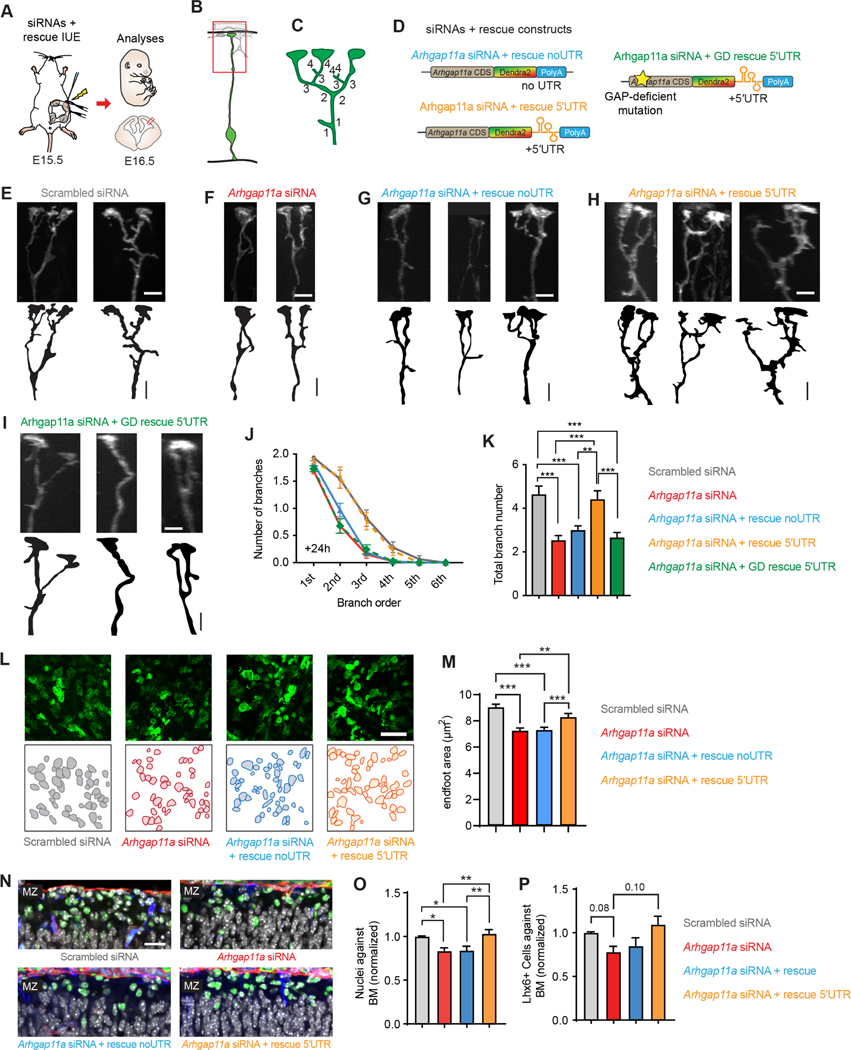
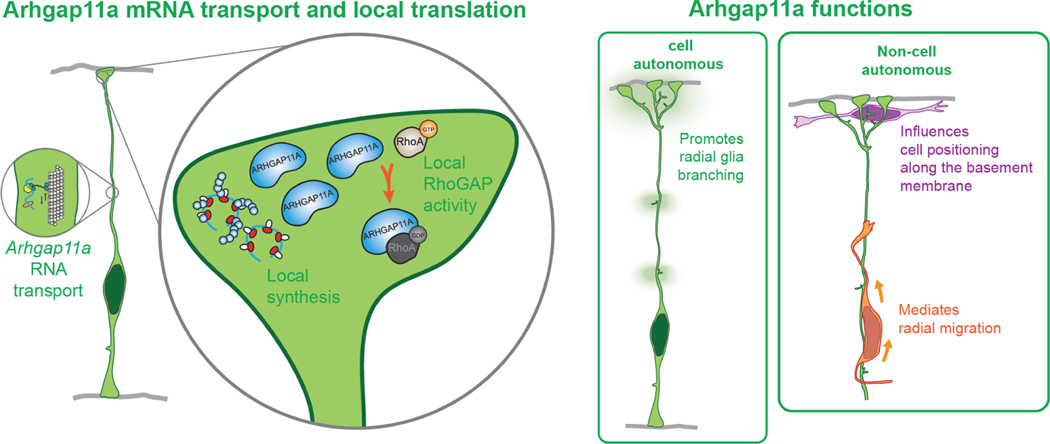
mRNA localization and local translation enable exquisite spatial and temporal control of gene expression, particularly in polarized, elongated cells. These features are especially prominent in radial glial cells (RGCs), which are neural and glial precursors of the developing cerebral cortex and scaffolds for migrating neurons. Yet the mechanisms by which subcellular RGC compartments accomplish their diverse functions are poorly understood. Here, we demonstrate that mRNA localization and local translation of the RhoGAP ARHGAP11A in the basal endfeet of RGCs control their morphology and mediate neuronal positioning. Arhgap11a transcript and protein exhibit conserved localization to RGC basal structures in mice and humans, conferred by the 5' UTR. Proper RGC morphology relies upon active Arhgap11a mRNA transport and localization to the basal endfeet, where ARHGAP11A is locally synthesized. This translation is essential for positioning interneurons at the basement membrane. Thus, local translation spatially and acutely activates Rho signaling in RGCs to compartmentalize neural progenitor functions.

Keywords: Arhgap11a; RhoGAP; cortical development; interneuron positioning neuronal migration; local translation; mRNA localization; mRNA transport; mouse; radial glial endfeet.


Conflict of interest statement

Declaration of interests The authors declare no competing interests.

Figures

Figure 1.
Figure 1.. Subcellular localization of Arhgap11a mRNA and protein to RGC basal processes and endfeet during cortical development
(A) Cartoon of a radial glial progenitor (RGC, green) with mRNA transport along the basal process and local translation in endfeet. Question marks reflect goal of the present study: what is the role of mRNA subcellular localization and translation in RGCs and for positioning of excitatory neurons (orange), migratory interneurons (purple), and cajal-retzius neurons (blue)? (B) qPCR analyses of Arhgap11a mRNA levels in E14.5 sorted embryonic cortical cells. (n=4 brains, 3 technical replicates) (C,D) Quantification of ARHGAP11A Immunofluorescence in E11.5, E13.5 and E15.5 brains. (E-G) Immunofluorescence of ARHGAP11A (grey) and Hoechst (blue) in E11.5 (E), E13.5 (F) and E15.5 (G) brains. (H) Immunofluorescence of ARHGAP11A (red) at E15.5, showing expression in NESTIN positive RGCs (green) with overlap (yellow signal) in basal process and endfeet at the pial surface (yellow arrows). (I,J) In situ hybridization of Arhgap11a mRNA (purple signal), showing strong enrichment at the pia where RGC basal endfeet reside (red arrows) at E14.5 (I) and in GW11 human fetal brains (J). (K,L) smFISH in situ hybridization depicting Arhgap11a mRNA (red) at the pia at E15.5 (K) and in EGFP+ RGC basal endfeet (brains electroporated one day earlier) (L). Right panels, magnified areas highlighted in left panels (K, L) and maximum intensity projections of a z-stack (L). (M) smFISH and immunofluorescence targeting Arhgap11a mRNA (red) and protein (green), respectively highlights colocalization (arrows) in RGC basal endfeet. VZ: ventricular zone, CP: cortical plate, IZ: intermediate zone, smFISH: single molecule fluorescent in situ hybridization. Scale bars: C-E, 20 μm; I, 20 μm; J, left panel: 5 μm, right panel: 1μm; M, 20 μm.
Figure 2.
Figure 2.. Arhgap11a controls RGC basal process morphology and non-cell autonomously controls radial migration of excitatory neurons
(A) Schematic overview of the experiments in (B-I). (B-E) Arhgap11a mRNA is depleted from endfeet in the Arhgap11a siRNA electroporated region (IUE, green), evidenced by smFISH (red) (B) and immunofluorescence (E). (C) Binned quantification of Arhgap11a smFISH punctae in electroporated and contralateral non-electroporated regions. Bin 1 is apical lining the ventricle, and Bin 10 is adjacent to the meninges. (D) Quantification of Arhgap11a smFISH punctae in electroporated RGC endfeet. (F) Cartoon of regions analyzed in RGC basal processes. (G) EGFP electroporated RGCs depicting reduced branches (arrows) along the basal process following Arhgap11a knockdown. (H) Quantification of the length of branches along the RGC basal process. (Scrambled: n=101 branches, 3 brains, 3 independent experiments; Arhgap11a: n=72 branches, 3 brains, 3 independent experiments, unpaired t-test with Welch’s correction) (I) Quantification of the density of branches along the RGC basal process. (Scrambled: n=112 cells, 6 brains, 5 independent experiments, Arhgap11a: n=99 cells, 5 brains, 4 independent experiments, unpaired t-test with Welch’s correction) (J) Schematic overview of the experiments in (J-R) aimed at testing the impact of Arhgap11a depletion in RGCs on neuronal migration. Sequential IUEs were performed to label neurons (EGFP, green) and RGCs (red) at E16.5 when analysis is performed. (K,L) Representative images showing electroporated regions (left) and position of migrating of neurons (green) at the beginning (t=0 hrs, middle) and end of the live-imaging experiment (t=16 hrs, right). (M) Neuronal migration parameters analyzed. (N-R) Quantification of velocity of neuronal migration (N), net-distance in X trajectory (O), net distance travelled in Y trajectory (P) and compiled distance (Q). (R) Arhgap11a knockdown in RGCs non-cell autonomously causes neurons to undergo more static movements and fewer movements toward the cortical plate (up). (Scrambled and Arhgap11a: n=8 brains, 2 independent experiments, unpaired t-tests) siRNAs: small interfering RNAs, IUE: in utero electroporation, CP: cortical plate, IZ: intermediate zone. *: p-value<0.05. **: p-value<0.01. ***: p-value<0.001. Scale bars: B: 20 μm, D,J-K right panels 50 μm, F: 10 μm, J-K left panels: 100 μm. Bar plots, means +/− SE.
Figure 3.
Figure 3.. Arhgap11a promotes RGC basal process and endfeet complexity and interneuron numbers in the marginal zone
(A) Schematic overview of the experiments in (B-F) which examine acute impact of RGC knockdown upon RGC basal process and endfeet in the marginal zone (MZ). (B) Region analyzed in the experiments. (C) Representative images showing basal process and endfoot complexity in the MZ in IUE’d RGCs. Tracing of images is below. (D-E) Method to define branch orders in RGC basal processes in MZ (D, left) and quantification of branch complexity (D, right), and average total branch number per RGC (E). (Scrambled: n=78 cells, 6 brains, 4 independent experiments, Arhgap11a: n=78 cells, 5 brains, 4 independent experiments, two-way ANOVA, Sidak post-hoc analyses to compare branch order). (F,G) Representative images (F) for quantification of endfoot-basal lamina contact area in the MZ (G). (Scrambled: n=351 endfeet, 6 brains, 4 independent experiments, Arhgap11a: n=351 endfeet, 6 brains, 4 independent experiments, Mann-Whitney test) (H-M) 3D reconstructions of the MZ niche using serial blockface electronic microscopy shows tight interactions between presumed (blue, pink) interneurons, cajal retzius neurons, and RGC basal processes and endfeet (yellow). siRNAs: small interfering RNAs, IUE: in utero electroporation, MZ: marginal zone, EM: electronic microscopy, *: p-value<0.05. ***: p-value<0.001. Individual data points represent different brains. Scale bars: C: 5 μm, M, O: 25 μm. Bar plots, means +/− SEM.
Figure 4.
Figure 4.. Arhgap11a influences interneuron positioning in the marginal zone
(A) Schematic overview of the experiments in (B-H) which examine acute impact of RGC knockdown upon interneuron positioning in the marginal zone (MZ). (B) Region analyzed in the experiments. (C) Immunofluorescence depicting nuclei (white, Hoechst) and laminin (red) in GFP (green) electroporated regions. (D) Quantification of the number of nuclei lining the basement membrane (BM), across a region of analysis. (Scrambled: n=9 brains, 5 independent experiments, Arhgap11a: n=4 brains, 4 independent experiments, unpaired t-test) (E) Immunofluorescence depicting Hoechst+ nuclei (blue), tdTomato+ interneurons (red) in GFP (green) electroporated region, with higher magnification images on right. Yellow arrows, tdTomato+ interneurons located against the basement membrane. (F) Quantification of Tomato+ interneurons lining the BM in indicated brains. (Scrambled: n=3 brains, 1 experiment, Arhgap11a: n=4 brains, 1 experiment, unpaired t-test) (G) Immunofluorescence depicting Hoechst+nuclei (blue), Laminin (red), Lhx6+ interneurons (green) in GFP (blue) electroporated region. (H) Quantification of Lhx6+ interneurons lining the BM in indicated brains. (Scrambled: n=6 brains, 4 experiments, Arhgap11a: n=6 brains, 3 experiments, Mann-Whitney test) siRNAs: small interfering RNAs, IUE: in utero electroporation, MZ: marginal zone, EM: electronic microscopy, *: p-value<0.05. ***: p-value<0.001, Individual data points represent different brains. Scale bars: C: 5 μm, M, O: 25 μm. Bar plots, means +/− SEM.
Figure 5.
Figure 5.. Arhgap11a mRNA is actively transported to radial glial basal endfeet via a 5′UTR element
(A,B) Schematic overview (A) of the strategy used in (B, C) to determine the endfoot localization element in Arhgap11a mRNA using a 1-day electroporation of indicated reporter constructs (B). (C) EGFP-nls localizes to RGC basal endfeet only when the Arhgap11a 5′UTR is present, but not in CDS alone or containing 3′UTR. (D, E) Schematic overview (D) of the strategy used in (F-J) to visualize transport of Arhgap11a mRNA reporters (E) in RGC basal processes. (F) smFISH (red) targeting MS2 stem-loop RNA sequences shows Arhgap11a 5′UTR induces RNA localization from cell bodies to RGC basal process and endfeet (CFP, green). (G,H) Kymographs showing absence (G) and presence (H) of MS2-tagged mRNA transport in RGC basal process over a 1-min period, in no UTR and 5′UTR, respectively. (I,J) Quantification of similar average speeds of MS2-tagged mRNA transport in RGC basal processes (I) and average run lengths (J) in both apical and basally directed movements. n=126 EGFP+ punctae, 11 cells, 2 brains, 2 independent experiments. IUE: in utero electroporation, CDS: coding sequence, UTR: untranslated region, nls: nuclear localization signal, tdMCP: tandem MS2-coat protein, CFP: cyan fluorescent protein, CP: cortical plate, IZ: intermediate zone, VZ: ventricular zone. Scale bars: F: 50μm, G,H: horizontal axis: 5sec, vertical axis: 5μm.
Figure 6.
Figure 6.. ARHGAP11A protein localization to RGC basal processes and endfeet relies on local translation of Arhgap11a mRNA in basal endfeet.
(A) Schematic overview of the strategy used in (B-E) to test if Arhgap11a mRNA localization mediates ARHGAP11A expression in RGC basal endfeet and basal processes. (B-E) Immunofluorescence of tdTomato electroporated RGCs (red) and ARHGAP11A fusion reporter (green) containing no UTR (top) or 5′UTR (bottom). High magnification images (D,E) reflect ARHGAP11A protein localizes to RGC basal endfeet (MZ/CP) and basal processes (IZ) only with Arhgap11a 5′UTR. (G) Schematic overview of the strategy used in (H-K) to visualize local translation of Arhgap11a in RGC basal endfeet. (H-I) Images showing ARHGAP11A-DENDRA fluorescence in RGC basal endfeet pre (top) and post- (bottom) photoconversion in no UTR (H) or 5′UTR (I) conditions. Time course showing recovery of native DENDRA signal in the +5′UTR condition, as psuedocolored using indicated scale (time, min). (K) Quantification of positive recovery of native DENDRA signal in RGC basal endfeet only with 5′UTR +DMSO (red, solid line) relative to both the no UTR condition (black) and anisomycin treatment (red, dotted line). no UTR: n=27 endfeet, 2 brains, 2 independent experiments, 5′UTR + DMSO: n= 62 endfeet, 3 brains, 3 independent experiments, n=69 endfeet, 3 brains, 3 independent experiments, two-way ANOVA interaction time x condition: p value < 0.0001. UTR: untranslated region, CDS: coding sequence, Aniso: anisomycin. Scale bars: B,C: 100 μm; D,E: 20 μm; H-J: 5 μm. Graph, average values +/− SEM.
Figure 7.
Figure 7.. Locally synthesized ARHGAP11A controls basal process morphology through GAP activity
(A) Schematic overview of the strategy used in (B-K) to assess rescue of RGC endfeet morphology. (B,C) Method to define branch orders in RGC basal processes in MZ. (D) Rescue constructs used in experiments. (E-I) Representative images showing basal process complexity at the level of the MZ in RGCs treated as indicated. (J,K) Quantification of basal process and endfoot complexity at the level of the MZ in RGCs. (Scrambled: n=78 cells, 6 brains, 4 independent experiments, Arhgap11a: n=78 cells, 5 brains, 4 independent experiments, Arhgap11a + rescue: n= 97 cells, 6 brains, 4 independent experiments, Arhgap11a + rescue 5′UTR: n= 56 cells, 4 brains, 3 independent experiments, Arhgap11a + GD rescue 5′UTR: n=78 cells, 4 brains, 2 independent experiments, J, 2-way ANOVA: p-value<0.0001, K, One way ANOVA: p<0.0001, Tukey’s Post-Hoc comparisons) (L,M) Quantification of endfoot-basal lamina contact area in RGCs. (Scrambled: n=351 endfeet, 6 brains, 4 independent experiments, Arhgap11a: n=351 endfeet, 6 brains, 4 independent experiments, Arhgap11a + rescue: n= 454 endfeet, 7 brains, 4 independent experiments, Arhgap11a + rescue 5′UTR: n= 200 endfeet, 4 brains, two independent experiments, Kruskal-Wallis test). (N) Images of interneurons (LHX6, green) along the basement membrane (BM, red) in different genotypes. (O, P) Quantification of the positioning of DAPI cells (white) and interneurons along the basement membrane. (Nuclei against BM: Scrambled: n=13 brains, 9 independent experiments, Arhgap11a: n=12 brains, 7 independent experiments, Arhgap11a + rescue: n=14 brains, 8 independent experiments, Arhgap11a + rescue 5′UTR: n= 13 brains, 8 independent experiments, One-way ANNOVA followed by Tukey Post-Hoc analyses; Lhx6+ cells against the BM: Scrambled: n=6 brains, 4 independent experiments, Arhgap11a: n=6 brains, 3 independent experiments, Arhgap11a + rescue: n=6 brains, 3 independent experiments, Arhgap11a + rescue 5′UTR: n= 8 brains, 4 independent experiments, Brown-Forsythe and Welch ANOVA followed by Dunnett T3 Post-Hoc analyses). IUE: in utero electroporation, siRNA: small interfering RNA, CDS: coding sequence, UTR: untranslated region, GD: Rho-gap-deficient. **: p-value<0.01. ***: p-value<0.001. E-G: 5 μm. Graphs, average values +/− SEM.
Figure 8.
Figure 8.. Model for major findings of this study.
Arhgap11a mRNA is actively transported in RGC basal process to basal endfeet. In basal endfeet local synthesis of ARHGAP11A protein enables expression in basal structures and local RhoGAP activity, thus promoting radial glia branching and interneuron position. Arhgap11a is non-cell autonomously required in RGCs for migration of excitatory neurons and positioning of inhibitory neurons.

References

    1. Buxbaum AR, Haimovich G, and Singer RH (2015). In the right place at the right time: visualizing and understanding mRNA localization. Nat Rev Mol Cell Biol 16, 95–109. 10.1038/nrm3918. - DOI - PMC - PubMed
    1. Holt CE, Martin KC, and Schuman EM (2019). Local translation in neurons: visualization and function. Nat Struct Mol Biol 26, 557–566. 10.1038/s41594-019-0263-5. - DOI - PubMed
    1. Noctor SC, Flint AC, Weissman TA, Dammerman RS, and Kriegstein AR (2001). Neurons derived from radial glial cells establish radial units in neocortex. Nature 409, 714–720. 10.1038/35055553. - DOI - PubMed
    1. Malatesta P, Hartfuss E, and Gotz M. (2000). Isolation of radial glial cells by fluorescent-activated cell sorting reveals a neuronal lineage. Development 127, 5253–5263. - PubMed
    1. Rakic P. (1972). Mode of cell migration to the superficial layers of fetal monkey neocortex. The Journal of comparative neurology 145, 61–83. 10.1002/cne.901450105. - DOI - PubMed

Publication types