. 2021 Sep 27:1:755016.
doi: 10.3389/fnetp.2021.755016. eCollection 2021.

Time in Brain: How Biological Rhythms Impact on EEG Signals and on EEG-Derived Brain Networks

Affiliations

Time in Brain: How Biological Rhythms Impact on EEG Signals and on EEG-Derived Brain Networks

Klaus Lehnertz et al. Front Netw Physiol. .

Abstract

Electroencephalography (EEG) is a widely employed tool for exploring brain dynamics and is used extensively in various domains, ranging from clinical diagnosis via neuroscience, cognitive science, cognitive psychology, psychophysiology, neuromarketing, neurolinguistics, and pharmacology to research on brain computer interfaces. EEG is the only technique that enables the continuous recording of brain dynamics over periods of time that range from a few seconds to hours and days and beyond. When taking long-term recordings, various endogenous and exogenous biological rhythms may impinge on characteristics of EEG signals. While the impact of the circadian rhythm and of ultradian rhythms on spectral characteristics of EEG signals has been investigated for more than half a century, only little is known on how biological rhythms influence characteristics of brain dynamics assessed with modern EEG analysis techniques. At the example of multiday, multichannel non-invasive and invasive EEG recordings, we here discuss the impact of biological rhythms on temporal changes of various characteristics of human brain dynamics: higher-order statistical moments and interaction properties of multichannel EEG signals as well as local and global characteristics of EEG-derived evolving functional brain networks. Our findings emphasize the need to take into account the impact of biological rhythms in order to avoid erroneous statements about brain dynamics and about evolving functional brain networks.

Keywords: biological rhythms; brain dynamics; centrality; clustering coefficient; electroencephalography; functional brain networks; statistical moments; synchronization.


Conflict of interest statement

The authors declare that the research was conducted in the absence of any commercial or financial relationships that could be construed as a potential conflict of interest.

Figures

FIGURE 1
FIGURE 1
Spectrum of main biological rhythms in humans. (A): Logarithmic presentation of period durations of rhythms (modified after Hildebrandt (1991)). (B): Zoom into human circadian rhythm with some behavioral and physiological functions within the 24 h cycle that impact on the dynamics of the brain and other organ systems.
FIGURE 2
FIGURE 2
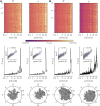
Impact of circadian rhythm and of ultradian rhythms on temporal changes of statistical moments of brain dynamics. Exemplary findings for (A) non-invasive EEG (nEEG) recording lasting 7 days (recording sites shown on y-axis; data from a male subject (81 y) with cognitive impairment under CNS drugs admitted for evaluation of epilepsy risk) and (B) intracranial EEG (iEEG) recording lasting 14 days (sampled brain regions (left/right mesial temporal lobe (MTL) and left/right frontal areas) shown on y-axis; data from a male subject (55 y) with epilepsy under CNS drugs admitted for presurgical evaluation). Top: relative power spectral densities (P; color coded) of time series of standard deviation σ, skewness s, and kurtosis k from each recording site. Middle: averaged relative power spectral densities (mean over all sampled brain regions). Insets show log-log plots of data (grey) together with linear least squares lines (blue, log  P = γ log  π, where π denotes period (range: 30 min to 32 h) and γ denotes the scaling exponent). Bottom: circadian distribution of statistical moments (24 h bins; mean over all sampled brain regions). Note that for Gaussian distributed data, skewness and (excess) kurtosis would be zero with their respective standard deviation indicated by the red circle. For σ, the outermost circle indicates the maximum value and inner circles the relative percentage. For s and k, the grey/black circles indicate the factor by which data deviates from the standard deviation of Gaussian distributed data (red circle). EEG data sampled at 256 Hz (A) 250 Hz (B); 16 bit ADC; bandwidth 1—45 Hz; notch filter at line frequency (50 Hz).
FIGURE 3
FIGURE 3
Impact of circadian rhythm and of ultradian rhythms on temporal changes of interaction properties of brain dynamics. Same EEG data as in Figure 2: (A) scalp recording; (B) intracranial recording. Top: relative power spectral densities (color coded) of time series of estimates of the strength of interaction between each (non-redundant) pair of sampled brain regions (estimates based on mean phase coherence R and on linear correlation coefficient ρ). Intrahemispheric interactions are labeled l–l/r–r and interhemispheric interactions l–r. Middle: averaged relative power spectral densities (mean over all non-redundant pairs of sampled brain regions). Insets show log-log plots of data (grey) together with linear least squares lines (blue, see Figure 2 for details). Bottom: circadian distribution of estimated interaction properties (24 h bins; mean over all non-redundant pairs of sampled brain regions).
FIGURE 4
FIGURE 4
Impact of circadian rhythm and of ultradian rhythms on temporal changes of global and local characteristics of evolving brain networks. Same EEG data as in Figure 2. (A) Scalp recording; upper row, from left to right: relative power spectral densities of time series of the networks’ clustering coefficient C (derivation of network edges based on mean phase coherence R (green) or on linear correlation coefficient ρ (purple)), of eigenvector centralities CvX of selected vertices (central (orange); occipital (blue)), and of eigenvector centralities CeX of selected edges (central—occipital (orange), occipital—occipital (blue); X refers to employed estimator (R or ρ) for derivation of network edges). Insets show log-log plots of data (grey) together with linear least squares lines (see Figure 2 for details; data shifted to enhance readability). Lower row: circadian distribution of estimated network characteristics (24 h bins; colors as is upper row). The outermost circle indicates the maximum value and inner circles the relative percentage. (B) Intracranial recording; upper row, same as in (A), but for selected vertices from right mesial temporal lobe (RMTL; orange) and from left frontal area (LF, blue) and for selected edges (RMTL—LF (orange); LF—LF (blue). Lower row as in (A).

Similar articles

Cited by

References

    1. Abiri R., Borhani S., Sellers E. W., Jiang Y., Zhao X. (2019). A Comprehensive Review of EEG-Based Brain-Computer Interface Paradigms. J. Neural Eng. 16, 011001. 10.1088/1741-2552/aaf12e - DOI - PubMed
    1. Aeschbach D., Matthews J. R., Postolache T. T., Jackson M. A., Giesen H. A., Wehr T. A. (1999). Two Circadian Rhythms in the Human Electroencephalogram during Wakefulness. Am. J. Physiology-Regulatory, Integr. Comp. Physiol. 277, R1771–R1779. 10.1152/ajpregu.1999.277.6.r1771 - DOI - PubMed
    1. Alsuradi H., Park W., Eid M. (2020). EEG-based Neurohaptics Research: A Literature Review. IEEE Access 8, 49313–49328. 10.1109/access.2020.2979855 - DOI
    1. Anokhin A. P., Birbaumer N., Lutzenberger W., Nikolaev A., Vogel F. (1996). Age Increases Brain Complexity. Electroencephalography Clin. Neurophysiol. 99, 63–68. 10.1016/0921-884x(96)95573-3 - DOI - PubMed
    1. Aricò P., Borghini G., Di Flumeri G., Sciaraffa N., Babiloni F. (2018). Passive BCI beyond the Lab: Current Trends and Future Directions. Physiol. Meas. 39, 08TR02. 10.1088/1361-6579/aad57e - DOI - PubMed

LinkOut - more resources