. 2022 Sep 28;8(2):e10412.
doi: 10.1002/btm2.10412. eCollection 2023 Mar.

Temporal evaluation of efficacy and quality of tissue repair upon laser-activated sealing

Affiliations

Temporal evaluation of efficacy and quality of tissue repair upon laser-activated sealing

Deepanjan Ghosh et al. Bioeng Transl Med. .

Abstract

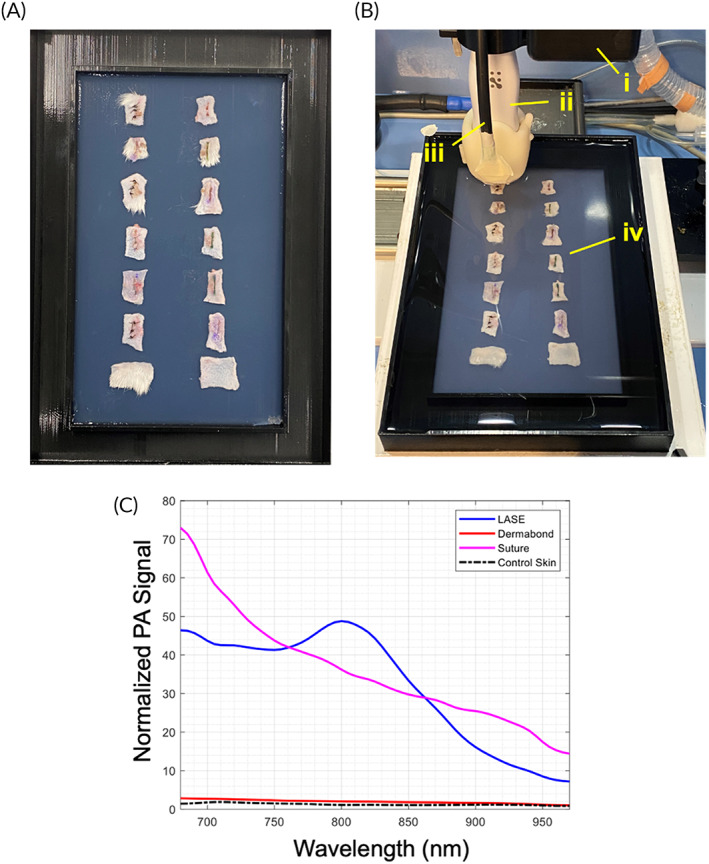
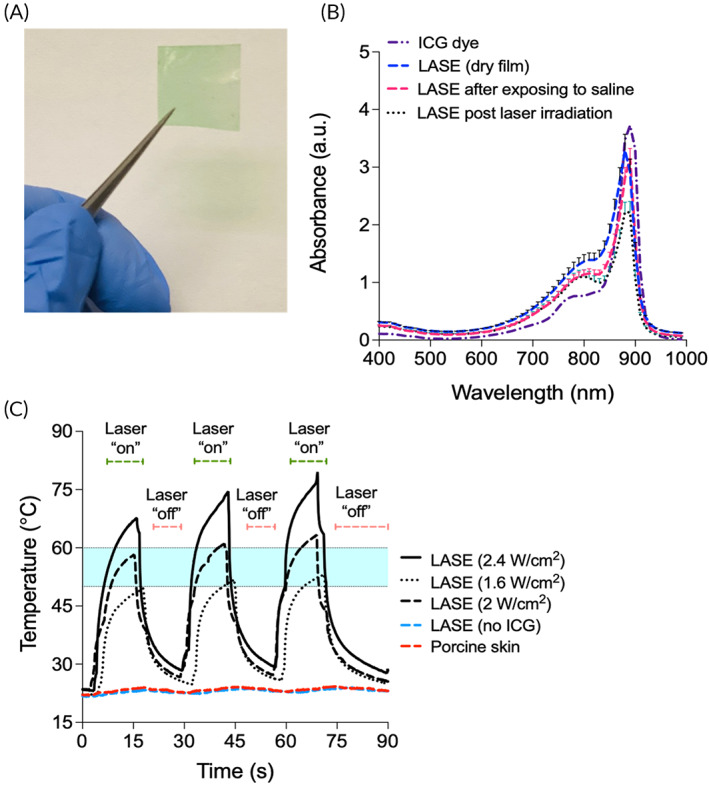
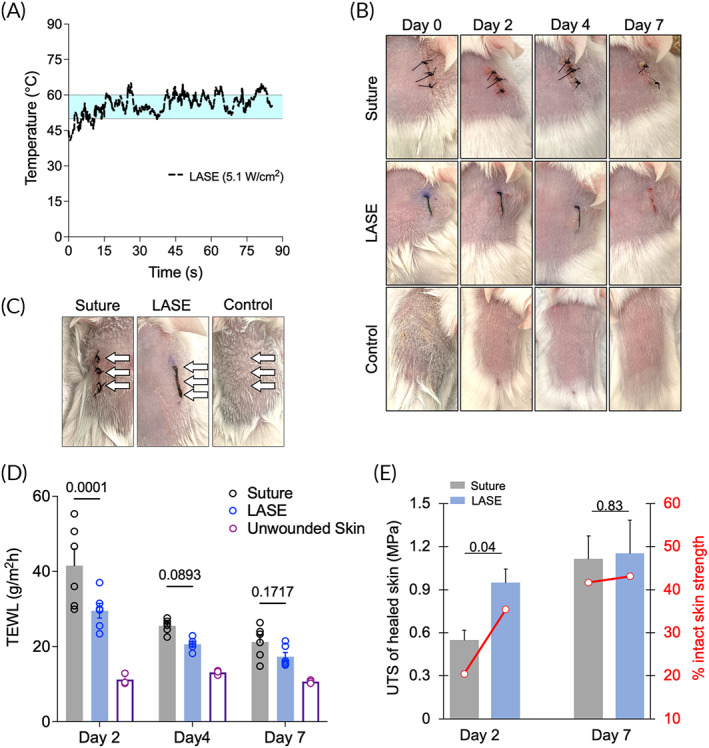
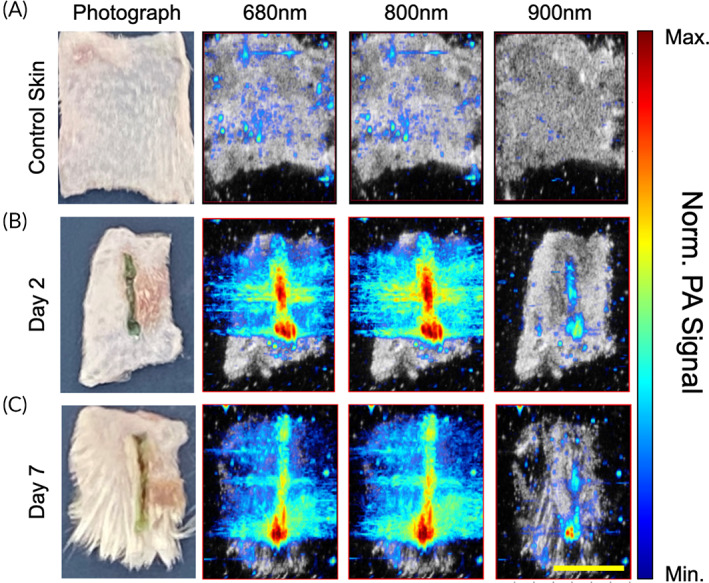
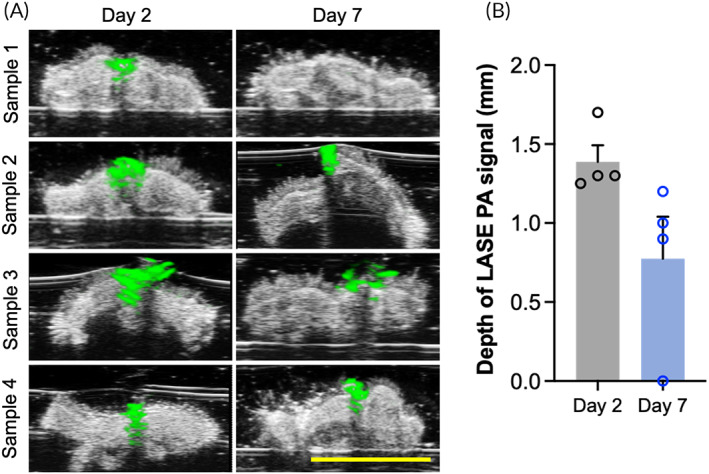
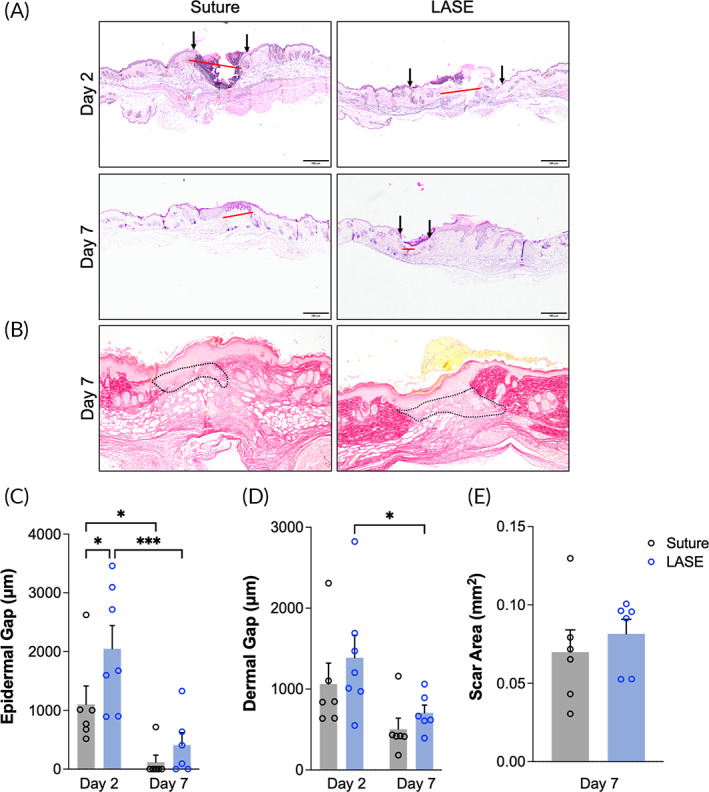
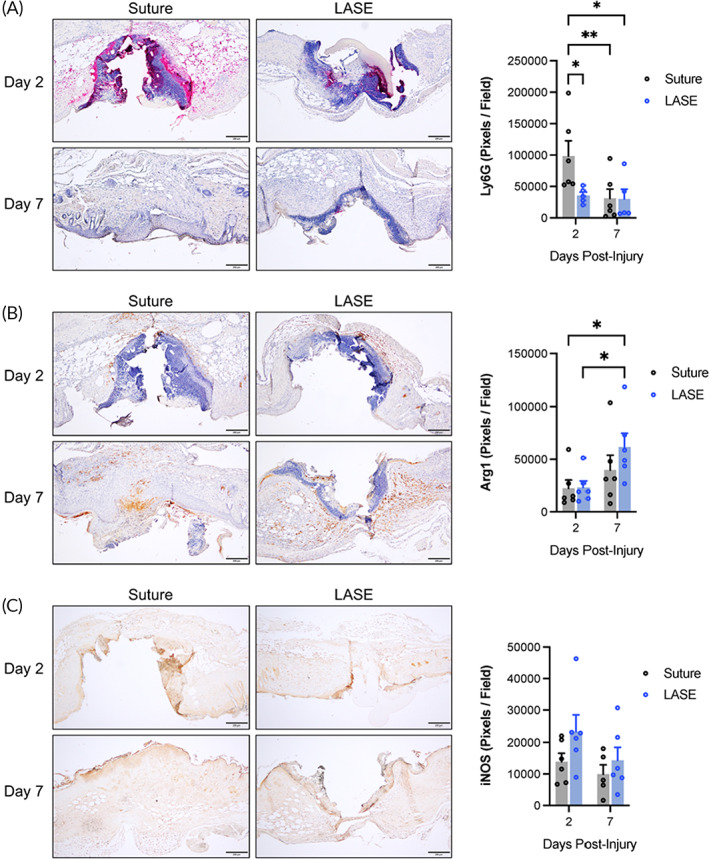
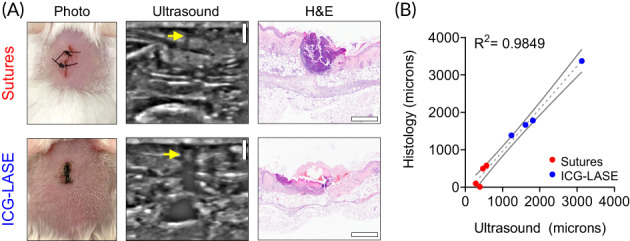
Injuries caused by surgical incisions or traumatic lacerations compromise the structural and functional integrity of skin. Immediate approximation and robust repair of skin are critical to minimize occurrences of dehiscence and infection that can lead to impaired healing and further complication. Light-activated skin sealing has emerged as an alternative to sutures, staples, and superficial adhesives, which do not integrate with tissues and are prone to scarring and infection. Here, we evaluate both shorter- and longer-term efficacy of tissue repair response following laser-activated sealing of full-thickness skin incisions in immunocompetent mice and compare them to the efficacy seen with sutures. Laser-activated sealants (LASEs) in which, indocyanine green was embedded within silk fibroin films, were used to form viscous pastes and applied over wound edges. A hand-held, near-infrared laser was applied over the incision, and conversion of the light energy to heat by the LASE facilitated rapid photothermal sealing of the wound in approximately 1 min. Tissue repair with LASEs was evaluated using functional recovery (transepidermal water loss), biomechanical recovery (tensile strength), tissue visualization (ultrasound [US] and photoacoustic imaging [PAI]), and histology, and compared with that seen in sutures. Our studies indicate that LASEs promoted earlier recovery of barrier and mechanical function of healed skin compared to suture-closed incisions. Visualization of sealed skin using US and PAI indicated integration of the LASE with the tissue. Histological analyses of LASE-sealed skin sections showed reduced neutrophil and increased proresolution macrophages on Days 2 and 7 postclosure of incisions, without an increase in scarring or fibrosis. Together, our studies show that simple fabrication and application methods combined with rapid sealing of wound edges with improved histological outcomes make LASE a promising alternative for management of incisional wounds and lacerations.

Keywords: incisional wounds; laser‐activated sealing; photoacoustic imaging; skin barrier function recovery; tissue adhesive; tissue repair; ultrasound.


Conflict of interest statement

Kaushal Rege is affiliated with a start‐up company, Synergyan, LLC. Other authors declare no conflict of interest.

Figures

FIGURE 1
FIGURE 1
Set up for ultrasound (US) and photoacoustic imaging (PAI) for skin incisions closed with sutures of sealed with LASEs. (a) Prior to imaging, excised skin samples were removed from ice‐cold 1X PBS and placed over a layer of 1.5% agarose low electroendoosmotic (EEO) cooled to room temperature in a 3D printed sample tray. Following this, another layer of agarose solution (~35–45°C) was poured over the skin samples to completely embed the tissues within the agarose layers. The sample tray was then filled with deionized water to form a layer over the agarose layer. (b) (i) Scanning of skin samples were carried out using the Vevo 3100 motor. (ii) The MX550D (50 MHz) linear array transducer and jacket consisting of the fiber bundles (iii) is lowered into the sample tray submerged in water to facilitate opto‐acoustic coupling with a 7 mm standoff from the skin samples (iv). (c) Normalized photoacoustic signal of LASE, suture, and skin sections in the range of 680–960 nm.
FIGURE 2
FIGURE 2
Silk‐ICG laser‐activated sealants (LASEs). (a) Representative image of a 2 cm × 2 cm LASE film fabricated from silkworm silk fibroin and indocyanine green (ICG) dye; the green color of the LASE is because of the ICG dye. (b) Absorbance spectra of ICG dye alone (dashed and dotted purple line), LASE film—as it is fabricated (dashed blue line), LASE in a viscous paste form after addition of saline, which was used to mimic a moist environment in wound beds (dashed red line), and post‐laser irradiation in the paste form (dotted black line). Data shown are mean ± standard error of the mean of n = 4 independent LASE films. (c) Photothermal response of LASE on ex vivo porcine skin irradiated using a continuous wave NIR laser tuned to 808 nm at varying laser power density from 1.6 to 2.4 W/cm2 in a 15 s “on” and 15 s “off” cycle (3 cycles total). Photothermal responses of silk films (with no ICG dye added, red dashed line) and porcine skin (blue dashed line) following irradiation with the laser at 2.4 W/cm2 are also shown. The region shaded in light blue color (temperature range from ~50°C to ~60°C) indicates the optimal temperature window for laser tissue sealing. Each photothermal response curve is a mean of n = 3 independent experiments.
FIGURE 3
FIGURE 3
Functional and biomechanical recovery of skin following suture closure and LASE sealing in Balb/c mice. (a) Photothermal response of LASE‐skin interface during in vivo sealing irradiated using a continuous wave NIR laser tuned to 808 nm at a laser power density of ~5.1 W/cm2. The region shaded in light blue color (temperature range from ~50°C to ~60°C) indicates the optimal temperature window for laser tissue sealing. The photothermal response curve shows data that are a mean of n = 3 independent experiments. (b) Representative images of 1‐cm long skin incisions closed with four, simple interrupted 4‐0 nylon sutures or LASE on Days 0 (immediately after closure), 2, 4, and 7 postwounding; control is unwounded skin surgically prepared similarly to incised skin. (c) Representative image showing three approximate locations at which TEWL measurements were carried out (white arrows) for each type of closure method. (d) Transepidermal water loss (TEWL) of healed skin and unwounded control skin on Days 2, 4, and 7 postwounding. TEWL value (in g/m2 h) for each incision type is the average TEWL measurement from three nonoverlapping spots over the incision line shown in b. Data shown are mean ± standard error of the mean of n = 6 mice. (e) Ultimate tensile strength (UTS) and recovery, that is, %UTS of intact skin strength (secondary axis shown in red) of healed skin on Days 2 and 7 postwounding for suture‐closed and LASE‐sealed incisions. Data shown are mean ± standard error of the mean of n = 6 mice. Statistical significance was determined using two‐way ANOVA followed by Fisher's LSD test and individual p values are shown; p < 0.05 are considered statistically significant.
FIGURE 4
FIGURE 4
Normalized sample PA signal. Computed transverse slices of B‐mode scans co‐registered with normalized PA signal at 680, 800, and 960 nm for (a) control skin without any incision surgically prepped similarly to skin samples with incisions (b) skin incisions sealed using LASE at Day 2 postclosure and sealing (c) skin incisions sealed using LASE at Day 7 postclosure and sealing. Co‐registered B‐Mode and PA images are obtained by selecting a slice from the 3D scan data set that corresponds with approximately 500 μm subsurface depth (scale bar in yellow = 5 mm).
FIGURE 5
FIGURE 5
Depth profile of LASE in wound bed. (a) Cross‐section of B‐mode scans superimposed with the normalized PA signal from LASE at 800 nm shown in green for skin samples at Day 2 postclosure and Day 7 postclosure. (b) The depth profiles of photoacoustic signal from LASE in the wound are represented as mean ± standard error of mean of n = 4 LASE‐sealed skin samples at each timepoint (scale bar in yellow = 5 mm).
FIGURE 6
FIGURE 6
Histological evaluation of skin sections during the course of healing following closure with sutures or sealing with LASE. (a) Representative hematoxylin and eosin (H&E) stained micrographs of the wound sections (×4 magnification) showing the epidermal gap (black arrows) and dermal gap (red line) on Days 2 and 7 postclosure (scale bar = 200 μm). (b) Representative picrosirius red stained micrographs of the wound sections (×10 magnification) showing the scar area in the granulation tissue (black dotted line area) at Day 7 post closure. (c and d) Quantification of epidermal gap and dermal gap in skin sections (in μm) closed with suture or LASE on Days 2 and 7 postclosure. (e) Quantification of histological scar area (in mm2) in skin sections closed with suture and LASE on Day 7 postclosure. Data shown are mean ± standard error of mean of n = 6 mice per group. Statistical significance was determined using two‐way ANOVA (for epidermal gap quantification) and one‐way ANOVA (for scar area quantification) with Fisher's LSD post hoc analysis. *p < 0.05 is considered significant.
FIGURE 7
FIGURE 7
Immunohistochemical evaluation of incised skin during the course of healing. (a) Representative micrographs and quantification of wound sections (×4 magnification) stained for Ly6G (pink chromogen) with hematoxylin counterstain at Days 2 and 7 postclosure (scale bar = 200 μm). (b) Representative micrographs and quantification of wound sections (×4 magnification) stained for Arginase‐1 (brown chromogen) with hematoxylin counterstain at Days 2 and 7 postclosure (scale bar = 200 μm). (c) Representative micrographs and quantification of wound sections (×4 magnification) stained for iNOS (brown chromogen) without nuclear counterstain at Days 2 and 7 post closure (scale bar = 200 μm). Data shown are mean ± standard error of mean of n = 5–7 mice per group. Statistical significance was determined using two‐way ANOVA (for epidermal gap quantification) and one‐way ANOVA (for scar area quantification) with Fisher's LSD post hoc analysis. Significance indicated as *p < 0.05; **p < 0.01.
FIGURE 8
FIGURE 8
Live animal ultrasound evaluation of suture‐ and LASE‐sealed wounds. (a) Representative photographs, ultrasound imaging data, and H&E images for suture‐ and LASE‐sealed linear incisions imaged by ultrasound in the live animal at Day 2 postclosure. (b) Linear correlation with 95% confidence intervals for the epidermal/dermal gap of wounds sealed by sutures (red) or ICG LASE materials (blue) measured by ultrasound (x‐axis) or histology (y‐axis). N = 4 per group.

References

    1. MacRae HM, McLeod RS. Handsewn vs. stapled anastomoses in colon and rectal surgery ‐ a meta‐analysis. Dis Colon Rectum. 1998;41(2):180‐189. - PubMed
    1. Beuran M, Chiotoroiu AL, Chilie A, et al. Stapled vs. hand‐sewn colorectal anastomosis in complicated colorectal cancer—a retrospective study. Chirurgia. 2010;105(5):645‐651. - PubMed
    1. Urie R, Flake T, Rege K. Laser tissue welding in wound healing and surgical repair, in bioengineering in wound healing. In: Golberg A, Yarmush ML, eds. Bioengineering in Wound Healing. World Scientific Publishing; 2017:303‐324.
    1. Asencio‐Arana F, Garcia‐Fons V, Torres‐Gil V, et al. Effects of a low‐power He‐Ne‐laser on the healing of experimental colon anastomoses: our experience. Opt En. 1992;31(7):1452‐1457.
    1. Cilesiz I, Springer T, Thomsen S, Welch AJ. Controlled temperature tissue fusion: argon laser welding of canine intestine in vitro. Lasers Surg Med. 1996;18(4):325‐334. - PubMed

LinkOut - more resources