

Impact of traffic congestion on spatial access to healthcare services in Nairobi
- PMID: 36925766
- PMCID: PMC10012710
- DOI: 10.3389/frhs.2022.788173
Impact of traffic congestion on spatial access to healthcare services in Nairobi
Abstract
Background: Geographic accessibility is an important determinant of healthcare utilization and is critical for achievement of universal health coverage. Despite the high disease burden and severe traffic congestion in many African cities, few studies have assessed how traffic congestion impacts geographical access to healthcare facilities and to health professionals in these settings. In this study, we assessed the impact of traffic congestion on access to healthcare facilities, and to the healthcare professionals across the healthcare facilities.
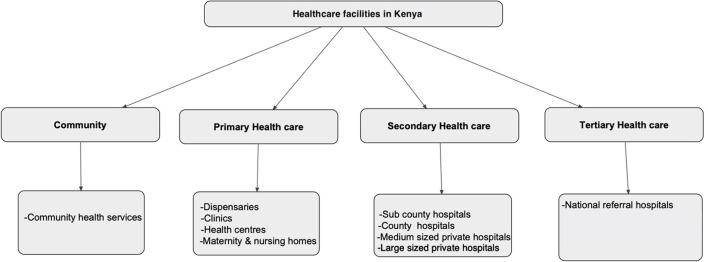
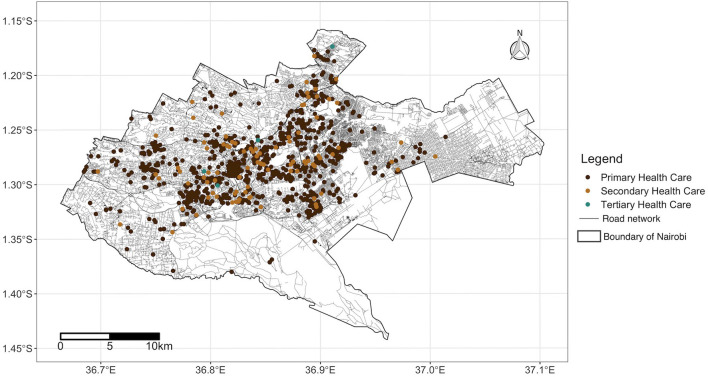
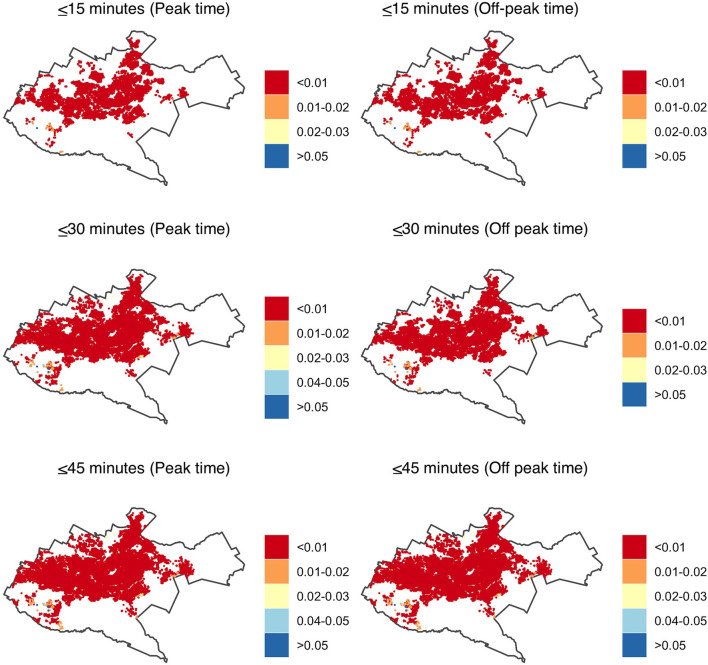
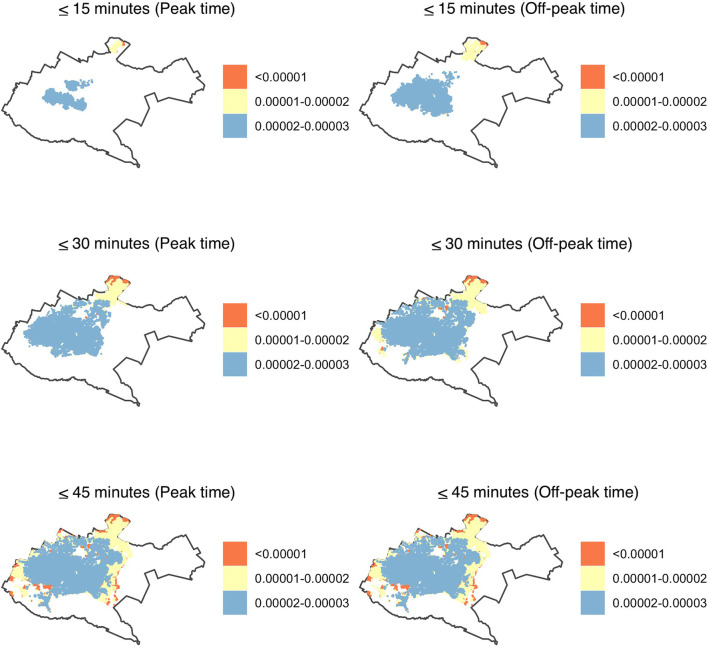
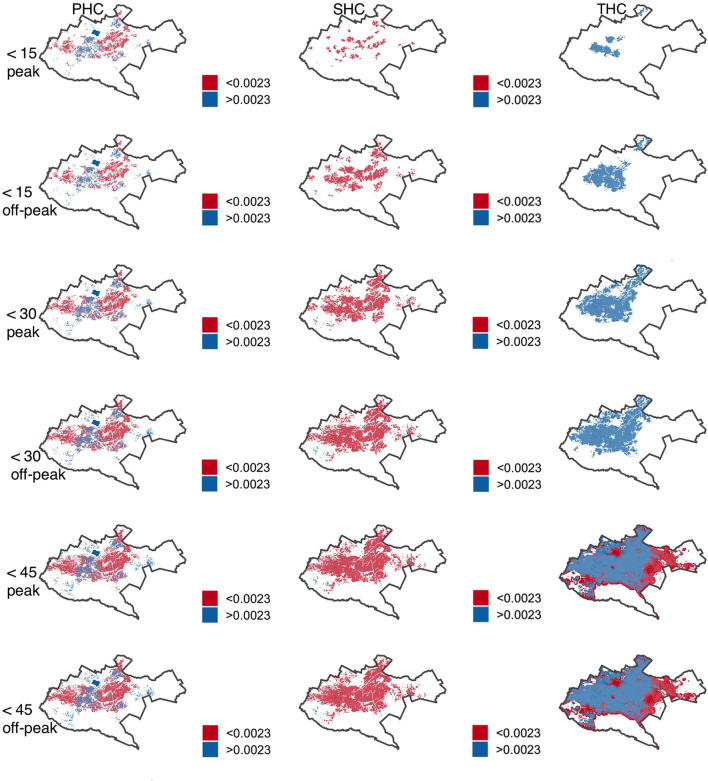
Methods: Using data on health facilities obtained from the Ministry of Health in Kenya, we mapped 944 primary, 94 secondary and four tertiary healthcare facilities in Nairobi County. We then used traffic probe data to identify areas within a 15-, 30- and 45-min drive from each health facility during peak and off-peak hours and calculated the proportion of the population with access to healthcare in the County. We employed a 2-step floating catchment area model to calculate the ratio of healthcare and healthcare professionals to population during these times.
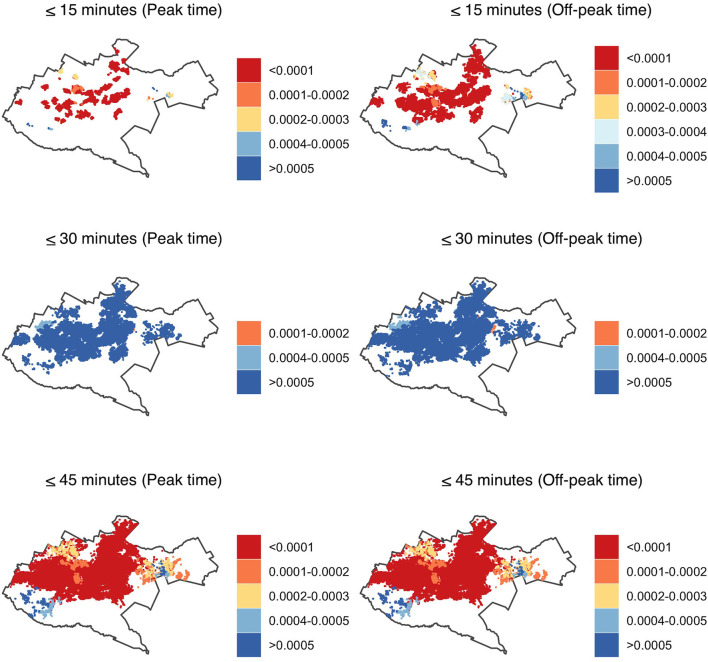
Results: During peak hours, <70% of Nairobi's 4.1 million population was within a 30-min drive from a health facility. This increased to >75% during off-peak hours. In 45 min, the majority of the population had an accessibility index of one health facility accessible to more than 100 people (<0.01) for primary health care facilities, one to 10,000 people for secondary facilities, and two health facilities per 100,000 people for tertiary health facilities. Of people with access to health facilities, a sub-optimal ratio of <4.45 healthcare professionals per 1,000 people was observed in facilities offering primary and secondary healthcare during peak and off-peak hours.
Conclusion: Our study shows access to healthcare being negatively impacted by traffic congestion, highlighting the need for multisectoral collaborations between urban planners, health sector and policymakers to optimize health access for the city residents. Additionally, growing availability of traffic probe data in African cities should enable similar analysis and understanding of healthcare access for city residents in other countries on the continent.
Keywords: catchment model; healthcare accessibility; sub-Saharan Africa; traffic congestion; universal healthcare access.
Copyright © 2022 Mutono, Wright, Mutunga, Mutembei and Thumbi.
Conflict of interest statement
The authors declare that the research was conducted in the absence of any commercial or financial relationships that could be construed as a potential conflict of interest.
Figures
References
-
- Ouma PO, Maina J, Thuranira PN, Macharia PM, Alegana VA, English M, et al. . Access to emergency hospital care provided by the public sector in sub-Saharan Africa in 2015: a geocoded inventory and spatial analysis. Lancet Glob Heal. (2018) 6:e342–50. 10.1016/S2214-109X(17)30488-6 - DOI - PMC - PubMed
-
- United Nations . Sustainable Development Goals: 17 Goals to Transform our world. United Nations. (2015). Available online at: http://www.un.org/sustainabledevelopment/water-and-sanitation/ (acceesed November 2, 2017).
-
- Kapologwe NA, Meara JG, Kengia JT, Sonda Y, Gwajima D, Alidina S, et al. . Development and upgrading of public primary healthcare facilities with essential surgical services infrastructure: a strategy towards achieving universal health coverage in Tanzania. BMC Health Serv Res. (2020) 20:1–14. 10.1186/s12913-020-5057-2 - DOI - PMC - PubMed
LinkOut - more resources
Full Text Sources