

Evolution of Cortical Functional Networks in Healthy Infants
- PMID: 36926103
- PMCID: PMC10013075
- DOI: 10.3389/fnetp.2022.893826
Evolution of Cortical Functional Networks in Healthy Infants
Abstract
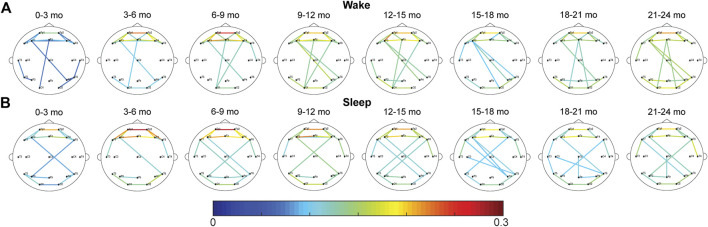
During normal childhood development, functional brain networks evolve over time in parallel with changes in neuronal oscillations. Previous studies have demonstrated differences in network topology with age, particularly in neonates and in cohorts spanning from birth to early adulthood. Here, we evaluate the developmental changes in EEG functional connectivity with a specific focus on the first 2 years of life. Functional connectivity networks (FCNs) were calculated from the EEGs of 240 healthy infants aged 0-2 years during wakefulness and sleep using a cross-correlation-based measure and the weighted phase lag index. Topological features were assessed via network strength, global clustering coefficient, characteristic path length, and small world measures. We found that cross-correlation FCNs maintained a consistent small-world structure, and the connection strengths increased after the first 3 months of infancy. The strongest connections in these networks were consistently located in the frontal and occipital regions across age groups. In the delta and theta bands, weighted phase lag index networks decreased in strength after the first 3 months in both wakefulness and sleep, and a similar result was found in the alpha and beta bands during wakefulness. However, in the alpha band during sleep, FCNs exhibited a significant increase in strength with age, particularly in the 21-24 months age group. During this period, a majority of the strongest connections in the networks were located in frontocentral regions, and a qualitatively similar distribution was seen in the beta band during sleep for subjects older than 3 months. Graph theory analysis suggested a small world structure for weighted phase lag index networks, but to a lesser degree than those calculated using cross-correlation. In general, graph theory metrics showed little change over time, with no significant differences between age groups for the clustering coefficient (wakefulness and sleep), characteristics path length (sleep), and small world measure (sleep). These results suggest that infant FCNs evolve during the first 2 years with more significant changes to network strength than features of the network structure. This study quantifies normal brain networks during infant development and can serve as a baseline for future investigations in health and neurological disease.
Keywords: brain mapping; development; electroencephalography; functional connectivity; graph theory; pediatrics; resting-state networks.
Copyright © 2022 Hu, Goetz, To, Garner, Magers, Skora, Tran, Yuen, Hussain, Shrey and Lopour.
Conflict of interest statement
The authors declare that the research was conducted in the absence of any commercial or financial relationships that could be construed as a potential conflict of interest.
Figures


References
-
- Antoniou I. E., Tsompa E. T. (2008). Statistical Analysis of Weighted Networks. Discrete Dyn. Nat. Soc. 2008, 1–16. 10.1155/2008/375452 - DOI
-
- Bathelt J., O'Reilly H., Clayden J. D., Cross J. H., De Haan M. (2013). Functional Brain Network Organisation of Children between 2 and 5years Derived from Reconstructed Activity of Cortical Sources of High-Density EEG Recordings. Neuroimage 82, 595–604. 10.1016/j.neuroimage.2013.06.003 - DOI - PubMed