. 2023 Mar 14;2(3):pgad033.
doi: 10.1093/pnasnexus/pgad033. eCollection 2023 Mar.

Extreme differences in SARS-CoV-2 viral loads among respiratory specimen types during presumed pre-infectious and infectious periods

Affiliations

Extreme differences in SARS-CoV-2 viral loads among respiratory specimen types during presumed pre-infectious and infectious periods

Alexander Viloria Winnett et al. PNAS Nexus. .

Abstract

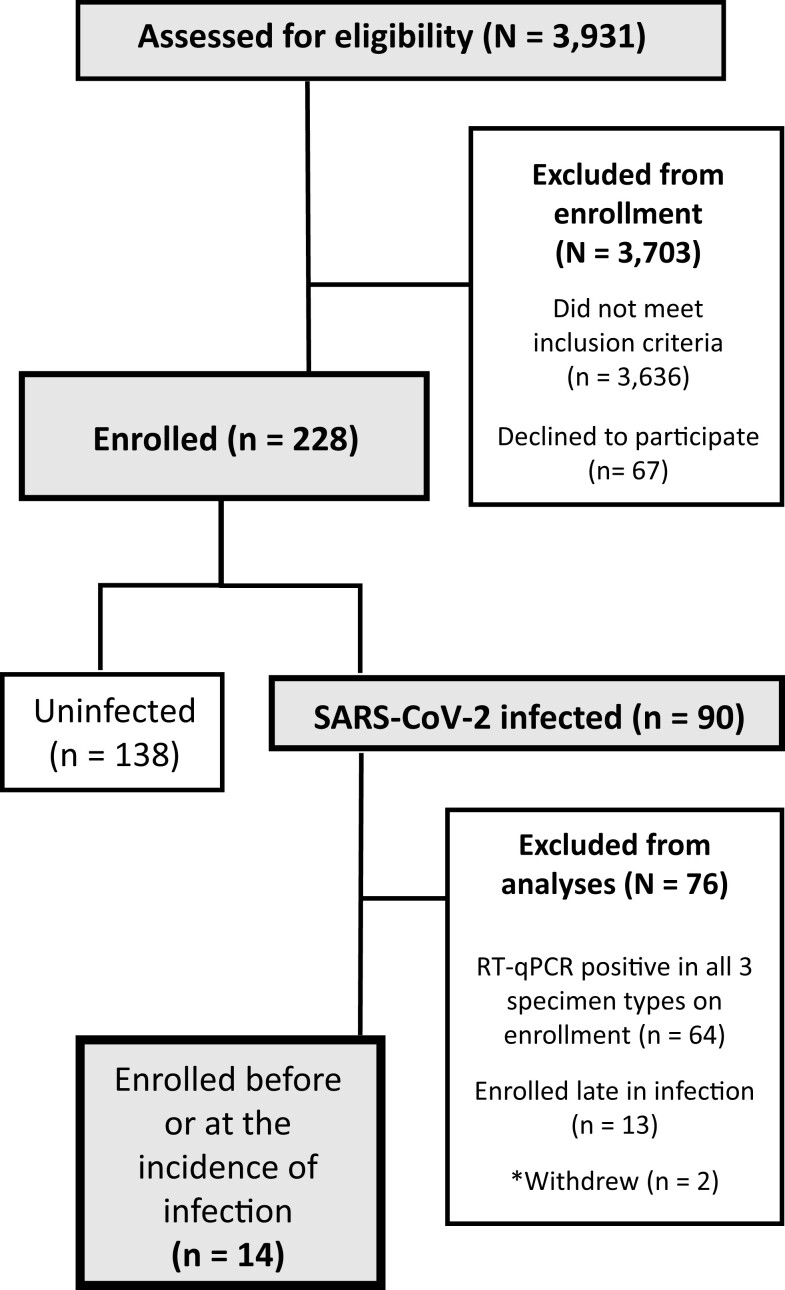
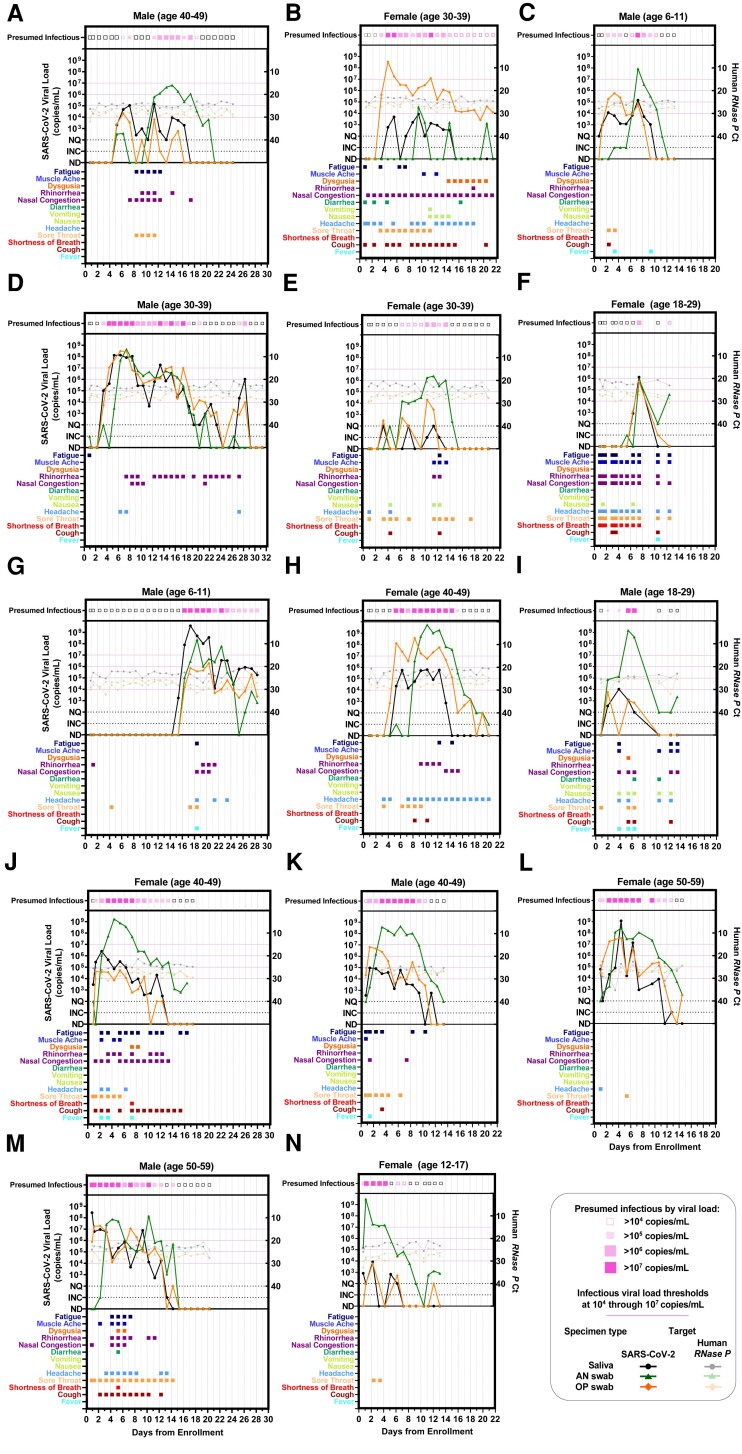
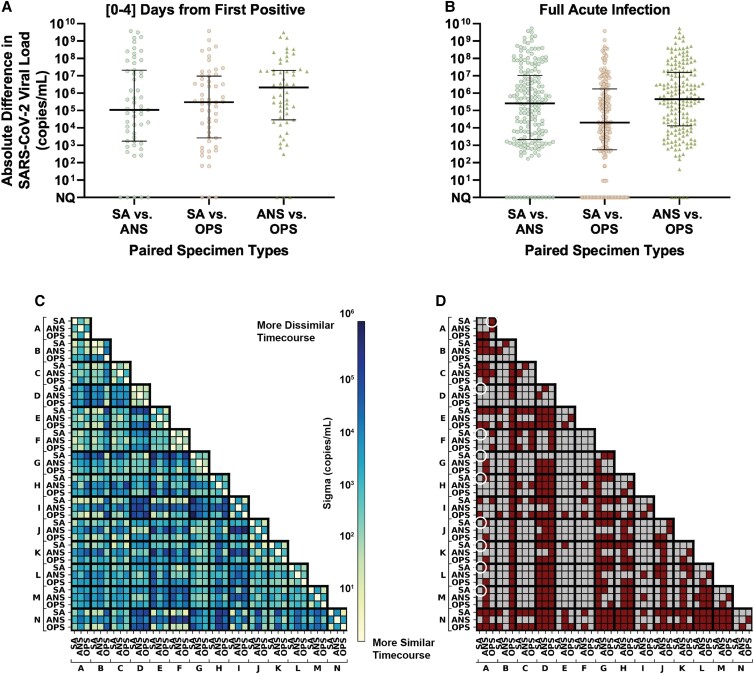
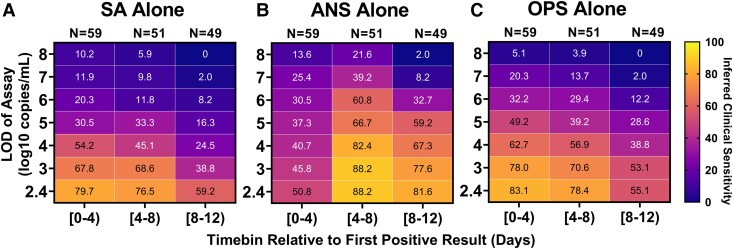
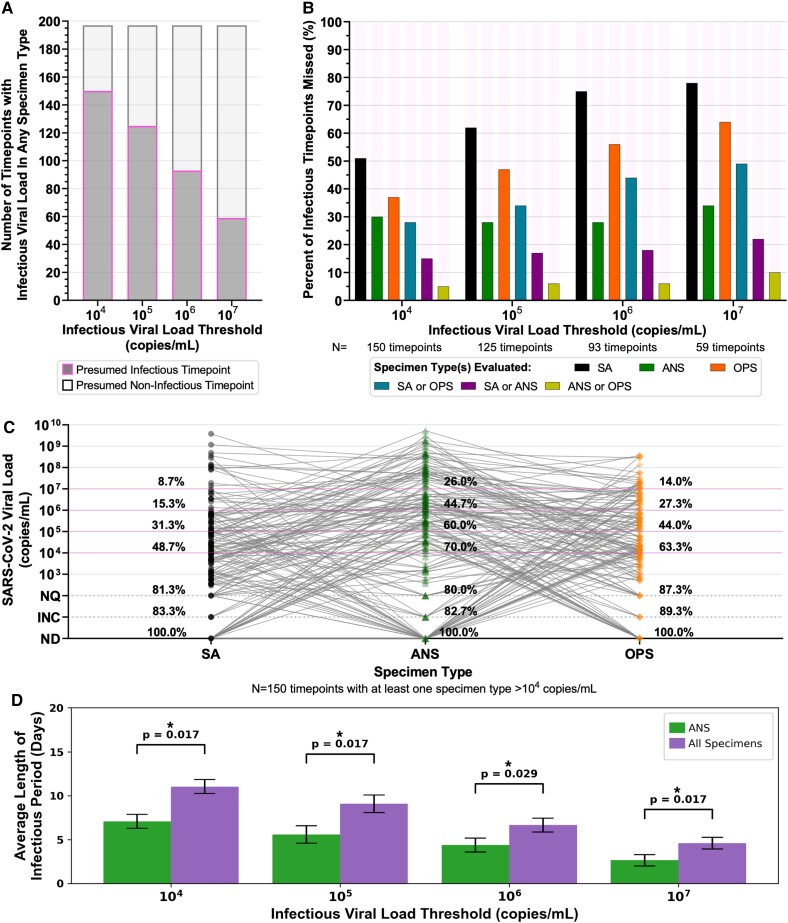
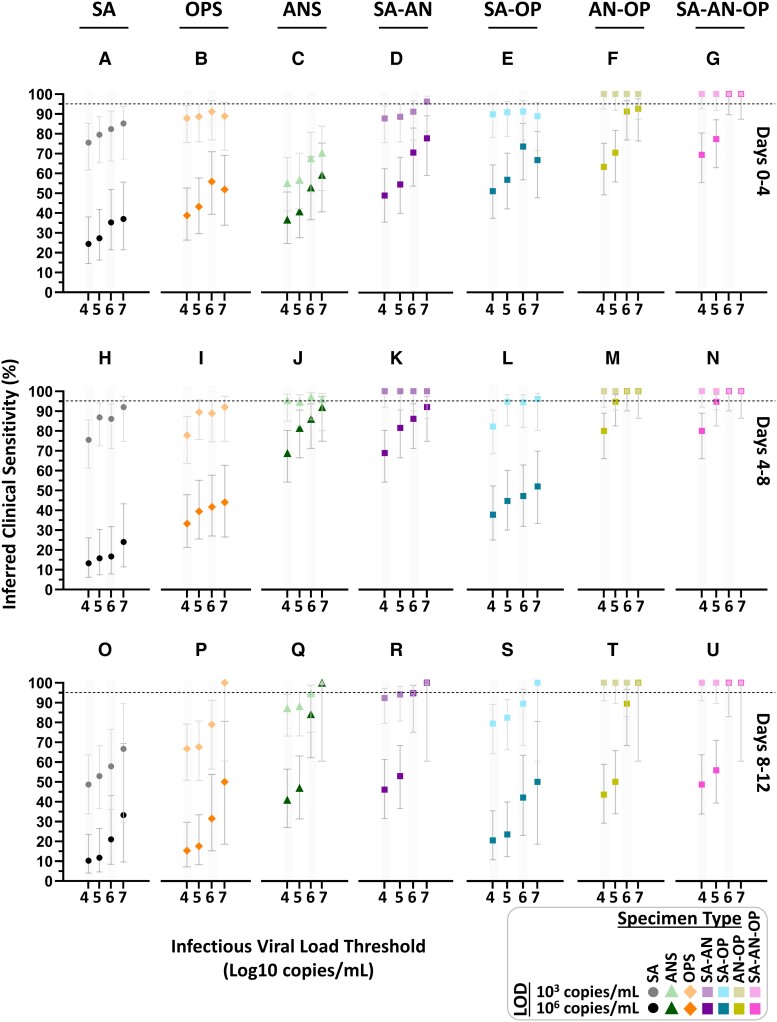
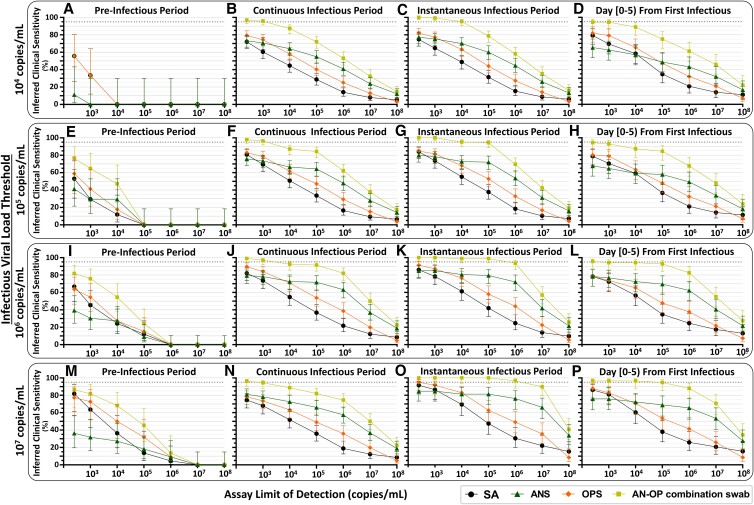
SARS-CoV-2 viral-load measurements from a single-specimen type are used to establish diagnostic strategies, interpret clinical-trial results for vaccines and therapeutics, model viral transmission, and understand virus-host interactions. However, measurements from a single-specimen type are implicitly assumed to be representative of other specimen types. We quantified viral-load timecourses from individuals who began daily self-sampling of saliva, anterior-nares (nasal), and oropharyngeal (throat) swabs before or at the incidence of infection with the Omicron variant. Viral loads in different specimen types from the same person at the same timepoint exhibited extreme differences, up to 109 copies/mL. These differences were not due to variation in sample self-collection, which was consistent. For most individuals, longitudinal viral-load timecourses in different specimen types did not correlate. Throat-swab and saliva viral loads began to rise as many as 7 days earlier than nasal-swab viral loads in most individuals, leading to very low clinical sensitivity of nasal swabs during the first days of infection. Individuals frequently exhibited presumably infectious viral loads in one specimen type while viral loads were low or undetectable in other specimen types. Therefore, defining an individual as infectious based on assessment of a single-specimen type underestimates the infectious period, and overestimates the ability of that specimen type to detect infectious individuals. For diagnostic COVID-19 testing, these three single-specimen types have low clinical sensitivity, whereas a combined throat-nasal swab, and assays with high analytical sensitivity, was inferred to have significantly better clinical sensitivity to detect presumed pre-infectious and infectious individuals.

Keywords: COVID-19; testing strategies; viral loads.


Figures

Fig. 1.
Fig. 1.
A CONSORT diagram shows participant recruitment, eligibility, enrollment, and selection for inclusion in the study cohort.
Fig. 2.
Fig. 2.
Individual viral-load timecourse measurements from 14 participants enrolled at or before the incidence of acute SARS-CoV-2 infection. Each panel (A–N) represents a single participant throughout the course of enrollment. Each panel plots SARS-CoV-2 viral-load measurements (left y-axis) and human RNase P Ct values (right y-axis). Line colors indicate specimen type: black/grey circles are saliva, green triangles are anterior-nares (AN) swabs, and orange diamonds are oropharyngeal (OP) swabs. Timepoints at which at least one specimen type had presumably infectious viral load (>104–107 copies/mL) are indicated at the top of each plot. Colored boxes below each plot indicate the symptoms reported at each sample-collection timepoint. Each of the 14 participants collected three specimen types throughout the course of acute infection, resulting in 42 viral-load timecourses. Participants collected an average of 15 (±5 SD) daily timepoints. ND, not detected; INC, inconclusive result; NQ, virus detected, however, viral loads below the test LOD (250 copies/mL) and thus not reliably quantifiable for RT-qPCR measurements.
Fig. 3.
Fig. 3.
Extreme differences in viral loads across specimen types collected from the same person at the same timepoint for the 14 participants enrolled before or at the incidence of acute SARS-CoV-2 infection. A, B) Absolute differences in viral loads across paired specimen types were calculated as the absolute value of viral load in one specimen type minus another from the same participant at the same specimen-collection timepoint. Black lines indicate median, with interquartile range. Differences are shown for: A) 55 timepoints collected in the first 4 days from the incidence of infection (first positive specimen of any type) in each participant and B) 186 timepoints collected throughout the entirety of acute infection (at least one specimen type from the participant at the timepoint was positive and had quantifiable SARS-CoV-2 viral load; 11 timepoints were positive but not quantifiable). C) Correlation of viral-load timecourses, measured as the standard deviation across paired viral-load timecourses, assuming Gaussian-distributed noise (see Methods “Comparison of Viral-Load Timecourses Across Specimen Types”). D) Statistical significance of the difference in viral-load timecourses between specimens and between participants. Statistically significantly different timecourses are represented as red cells and nonsignificant comparisons are grey. White circles are called out as examples in the text. Expected sampling noise was estimated by analyzing RNase P Ct data from our study (Fig. S4) and from Levy et al. (63). P-values were obtained by comparing residuals from observed data and expected sampling noise. Additional method details are shown in Fig. S5. SA, saliva; ANS, anterior-nares nasal swab; OPS, oropharyngeal swab. Participant labels match Fig. 2 panels (A–N).
Fig. 4.
Fig. 4.
Inferred clinical sensitivity of assays with different LODs to detect infected persons by any single specimen type (A–C). Heatmaps show the inferred clinical sensitivity as a function of test LOD throughout the course of the infection (in 4-day timebins relative to the first positive specimen of any type) for (A) SA specimens alone, (B) nasal-swab specimens alone, and (C) throat-swab specimens alone. Inferred clinical sensitivity was calculated as the number of specimens of the given type with viral loads greater than the given LOD divided by the total number of specimens collected within that timebin. N indicates the number of timepoints. Only timepoints where at least one specimen type had a quantifiable viral load (≥250 copies/mL) were included. Two-day timebins are shown in Fig. S6. The performances of computationally contrived combination specimen types are shown in Figs. S6 and S7.
Fig. 5.
Fig. 5.
Analyses of presumed infectious viral loads in each specimen type using different infectious thresholds. A) Stacked bar plots of the number of timepoints with at least one specimen type above the indicated infectious viral-load threshold (dark grey with magenta outline), and where all paired specimen types collected at a timepoint had viral loads below the infectious viral-load threshold (light grey with black outline). B) Each bar represents the proportion of all infectious timepoints (i.e. saliva or nasal swab or throat swab had a viral load above the infectious viral-load threshold), where the given specimen type or combination of specimen types did not have an infectious viral load. For example, with an infectious viral-load threshold of 104 copies/mL, 150 timepoints had an infectious viral load in at least one specimen type: in 105 of those 150 timepoints (70%), the nasal-swab (ANS) specimen had an infectious viral load. Therefore, 30% of infectious timepoints would be missed if only the ANS specimen type were evaluated for infectious viral load. Each group of bars provides values for alternate infectious viral-load thresholds, 105, 106, and 107 copies/mL. C) Viral loads of all three specimen types collected by each participant at the same timepoint where at least one specimen type had a viral load above 104 copies/mL (N = 150 timepoints). Percentages above each specimen type provide the cumulative proportion of specimens with viral loads at or above each line. Horizontal magenta lines indicate possible infectious viral-load thresholds based on literature. D) Average length of the infectious period when considering only presumably infectious loads in ANS (green) or when considering all specimen types (purple). Error bars are SEM. P-values were obtained by performing related-sample t-tests for each IVLT. P-values were adjusted using two-stage Benjamini–Hochberg correction to account for multiple hypotheses being tested. ANS, anterior-nares swab; SA, saliva; OPS, oropharyngeal swab; ND, not detected by RT-qPCR; INC, inconclusive result by RT-qPCR; NQ, not quantifiable by RT-qPCR.
Fig. 6.
Fig. 6.
Inferred clinical sensitivity of high- and low-analytical-sensitivity assays to detect presumed infectious individuals by testing single and combination specimen types throughout acute, incident infection. For each 4-day timebin (A–G, H–N, and O–U) relative to the first SARS-CoV-2 positive specimen (of any type), participants were classified as being presumed infectious if viral load in any specimen type collected at a given timepoint was above an infectious viral load threshold. For a high-analytical-sensitivity assay with an LOD of 103 copies/mL and low-analytical-sensitivity assay with an LOD of 106 copies/mL, the inferred clinical sensitivity was calculated as the number of specimens of that specimen type with a measured viral load at or above the LOD divided by the total specimen-collection timepoints included in that timebin. Error bars indicate the 95% CI. The viral load of computationally contrived combination specimen types was taken as the higher viral load of the specimen types included in the combination collected by a participant at a given timepoint. SA, saliva; ANS, anterior-nares swab; OPS, oropharyngeal (throat) swab; SA–AN, saliva-anterior-nares swab combination; SA-OP, saliva–oropharyngeal combination swab; AN–OPS, anterior-nares–oropharyngeal combination swab; SA–AN–OP, saliva-anterior-nares–oropharyngeal combination swab. Inferred clinical sensitivity for LODs from 102.4 to 108 copies/mL shown in Fig. S8; 2-day timebins are shown in Fig. S9.
Fig. 7.
Fig. 7.
Inferred detection of presumed pre-infectious and infectious individuals at a range of test LODs and with single-specimen tests or AN–OP combination swab specimen type. For each participant, the pre-infectious period was defined as all timepoints with quantifiable SARS-CoV-2 viral load before the first timepoint when at least one specimen type had a viral load above the indicated infectious viral load threshold. We then used three different, common definitions for the infectious period, to assess the robustness of our conclusions. First, we used a “continuous infectious period” whereby a participant is presumed infectious for all timepoints between the first specimen with an infectious viral load and the first timepoint after which no specimens had infectious viral loads. Second, we used an “instantaneous infectious period,” which presumes that a participant is infectious only at timepoints when viral load in at least one specimen type is above the infectious viral load threshold. Third, we presumed that a participant is infectious only for the first 5 days from their first timepoint when at least one specimen type had a viral load above the infectious viral load threshold. These three types of infectious periods were determined for each infectious viral-load threshold: 104, 105, 106, and 107 copies/mL. Each panel provides the inferred clinical performance to detect pre-infectious or infectious individuals, using a given specimen type, for a given assay LOD. Inferred clinical sensitivity was calculated as the number of specimens of each type with a viral load above the assay LOD, divided by the total number of specimens of that type in that period of infection. N indicates the total number of specimens of each type included in the inferred clinical sensitivity calculation. Dotted line indicates 95% inferred clinical sensitivity. SA, saliva; ANS, anterior-nares swab; OPS, oropharyngeal swab; AN–OP combination swab, predicted combined anterior-nares–oropharyngeal swab specimen type.

Similar articles

Cited by

References

    1. Elie B, et al. . 2022. Variant-specific SARS-CoV-2 within-host kinetics. J Med Virol. 94(8):3625–3633. - PMC - PubMed
    1. Laajaj R, et al. . 2022. Understanding how socioeconomic inequalities drive inequalities in COVID-19 infections. Sci Rep. 12(1):8269. - PMC - PubMed
    1. Hart WS, Maini PK, Thompson RN. 2021. High infectiousness immediately before COVID-19 symptom onset highlights the importance of continued contact tracing. Elife 10:e65534. - PMC - PubMed
    1. NIH . 2021. Therapeutic Management of Adults With COVID-19. https://www.covid19treatmentguidelines.nih.gov/therapeutic-management/.
    1. Beigel JH, et al. . 2020. Remdesivir for the treatment of COVID-19—final report. N Engl J Med. 383(19):1813–1826. - PMC - PubMed