. 2022:2:989002.
doi: 10.3389/fopht.2022.989002. Epub 2022 Aug 26.

ON and OFF Signaling Pathways in the Retina and the Visual System

Affiliations

ON and OFF Signaling Pathways in the Retina and the Visual System

Tomomi Ichinose et al. Front Ophthalmol (Lausanne). 2022.

Abstract

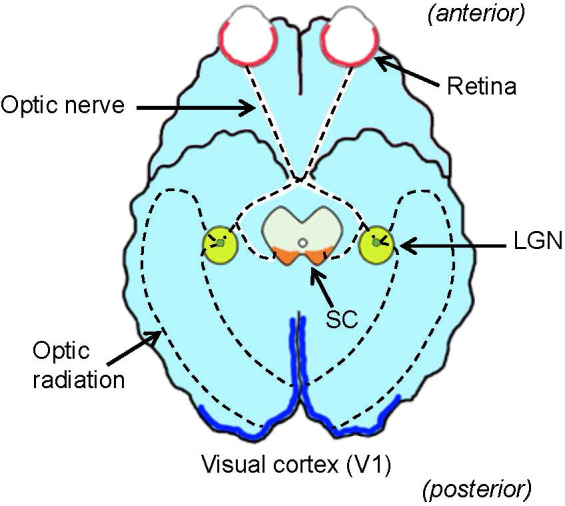
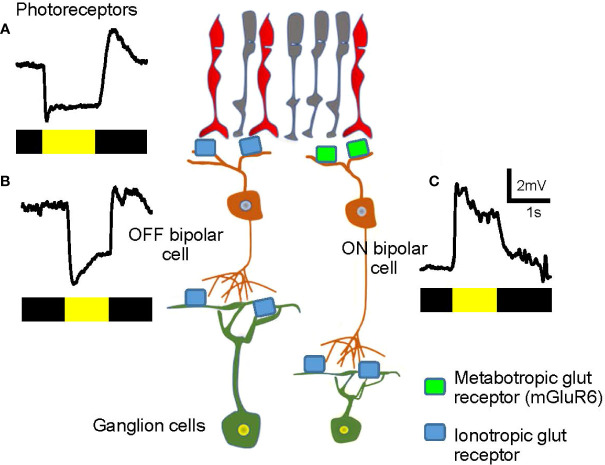
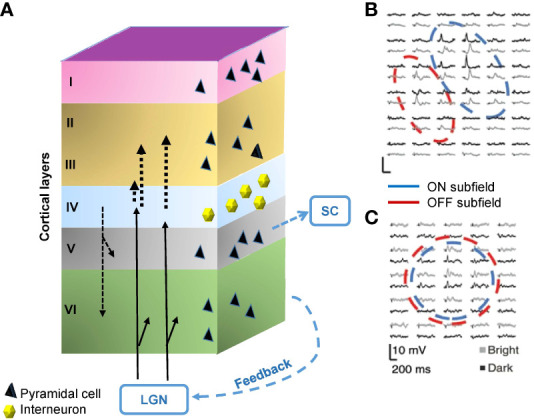
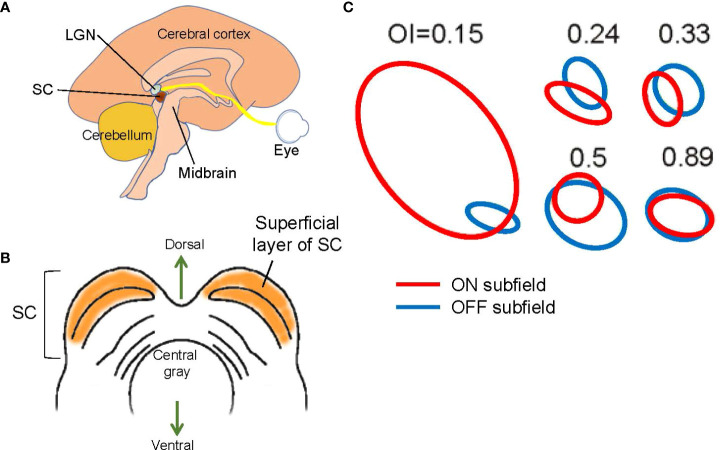
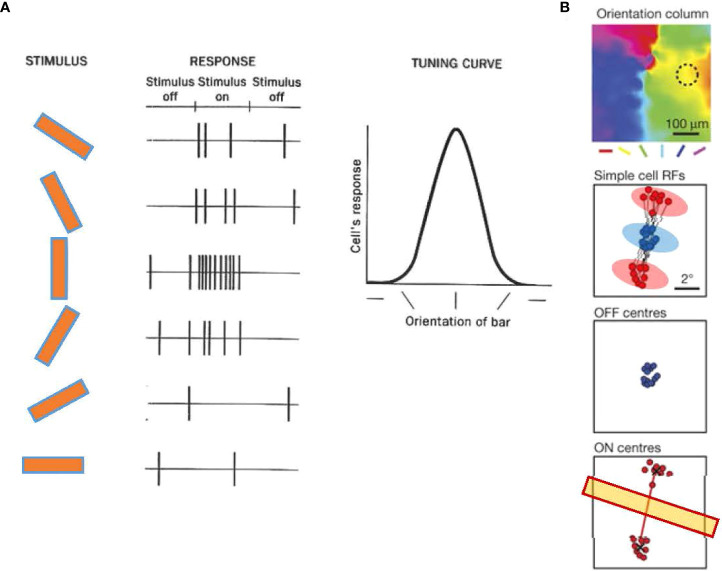
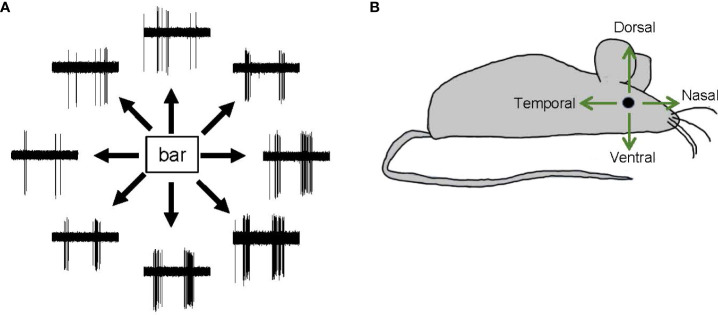
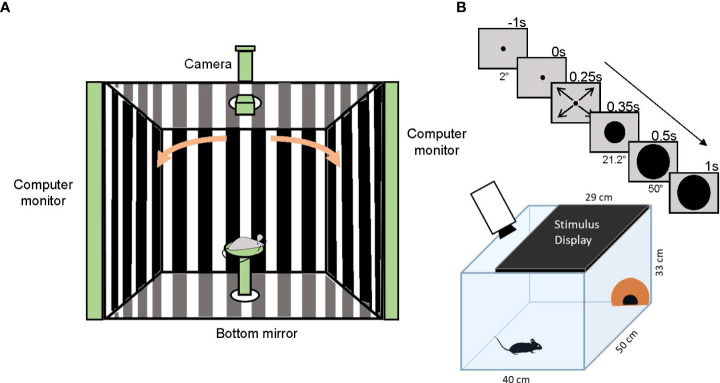
Visual processing starts at the retina of the eye, and signals are then transferred primarily to the visual cortex and the tectum. In the retina, multiple neural networks encode different aspects of visual input, such as color and motion. Subsequently, multiple neural streams in parallel convey unique aspects of visual information to cortical and subcortical regions. Bipolar cells, which are the second order neurons of the retina, separate visual signals evoked by light and dark contrasts and encode them to ON and OFF pathways, respectively. The interplay between ON and OFF neural signals is the foundation for visual processing for object contrast which underlies higher order stimulus processing. ON and OFF pathways have been classically thought to signal in a mirror-symmetric manner. However, while these two pathways contribute synergistically to visual perception in some instances, they have pronounced asymmetries suggesting independent operation in other cases. In this review, we summarize the role of the ON-OFF dichotomy in visual signaling, aiming to contribute to the understanding of visual recognition.

Keywords: Bipolar cell; Parallel processing; Primary visual cortex; Retina; Superior colliculus; Visual System.


Conflict of interest statement

Conflict of Interest The author declare that the research was conducted in the absence of any commercial or financial relationships that could be construed as a potential conflict of interest.

Figures

Figure 1
Figure 1
Ventral view of the brain and visual system. The retina (red) in the eye sends visual signals through the optic nerve. The lateral geniculate nucleus (LGN, green) relays visual signals to the visual cortex (V1, blue) in the cerebral cortex. Some signals are also relayed to the superior colliculus (SC, orange) in the midbrain tectum. Dotted lines denote the visual pathway.
Figure 2
Figure 2
A schematic showing retinal organization. First-order neurons—rod and cone photoreceptors—occupy the outer nuclear layer (ONL). At the outer plexiform layer (OPL), visual signals are transferred to second-order neurons—bipolar cells—in the inner nuclear layer (INL). Numbers are included in bipolar cells’ somas to show their types in the mouse retina. Then, at the inner plexiform layer (IPL), visual signals are transferred from bipolar cells to third-order neurons—ganglion cells—in the ganglion cell layer (GCL). Ganglion cell somas are outlined in blue. Two red lines in the IPL indicate the ChAT bands: OFF ChAT band (upper) and ON ChAT band (lower), which are utilized as a landmark of the IPL.
Figure 3
Figure 3
Visual signals in the first- and the second-order neurons in the retina. (A) A representative visual signal in photoreceptors. Photoreceptors hyperpolarize when illuminated and depolarize at light offset. The bar color indicates the timing of dark (black) and light (yellow) stimuli. (B) An OFF bipolar cell hyperpolarizes when illuminated. The signal is transferred from photoreceptors via ionotropic glutamate receptors (light blue) and the sign of the signal is preserved. (C) An ON bipolar cell depolarizes when illuminated. The signal is transferred from photoreceptors through metabotropic glutamate receptors (mGluR6, green) and the sign of the signal is inverted.
Figure 4
Figure 4
Structure and the signals of the primary visual cortex (V1). (A) The V1 comprises six layers of neurons, including pyramidal cells and interneurons. The visual signal from the lateral geniculate nucleus (LGN) innervates Layer 4 and partially also Layer 6. Layer 4 interneurons relay signals to Layer 2/3. There are also interlayer connections, feedback connections to the LGN, and feedforward connections from Layer 5 to the superior colliculus (SC). (B) A representative receptive field of a simple cell in Layer 4, which contains aligned and elongated ON and OFF subfields. Black and gray traces show per-stimulus time histograms measured with dark and light stimuli, respectively. (C) A representative receptive field of a complex cell in Layer 2/3. The ON and OFF subfields show greater overlap. (B) and (C) are adapted with permission from Martinez et al. (61).
Figure 5
Figure 5
Structure and signals of the superior colliculus (SC). (A) A schematic showing a mid-sagittal view of the brain and the locations of the lateral geniculate nucleus (LGN) and the SC. The SC is located in the midbrain tectum. (B) A schematic showing a midbrain section at the level of the SC. The superficial layer of the SC is purely visual. (C) Examples of SC receptive fields. ON (red) and OFF (blue) subfields show overlap with a range of overlap index (OI). Adapted with permission from Wang et al. (73).
Figure 6
Figure 6
Orientation tuning in cortical neurons of the primary visual cortex (V1). (A) Orientation tuning exhibited by a simple cell in cat V1. The cell responded with spiking to a vertical bar. The response decreased when the bar angle became more horizontal, showing that the cell was tuned to a vertical angle orientation. Adapted with permission from Hubel and Wiesel (79). (B) A representative simple cell receptive field from and orientation column in tree shrew V1, which shows ON (red) and OFF (blue) subfields. An OFF subfield is flanked by two ON subfields. The angle of the two ON subfields determines the tuning orientation (yellow bar). Adapted with permission from Lee et al. (81).
Figure 7
Figure 7
Direction-selective responses and tuning directions. (A) Representative spike responses from a retinal ON–OFF direction-selective ganglion cell in response to a bar moving in eight directions. This ganglion cell responded with significant spiking to a bar moving in a bottom-right direction but responded less to a bar moving in a top-left direction. (B) A schematic showing the four cardinal directions—dorsal, ventral, nasal, and temporal.
Figure 8
Figure 8
Optomotor reflex and looming-stimulus experiments. (A) A schematic showing the optomotor reflex testing device. A mouse is placed on a stage in the middle of the enclosure and observes moving gratings shown on monitors. If the mouse sees the gratings, it chases the motion by moving its head. The camera on top of the enclosure captures an image of the mouse head and the experimenter judges whether the mouse can see the grating movement. (B) A schematic showing the looming-stimulus and mouse behavior experiments. A mouse is placed in an arena with a shelter (orange hut). A stimulus display is placed on the arena ceiling. After acclimation, the monitor shows a rapidly expanding black circle (upper panels). The mouse shows a fear response, either dashing to the hut (flight) or freezing.

References

    1. Wassle H. Parallel processing in the mammalian retina. Nat Rev Neurosci (2004) 5:747–57. doi: 10.1038/nrn1497 - DOI - PubMed
    1. Livingstone MS, Hubel DH. Psychophysical evidence for separate channels for the perception of form, color, movement, and depth. J Neurosci (1987) 7:3416–68. doi: 10.1523/JNEUROSCI.07-11-03416.1987 - DOI - PMC - PubMed
    1. Livingstone M, Hubel D. Segregation of form, color, movement, and depth: Anatomy, physiology, and perception. Science (1988) 240:740–9. doi: 10.1126/science.3283936 - DOI - PubMed
    1. Baylor DA. Photoreceptor signals and vision. proctor lecture. Invest Ophthalmol Vis Sci (1987) 28:34–49. - PubMed
    1. Schmidt BP, Boehm AE, Tuten WS, Roorda A. Spatial summation of individual cones in human color vision. PloS One (2019) 14:E0211397. doi: 10.1371/journal.pone.0211397 - DOI - PMC - PubMed

LinkOut - more resources