. 2023 Apr 7;380(6640):93-101.
doi: 10.1126/science.ade3925. Epub 2023 Mar 16.

Decrypting drug actions and protein modifications by dose- and time-resolved proteomics

Affiliations

Decrypting drug actions and protein modifications by dose- and time-resolved proteomics

Jana Zecha et al. Science. .

Abstract

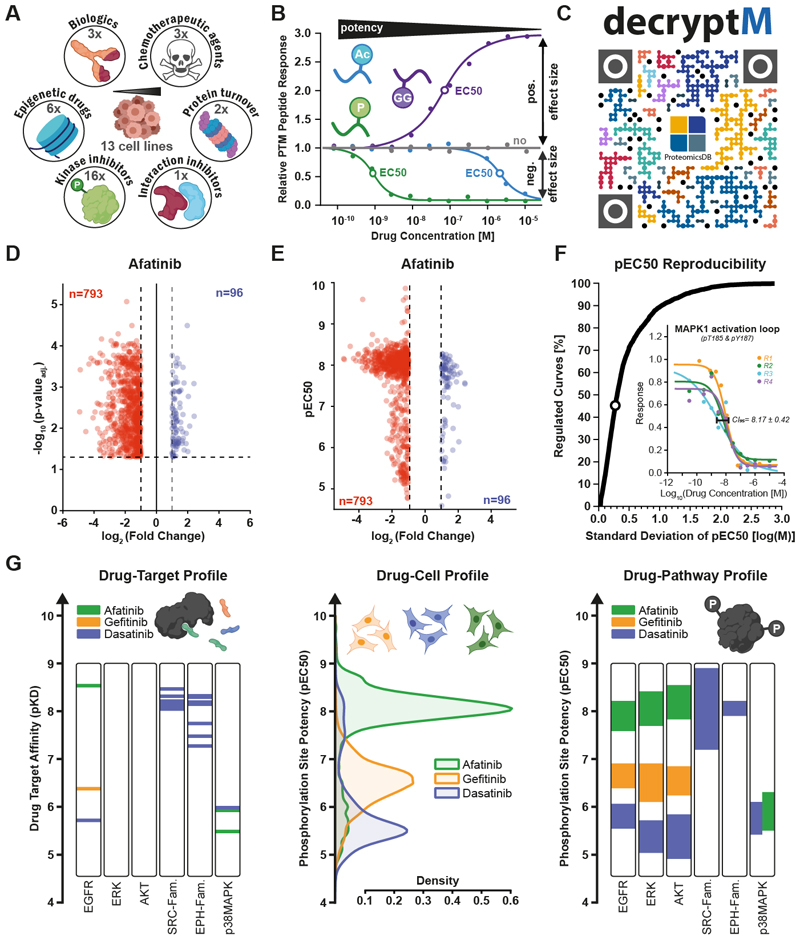
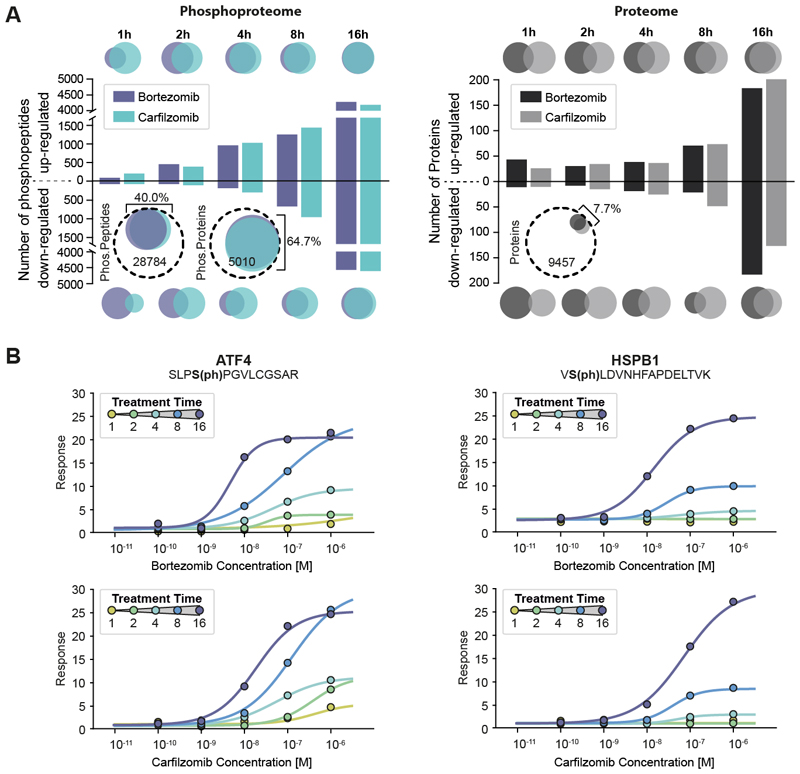
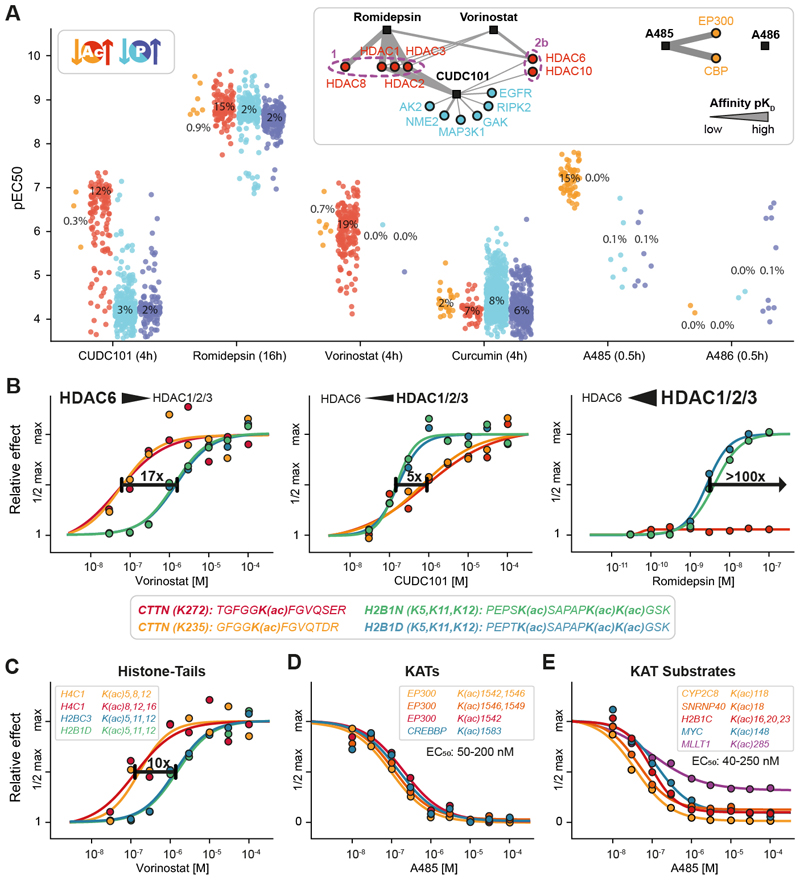
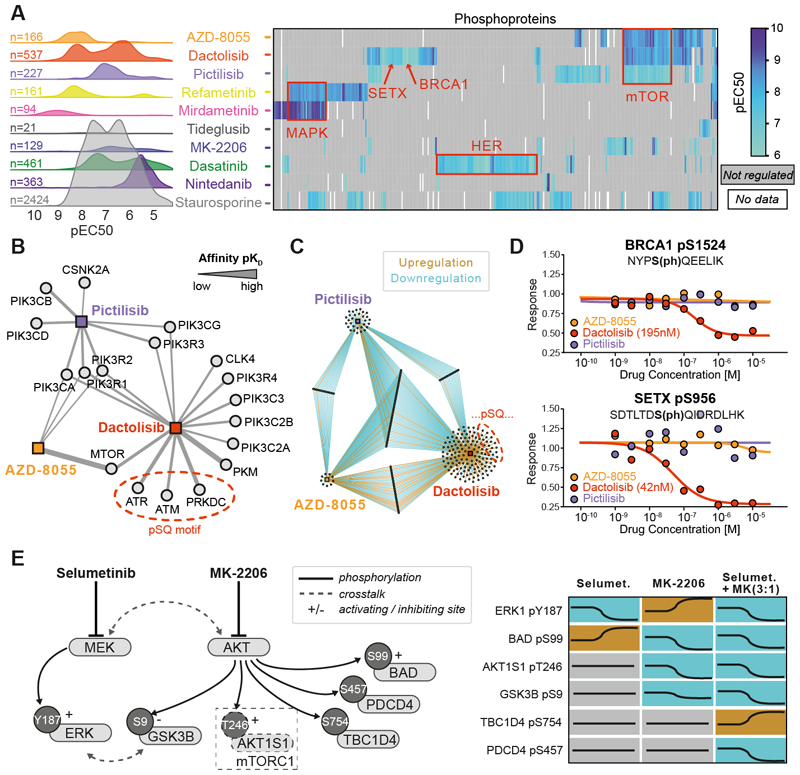
Although most cancer drugs modulate the activities of cellular pathways by changing posttranslational modifications (PTMs), little is known regarding the extent and the time- and dose-response characteristics of drug-regulated PTMs. In this work, we introduce a proteomic assay called decryptM that quantifies drug-PTM modulation for thousands of PTMs in cells to shed light on target engagement and drug mechanism of action. Examples range from detecting DNA damage by chemotherapeutics, to identifying drug-specific PTM signatures of kinase inhibitors, to demonstrating that rituximab kills CD20-positive B cells by overactivating B cell receptor signaling. DecryptM profiling of 31 cancer drugs in 13 cell lines demonstrates the broad applicability of the approach. The resulting 1.8 million dose-response curves are provided as an interactive molecular resource in ProteomicsDB.


Conflict of interest statement

Competing interests:

BK and MW are founders and shareholders of OmicScouts and MSAID. They have no operational role in either company. HH is co-founder, shareholder and CEO of OmicScouts. TH, LR, AyS, and GS are present or past employees of OmicScouts. JZ is currently an employee of AstraZeneca, SvW an employee of Novartis, and FMH an employee of OmicEra Diagnostics GmbH, but all of the work in this study has been performed while at TUM. All other authors declare no competing interests.

Figures

Fig. 1
Fig. 1. DecryptM profiling of therapeutic drugs reveals essential details of their molecular mechanism of action.
(A) Schematic representation of the data set comprising 31 drugs from six different classes and 14 cellular models. (B) Schematic representation of the 1.8 million drug dose-response curves obtained for proteins or post-translationally modified peptides by LC-MS/MS (P, phosphorylation; GG, ubiquitinylation; Ac, acetylation). For each peptide, PTM site, or protein, the half-maximal effective concentration (EC50) and the cellular effect size was determined. (C) QR code linking to ProteomicsDB where all dose-response curves can be interactively explored. (D) Volcano plot summarizing replicate (n=4) single-dose afatinib treatments of A-431 cells (10 μM drug concentration, t-test p-value multiple testing corrected at 1% FDR, fold change cut-off of 2). Each dot is one phosphopeptide (blue: upregulated by drug, red: down-regulated). Volcano plots for dasatinib and gefitinib can be found in Fig. S4A. (E) Same as panel D, but providing potency information for each regulated phosphopeptide (pEC50 = -logEC50). Not-regulated phosphopeptides were omitted for clarity. Potency plots for Dasatinib and Gefitinib can be found inFig. S4B. (F) Cumulative distribution plot shows the reproducibility of pEC50 estimations from replicate dose-response analysis (n=4) of afatinib, gefitinib, and dasatinib. Seventy-two percent of all pEC50 estimates were reproducible within ½ log step of drug concentration. The inset shows replicate dose response curves (along with the confidence interval at 95%) for the activation loop peptide of MAPK1 as a representative example, indicated by the dot in the cumulative distribution. (G) Left panel: in-vitro drug-target affinities of afatinib, gefitinib and dasatinib measured by Kinobeads assays (pKD = -logKD) (2) for selected kinases. Middle panel: in-cellulo potency (pEC50) distributions of phosphorylation sites regulated by the same drugs in A-431 cells. Right panel: same as middle panel but grouping regulated phosphopeptides by kinase substrate sites in annotated pathways (PhosphoSitePlus; Table S1).
Fig. 2
Fig. 2. Two-dimensional (2D) decryptM analysis of covalent proteasome inhibitors highlighting how cells mount a massive stress response.
(A) Left panel: Bar plot showing the number of dose-dependently up- or down-regulated phosphopeptides at a given time of treatment with bortezomib and carfilzomib in RPMI8226 cells. The Venn diagrams at the top and bottom illustrate the number (size) and overlap of phosphopeptides between the two drugs at a given time point. The circled Venn diagrams illustrate the total (dashed line) and regulated fraction (colored circles) of phosphopeptides and proteins detected for the two drugs. Right panel: same as left panel but for protein expression. (B) Examples for 2D decryptM profiles for bortezomib (top row) and carfilzomib (bottom row) for two exemplary phosphopeptides on proteins involved in cellular stress responses (AFT4, HSPB1).
Fig. 3
Fig. 3. Phosphorylation and acetylation decryptM signatures of epigenetic drugs delineate substrate preferences of KDACs and KATs.
(A) Strip plots of the cellular potency (pEC50) of drug-regulated acetylated (red) and phosphorylated peptides (blue). The insets show the affinity networks of targets engaged by the drugs determined by Kinobeads, KDAC-beads, or recombinant KAT assays. The strength of the line indicates the potency of drug:target interactions (apparent dissociation constant Kdapp;Table S2) (2, 16, 21). The treatment time is indicated in parenthesis next to drug names and percentages indicate the proportion of regulated PTM peptides vs. all PTM peptides measured in the assay. (B) Examples of cellular dose-response curves for three HDAC inhibitors illustrating the different potencies by which these drugs regulate cellular acetylation levels on cortactin or histones. (C) Same as panel B, but for several acetylation sites on histone tails. (D) Same as panel B, but for auto-acetylation sites on KATs after KAT inhibitor A485 treatment. (E) Same as panel B, but for known and putative novel KAT substrate acetylation sites.
Fig. 4
Fig. 4. DecryptM analysis of kinase inhibitors identifies drug-specific signatures and place phosphorylation sites into functional contexts.
(A) Left panel: decryptM- derived potency distribution plots of the number of phosphopeptides regulated by 10 kinase inhibitors in A549 cells. Right panel: pEC50 heatmap summarizing drug effects on annotated substrates of kinases or pathway members (red boxes). Not-regulated or missing values are shown in gray or white, respectively. (B) Affinity network (based on Kinobeads assays in pKD) of kinases inhibited by the three designated PI3K/mTOR inhibitors Pictilisib, AZD8055, and dactolisib. The strength of the line indicates the affinity of drug:target interactions (C) Network of phosphopeptides regulated by the same three drugs as in panel B. (D) Example dose-response curves for pSQ-sites on BRCA1 and SETX that were uniquely regulated by dactolisib. (E) Schematic representation of cross-talk between the MAPK and AKT pathways and dose-dependent phosphorylation changes by selumetinib and MK-2206 alone or in combination (concentration ratio of 3:1).
Fig. 5
Fig. 5. DecryptM analysis of rituximab reveals antibody-based killing of B-cells via activation of the BCR-MAPK signalling axis.
(A) Viability assays of rituximab (RTX) sensitive and resistant cell lines. (B) Protein expression of B-cell receptor and lipid raft components in the same cell lines. (C) Number of dose-response regulated phosphopeptides at different times of RTX treatment for the same cell lines (left axis, bars) and the kinetics of RTX binding to these cells (right axis, lines). (D) Temporal dynamics of apoptosis induction upon addition of RTX to SUDHL-4 cells with and without prior siRNA-mediated knock-down of B-cell receptor and lipid raft components. Induction of apoptosis was monitored by annexin V-labeling using live cell imaging. Shaded areas indicate the standard deviation of replicate experiments (n=3). (E) Summary representation of the major five pathways involved in BCR-signaling and working model based on time- and dose-resolved decryptM profiles as well as pharmacological inhibition of certain proteins (yellow) of how engagement of these pathways (or lack thereof) leads to RTX-mediated cell death. Figures in red indicate the fold change of RTX-induced phosphorylation regulation.

Comment in

References

    1. Benns HJ, Wincott CJ, Tate EW, Child MA. Activity- and reactivity-based proteomics: Recent technological advances and applications in drug discovery. Curr Opin Chem Biol. 2021;60:20–29. - PubMed
    1. Klaeger S, et al. The target landscape of clinical kinase drugs. Science. 2017;358 - PMC - PubMed
    1. Lill JR, Mathews WR, Rose CM, Schirle M. Proteomics in the pharmaceutical and biotechnology industry: a look to the next decade. Expert Rev Proteomics. 2021;18:503–526. - PubMed
    1. Savitski MM, et al. Tracking cancer drugs in living cells by thermal profiling of the proteome. Science. 2014;346:1255784. - PubMed
    1. Budayeva HG, et al. Phosphoproteome Profiling of the Receptor Tyrosine Kinase MuSK Identifies Tyrosine Phosphorylation of Rab GTPases. Mol Cell Proteomics. 2022;21:100221. - PMC - PubMed

MeSH terms