. 2023 Mar:7:e2200439.
doi: 10.1200/PO.22.00439.

Pathway Alterations in Stage II/III Primary Melanoma

Affiliations

Pathway Alterations in Stage II/III Primary Melanoma

Caroline E Kostrzewa et al. JCO Precis Oncol. 2023 Mar.

Abstract

Purpose: Genomic classification of melanoma has thus far focused on the mutational status of BRAF, NRAS, and NF1. The clinical utility of this classification remains limited, and the landscape of alterations in other oncogenic signaling pathways is underexplored.

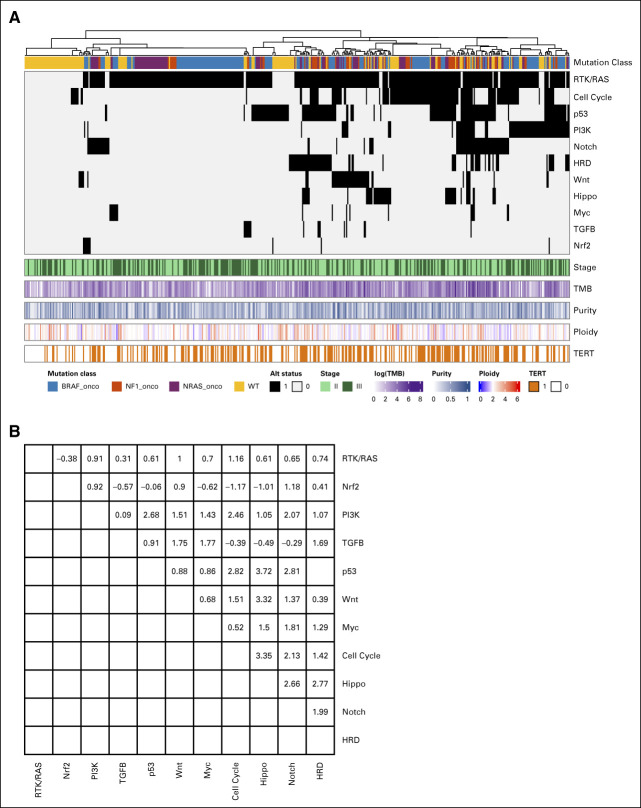
Methods: Using primary samples from the InterMEL study, a retrospective cohort of cases with specimens collected from an international consortium with participating institutions throughout the United States and Australia, with oversampling of cases who ultimately died of melanoma, we examined mutual exclusivity and co-occurrence of genomic alterations in 495 stage II/III primary melanomas across 11 cancer pathways. Somatic mutation and copy number alterations were analyzed from next-generation sequencing using a clinical sequencing panel.

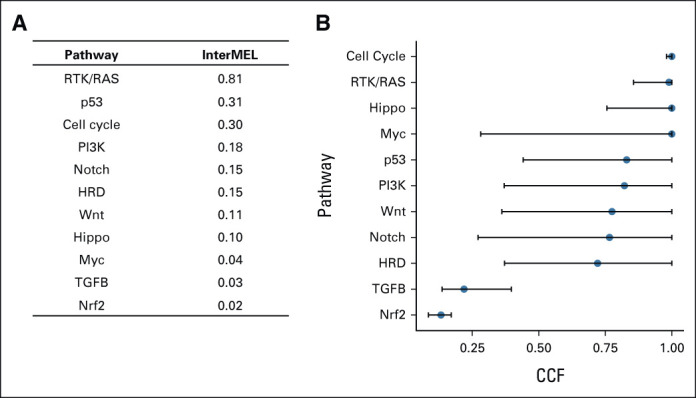
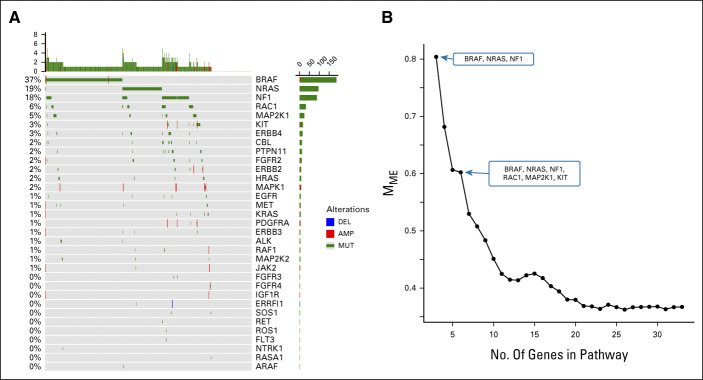
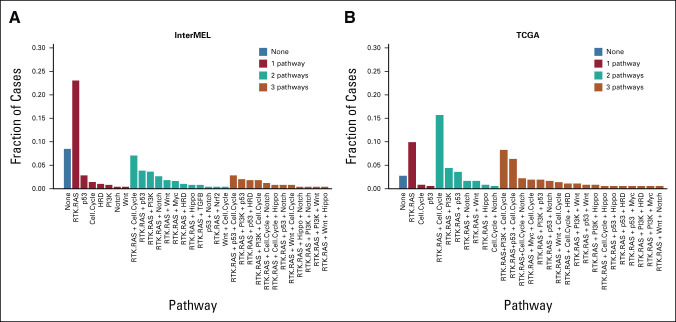
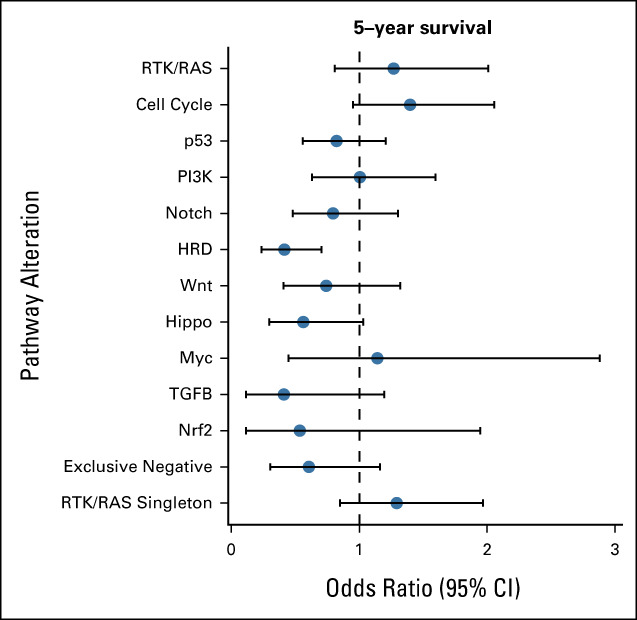
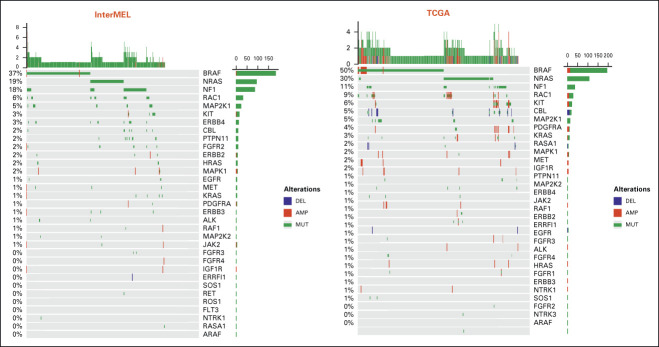
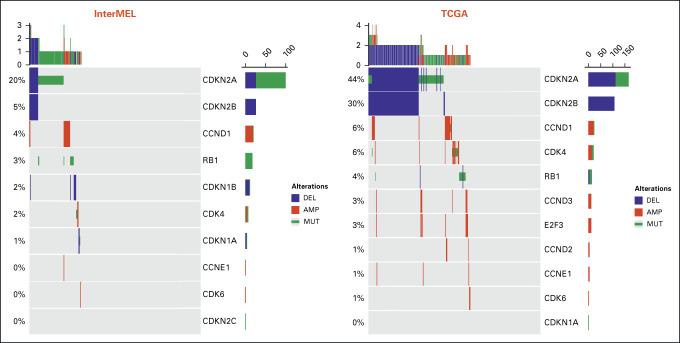
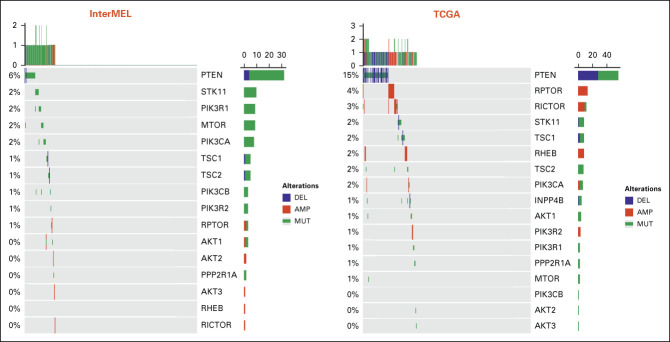
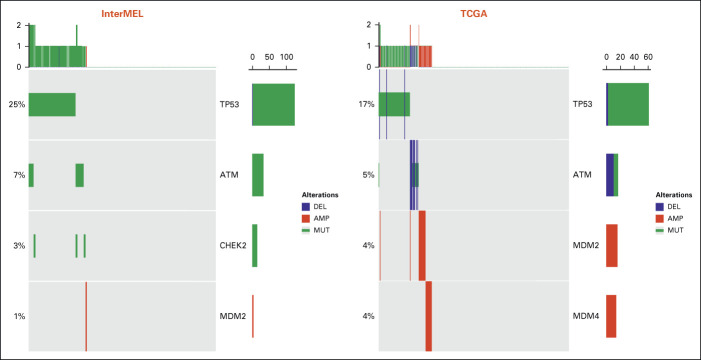
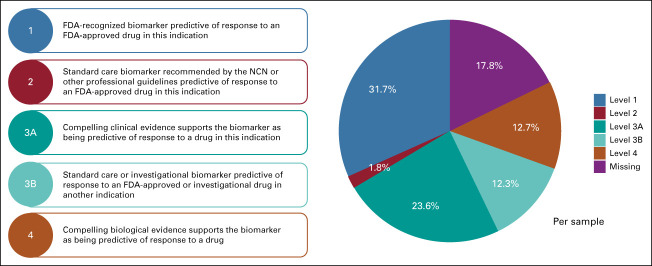
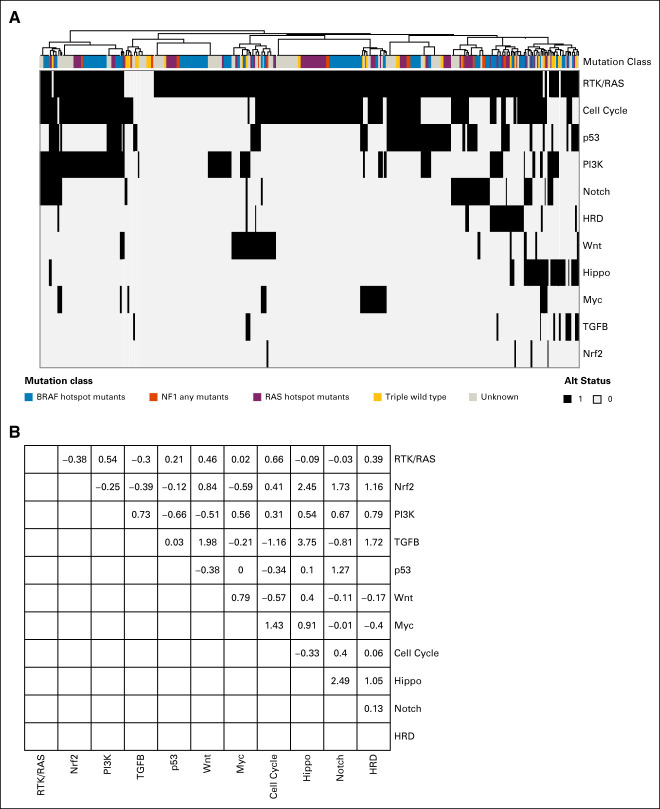
Results: Mutations in the RTK-RAS pathway were observed in 81% of cases. Other frequently occurring pathways were TP53 (31%), Cell Cycle (30%), and PI3K (18%). These frequencies are generally lower than was observed in The Cancer Genome Atlas, where the specimens analyzed were predominantly obtained from metastases. Overall, 81% of the cases had at least one targetable mutation. The RTK-RAS pathway was the only pathway that demonstrated strong and statistically significant mutual exclusivity. However, this strong mutual exclusivity signal was evident only for the three common genes in the pathway (BRAF, NRAS, and NF1). Analysis of co-occurrence of different pathways exhibited no positive significant trends. However, interestingly, a high frequency of cases with none of these pathways represented was observed, 8.4% of cases versus 4.0% expected (P < .001). A higher frequency of RTK-RAS singletons (with no other pathway alteration) was observed compared with The Cancer Genome Atlas. Clonality analyses suggest strongly that both the cell cycle and RTK-RAS pathways represent early events in melanogenesis.

Conclusion: Our results confirm the dominance of mutations in the RTK-RAS pathway. The presence of many mutations in several well-known, actionable pathways suggests potential avenues for targeted therapy in these early-stage cases.


Conflict of interest statement

The following represents disclosure information provided by authors of this manuscript. All relationships are considered compensated unless otherwise noted. Relationships are self-held unless noted. I = Immediate Family Member, Inst = My Institution. Relationships may not relate to the subject matter of this manuscript. For more information about ASCO's conflict of interest policy, please refer to www.asco.org/rwc or ascopubs.org/po/author-center.

Open Payments is a public database containing information reported by companies about payments made to US-licensed physicians (Open Payments).

Figures

FIG 1.
FIG 1.
Oncogenic signaling pathway alteration in 495 stage II/III melanoma samples. (A) Pathway alteration frequency in the InterMEL cohort. (B) Pathway gene clonality. Median (blue dot) along with IQR (black line) of the estimated CCF across gene alterations within each pathway are plotted. CCF close to 1 indicates clonal events. CCF, cancer cell fraction; IQR, interquartile range.
FIG 2.
FIG 2.
Patterns of alteration within the RTK-RAS pathway. (A) Oncoprint plot of the RTK-RAS pathway alterations displays the pattern of mutual exclusivity. (B) Decreasing trend of mutual exclusivity as genes are sequentially added in the pathway by their alteration frequency.
FIG 3.
FIG 3.
Pathway co-occurrence. (A) Fractions of InterMEL tumors (n = 495) that involve no pathways, one pathway, two pathways, or three pathways. (B) Fractions of TCGA tumors (n = 363) that involve no pathways, one pathway, two pathways, or three pathways. Note that the category (none) represents the exclusive negative cases where none of the 11 pathways are represented. TCGA, The Cancer Genome Atlas.
FIG 4.
FIG 4.
Co-occurrence patterns across the pathways. (A) Tumors are sorted by hierarchical clustering of the 11 pathway alteration status. Mutation class denotes the oncogenic mutation status of BRAF, NF1, NRAS, and the triple wild type (yellow). Stage, TMB, tumor ploidy, organ recurrence, and 5-year survival are annotated. (B) Pairwise co-occurrence z score. TMB, total mutation burden.
FIG 5.
FIG 5.
Pathway association with 5-year survival status. Forest plot of odds ratio along with 95% CI is presented.
FIG A1.
FIG A1.
Oncoprint plot of the RTK-RAS pathway in the InterMEL cohort (n = 495) v in the TCGA (n = 363) cohort. The TCGA analysis was restricted to the MSK-IMPACT genes and using the same oncogenic mutation annotation. TCGA, The Cancer Genome Atlas.
FIG A2.
FIG A2.
Oncoprint plot of the Cell Cycle pathway in the InterMEL cohort (n = 495) v in the TCGA (n = 363) cohort. The TCGA analysis was restricted to the MSK-IMPACT genes and using the same oncogenic mutation annotation. TCGA, The Cancer Genome Atlas.
FIG A3.
FIG A3.
Oncoprint plot of the PI3K pathway in the InterMEL cohort (n = 495) v in the TCGA (n = 363) cohort. The TCGA analysis was restricted to the MSK-IMPACT genes and using the same oncogenic mutation annotation. TCGA, The Cancer Genome Atlas.
FIG A4.
FIG A4.
Oncoprint plot of the p53 pathway in the InterMEL cohort (n = 495) v in the TCGA (n = 363) cohort. The TCGA analysis was restricted to the MSK-IMPACT genes and using the same oncogenic mutation annotation. TCGA, The Cancer Genome Atlas.
FIG A5.
FIG A5.
OncoKB annotation of targetable alterations in the InterMEL cases. FDA, US Food and Drug Administration.
FIG A6.
FIG A6.
Co-occurrence patterns across the pathways in TCGA (n = 363). (A) Tumors are sorted by hierarchical clustering of the 11 pathway alteration status. Mutation class denotes the oncogenic mutation status of BRAF, NF1, NRAS, and the triple wild type (yellow). (B) Pairwise co-occurrence z score. TCGA, The Cancer Genome Atlas.

References

    1. Romano E, Scordo M, Dusza SW, et al. Site and timing of first relapse in stage III melanoma patients: Implications for follow-up guidelines. J Clin Oncol. 2010;28:3042–3047. - PMC - PubMed
    1. Lee AY, Droppelmann N, Panageas KS, et al. Patterns and timing of initial relapse in pathologic stage II melanoma patients. Ann Surg Oncol. 2017;24:939–946. - PMC - PubMed
    1. The Cancer Genome Atlas Network Genomic classification of cutaneous melanoma. Cell. 2015;161:1681–1696. - PMC - PubMed
    1. Shoushtari AN, Chatila WK, Arora A, et al. Therapeutic implications of detecting MAPK-activating alterations in cutaneous and unknown primary melanomas. Clin Cancer Res. 2021;27:2226–2235. - PMC - PubMed
    1. Chapman PB, Hauschild A, Robert C, et al. Improved survival with vemurafenib in melanoma with BRAF V600E mutation. N Engl J Med. 2011;364:2507–2516. - PMC - PubMed

Publication types

Substances