. 2023 Apr 28;132(9):e116-e133.
doi: 10.1161/CIRCRESAHA.122.321858. Epub 2023 Mar 17.

Enhanced Ca2+-Dependent SK-Channel Gating and Membrane Trafficking in Human Atrial Fibrillation

Affiliations

Enhanced Ca2+-Dependent SK-Channel Gating and Membrane Trafficking in Human Atrial Fibrillation

Jordi Heijman et al. Circ Res. .

Abstract

Background: Small-conductance Ca2+-activated K+ (SK)-channel inhibitors have antiarrhythmic effects in animal models of atrial fibrillation (AF), presenting a potential novel antiarrhythmic option. However, the regulation of SK-channels in human atrial cardiomyocytes and its modification in patients with AF are poorly understood and were the object of this study.

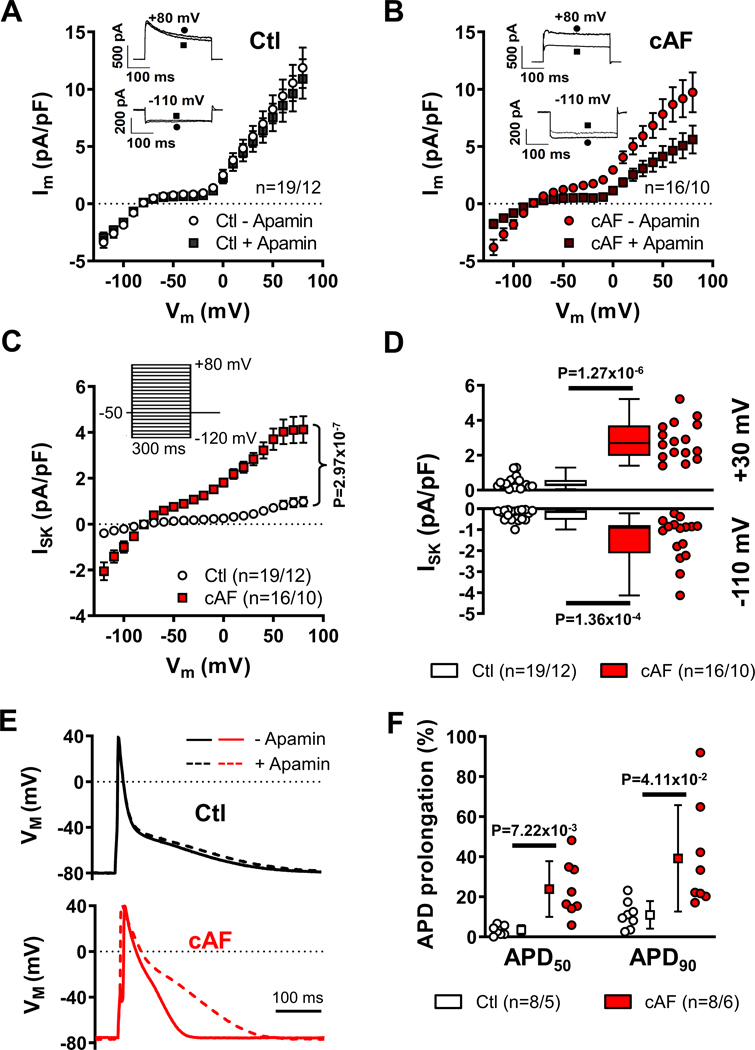
Methods: Apamin-sensitive SK-channel current (ISK) and action potentials were recorded in human right-atrial cardiomyocytes from sinus rhythm control (Ctl) patients or patients with (long-standing persistent) chronic AF (cAF).

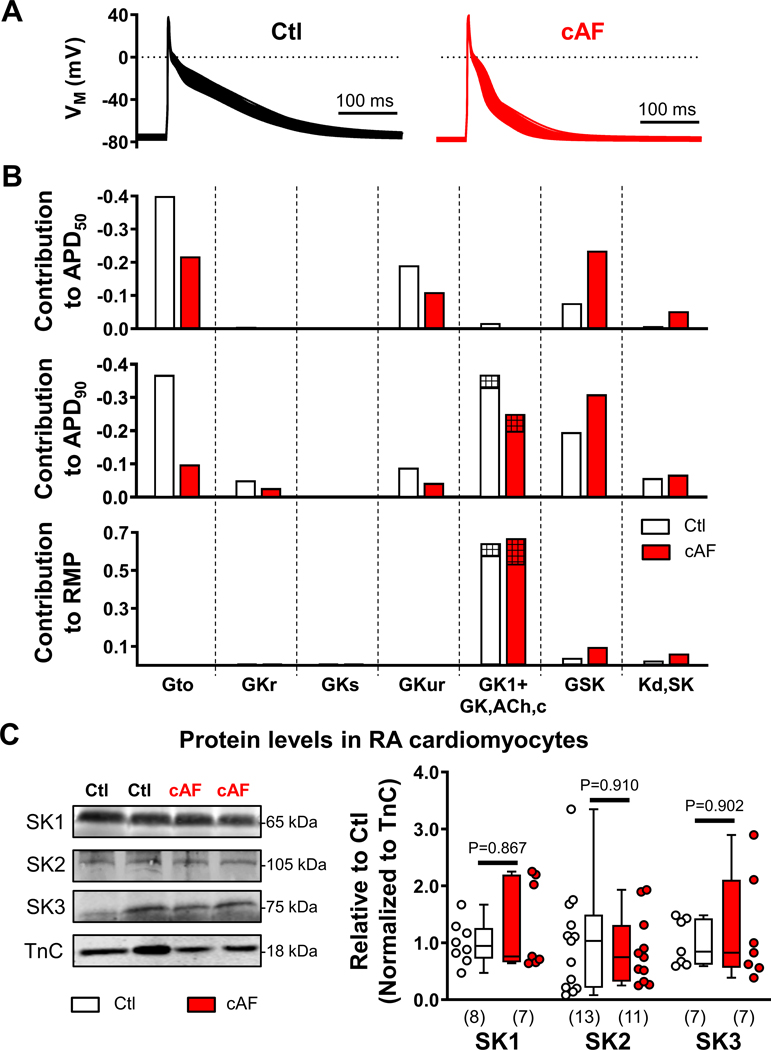
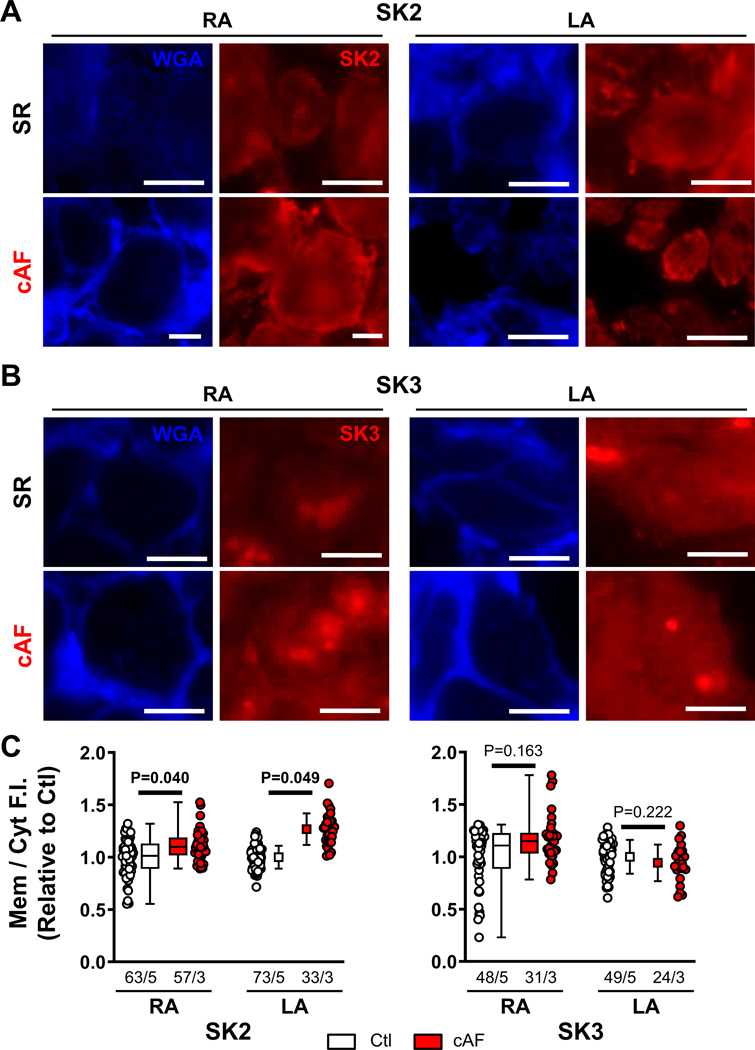
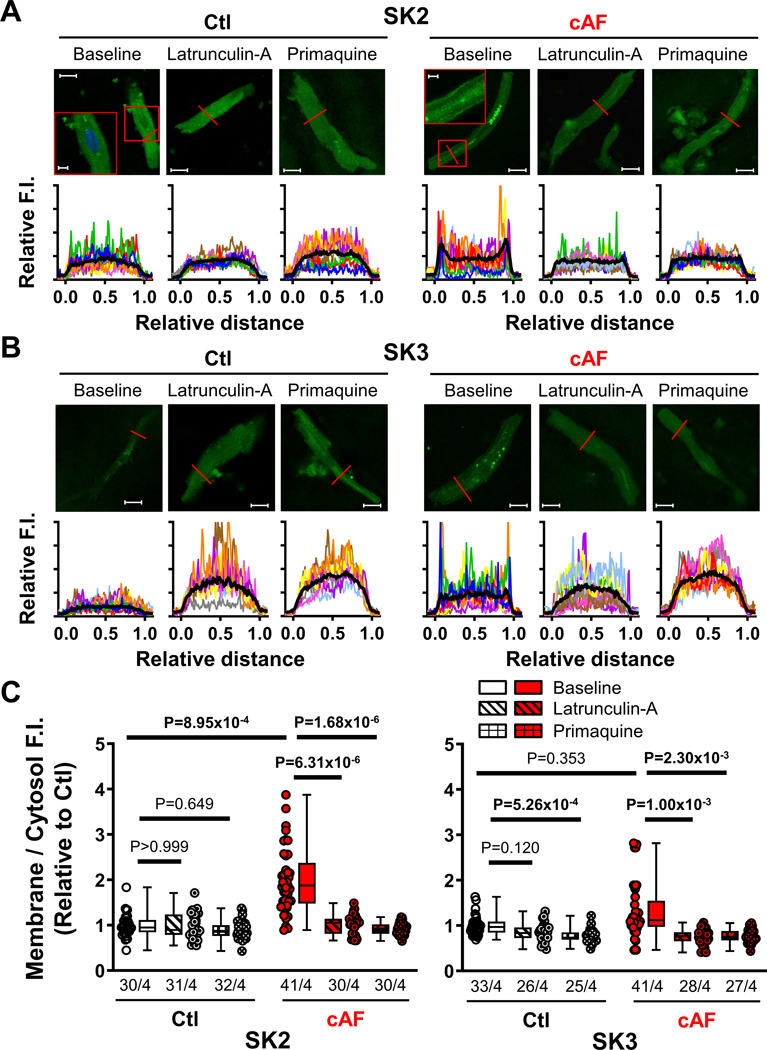
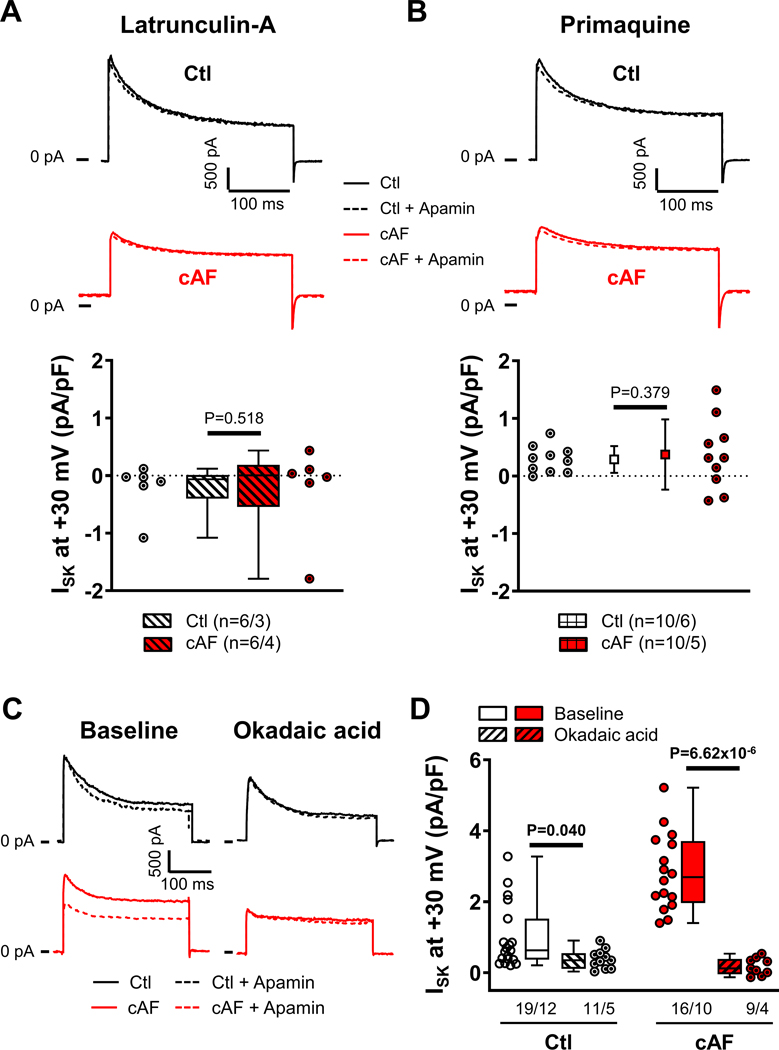
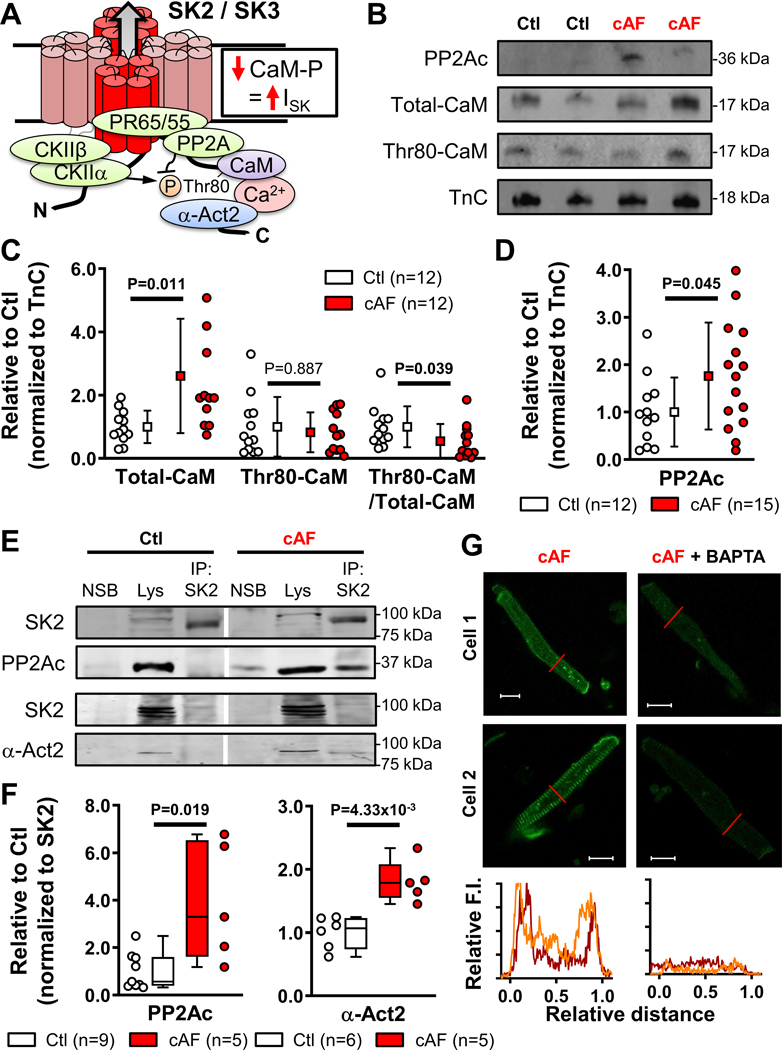
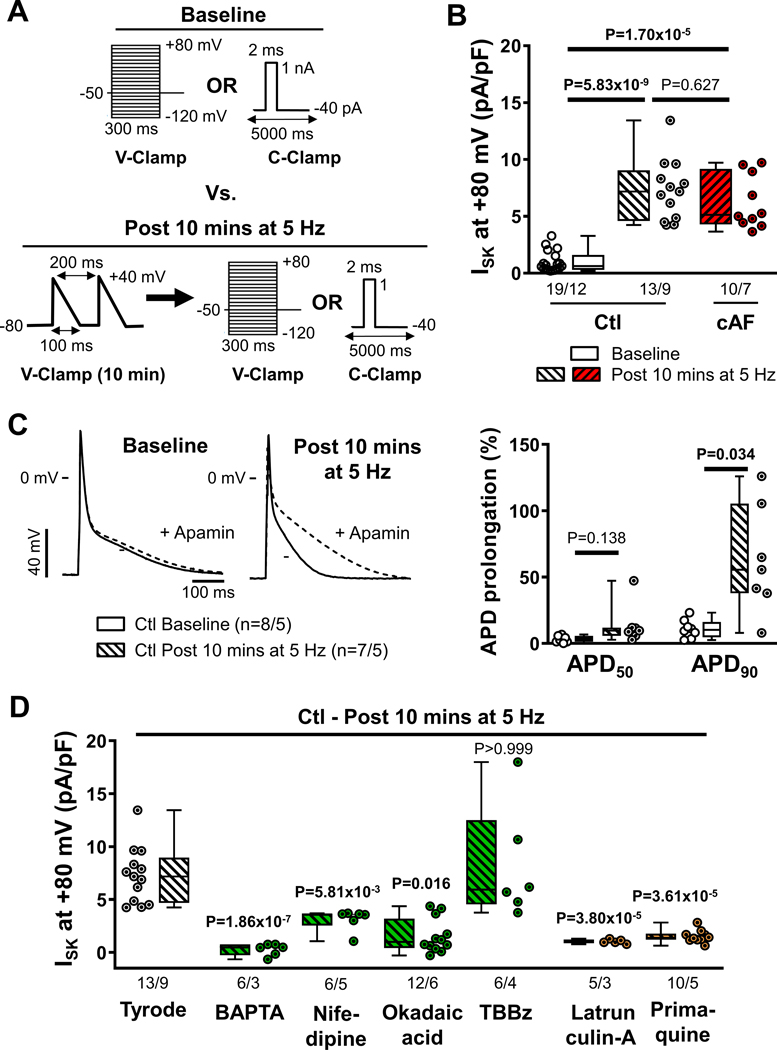
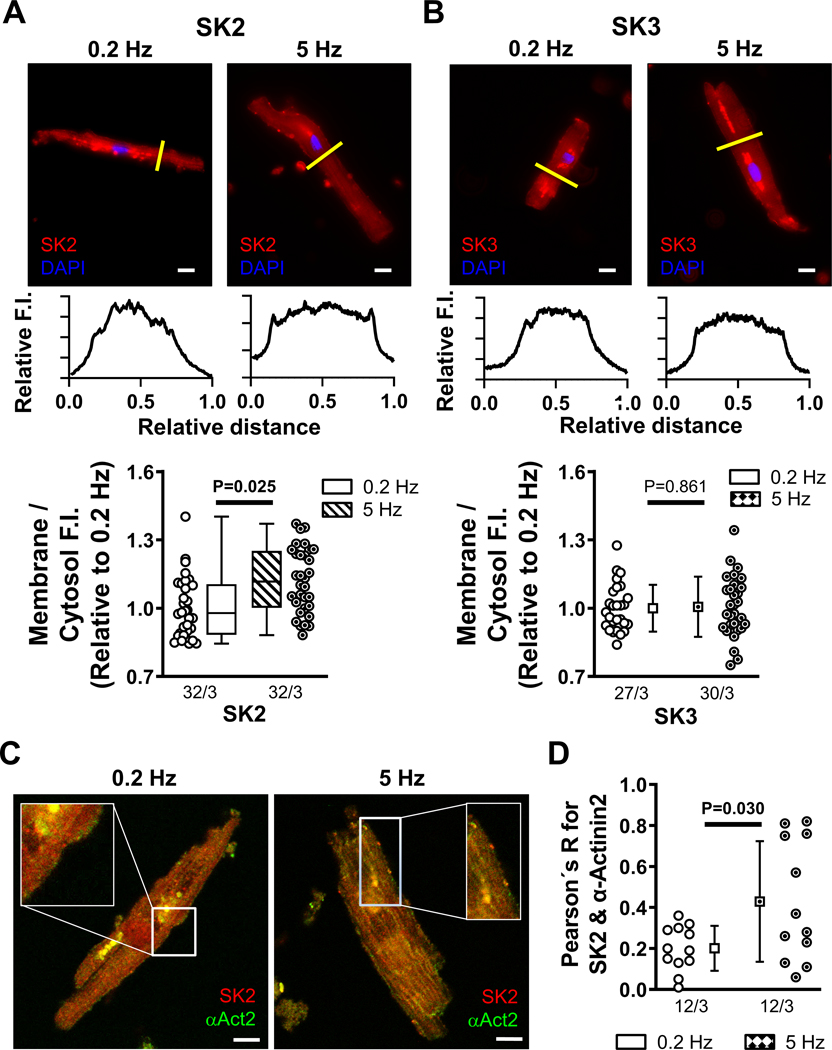
Results: ISK was significantly higher, and apamin caused larger action potential prolongation in cAF- versus Ctl-cardiomyocytes. Sensitivity analyses in an in silico human atrial cardiomyocyte model identified IK1 and ISK as major regulators of repolarization. Increased ISK in cAF was not associated with increases in mRNA/protein levels of SK-channel subunits in either right- or left-atrial tissue homogenates or right-atrial cardiomyocytes, but the abundance of SK2 at the sarcolemma was larger in cAF versus Ctl in both tissue-slices and cardiomyocytes. Latrunculin-A and primaquine (anterograde and retrograde protein-trafficking inhibitors) eliminated the differences in SK2 membrane levels and ISK between Ctl- and cAF-cardiomyocytes. In addition, the phosphatase-inhibitor okadaic acid reduced ISK amplitude and abolished the difference between Ctl- and cAF-cardiomyocytes, indicating that reduced calmodulin-Thr80 phosphorylation due to increased protein phosphatase-2A levels in the SK-channel complex likely contribute to the greater ISK in cAF-cardiomyocytes. Finally, rapid electrical activation (5 Hz, 10 minutes) of Ctl-cardiomyocytes promoted SK2 membrane-localization, increased ISK and reduced action potential duration, effects greatly attenuated by apamin. Latrunculin-A or primaquine prevented the 5-Hz-induced ISK-upregulation.

Conclusions: ISK is upregulated in patients with cAF due to enhanced channel function, mediated by phosphatase-2A-dependent calmodulin-Thr80 dephosphorylation and tachycardia-dependent enhanced trafficking and targeting of SK-channel subunits to the sarcolemma. The observed AF-associated increases in ISK, which promote reentry-stabilizing action potential duration shortening, suggest an important role for SK-channels in AF auto-promotion and provide a rationale for pursuing the antiarrhythmic effects of SK-channel inhibition in humans.

Keywords: actinin; apamin; atrial fibrillation; atrial remodeling; calmodulin; protein phosphatase-2A; protein transport.


Conflict of interest statement

Disclosures

The authors have no relevant conflicts of interest to disclose.

Figures

Figure 1.
Figure 1.. Small-conductance Ca2+-activated K+-current (ISK) in right-atrial (RA) Ctl- and cAF-cardiomyocytes.
A-B, Membrane current during 300-ms voltage-clamp pulses from −120 mV to +80 mV with 500-nmol/L intracellular Ca2+ in the absence or presence of 100-nmol/L apamin in Ctl- or cAF-cardiomyocytes. Insets show representative examples at −110 mV and +80 mV. C, Voltage-dependence of apamin-sensitive ISK in Ctl (white symbols) or cAF (red symbols). D, Comparison of apamin-sensitive ISK between Ctl and cAF at +30 mV and −110 mV. N-numbers indicate numbers of cardiomyocytes/patients. E, Representative action potentials in the absence or presence of 100-nmol/L apamin in a Ctl- or cAF-cardiomyocyte in the presence of 500-nmol/L intracellular Ca2+. F, Relative apamin-induced prolongation of action potential duration at 50% or 90% of repolarization (APD50 and APD90) in Ctl and cAF. P-values are based on two-way ANOVA with repeated measures for VM (C) or multilevel mixed models with log-transformed data (D) or regular data (F) to account for non-independent measurements in multiple cells from individual patients.
Figure 2.
Figure 2.. Relative contribution of small-conductance Ca2+-activated K+ (SK)-current and other K+-currents to action potential (AP) duration and resting membrane potential (RMP) in the in silico human atrial cardiomyocyte model and protein levels of SK channel subunits in right-atrial (RA)-cardiomyocytes from Ctl- and cAF-patients.
A, Steady-state APs during 1-Hz pacing in the populations of Ctl (left) and cAF (right) models. B, Relative contribution of the maximal conductance of the transient-outward K+-current (Gto); rapid, slow or ultra-rapid delayed-rectifier K+-currents (GKr, GKs and GKur, respectively); basal inward-rectifier K+-current (composed of GK1, empty bars; and constitutively-active acetylcholine-activated inward-rectifier K+ current GK,ACh,c, hatched bars, 10% in Ctl and 20% in cAF); and SK-current (GSK), as well as affinity of SK-current for intracellular Ca2+ (Kd,SK) to AP duration at 50%- or 90%-repolarization (APD50; APD90) or RMP in Ctl (white bars) or cAF (red bars) model populations. Each bar represents a regression coefficient linking a certain model parameter to a certain AP feature. The coefficient can be used to predict the value of each AP feature after applying a known perturbation in the baseline value of the model parameter, as detailed in the online-only Data Supplement. C, Representative Western blots (left) and quantification of SK1, SK2 and SK3 proteins in RA-cardiomyocytes from Ctl- and cAF-patients. N-numbers indicate number of patients. P-values are based on Mann-Whitney tests comparing Ctl vs. cAF.
Figure 3.
Figure 3.. Immunostaining of small-conductance Ca2+-activated K+ (SK)-channel isoforms in human atrial cardiomyocytes of right- and left-atrial (RA and LA) tissue slices.
A, Representative wheat germ agglutinin (WGA) and SK2 staining in RA (left) and LA (right) tissue slices of Ctl (top) and cAF patients (bottom). Scale bars indicate 10-μm. B, Similar to panel A for WGA and SK3. C, Quantification of average fluorescence intensity (F.I.) of SK2 (left) or SK3 (right) at the membrane compared to the cytosol in the RA and LA for Ctl- and cAF-patients. Membrane regions were delineated based on WGA staining as shown in Figures S16–S18. Data are normalized to corresponding Ctl-cardiomyocytes. N-numbers indicate numbers of cardiomyocytes/patients. P-values are based on multilevel mixed models with log-transformed data (RA) or regular data (LA) to account for non-independent measurements in multiple cells from individual patients.
Figure 4.
Figure 4.. Membrane localization and trafficking of small-conductance Ca2+-activated K+ (SK)-channel isoforms.
A, Representative immunocytochemistry of SK2 in right-atrial (RA)-cardiomyocytes from Ctl- and cAF-patients at baseline or after inhibition of anterograde or retrograde protein trafficking with latrunculin-A (1-μmol/L for 2-hours) or primaquine (120-μmol/L for 4-hours), respectively. Lower panels show transversal line profiles of fluorescence intensity (F.I.) for all cardiomyocytes (thin colored lines), as well as the average across all cells (thick black lines). Scale bars indicate 15-μm (5-μm in the insets). B, Similar to panel A for SK3. Data for SK1 are provided in Figure S19. C, Average F.I. of SK2 (left) or SK3 (right) at the membrane (first and last 10% of cell width) compared to the cytosol (middle 80%) for Ctl and cAF with or without latrunculin-A (diagonal-patterned bars) or primaquine (hashed bars). Data are normalized to Ctl-cardiomyocytes at baseline. N-numbers indicate numbers of cardiomyocytes/patients. P-values are based on multilevel mixed models with log-transformed data to account for non-independent measurements in multiple cells from individual patients and are Bonferroni-corrected to account for multiple comparisons.
Figure 5.
Figure 5.. Trafficking- and phosphorylation-dependent regulation of small-conductance Ca2+-activated K+-current (ISK) in right-atrial (RA)-cardiomyocytes from Ctl- and cAF-patients.
A, Representative examples (top) of membrane current during depolarizing pulses to +80 mV in the absence or presence of 100-nmol/L apamin and group data of apamin-sensitive ISK (bottom) at +30 mV in Ctl- and cAF-cardiomyocytes in the presence of the actin-depolymerizing agent latrunculin-A (1-μmol/L for 2-hours), which modulates anterograde protein trafficking. B, Similar to panel A in the presence of the early (recycling) endosomes inhibitor primaquine (120-μmol/L for 4-hours), which inhibits retrograde protein trafficking. C, Membrane current during depolarizing pulses to +80 mV in the absence (solid lines) or presence (dashed lines) of 100-nmol/L apamin for Ctl- and cAF-cardiomyocytes at baseline (left) or in the presence of PP2A-inhibition with 10-nmol/L okadaic acid (right). D, Quantification of apamin-sensitive ISK at +30 mV in atrial cardiomyocytes from Ctl- and cAF-patients at baseline (open bars) or in the presence of okadaic acid (diagonal-patterned bars). N-numbers indicate numbers of cardiomyocytes/patients. P-values are based on multilevel mixed models with log-transformed data (A,D) or regular data (B) to account for non-independent measurements in multiple cells from individual patients. P-values in (D) were Bonferroni-corrected to account for multiple comparisons.
Figure 6.
Figure 6.. Ca2+/calmodulin (CaM)-dependent regulation of small-conductance Ca2+-activated K+ (SK)-channels in human right atria (RA).
A, Schematic representation of the SK-channel macromolecular complex, including phosphorylation-dependent regulation of CaM. B, Western blots of the catalytic subunit of protein phosphatase-2a (PP2Ac), total CaM and Thr80-phosphorylated CaM in RA-cardiomyocytes from Ctl- and cAF-patients. Troponin-C (TnC) was used as loading control. C, Quantification of total and Thr80-phosphorylated calmodulin, as well as relative phosphorylation ratio in RA-cardiomyocytes from Ctl- and cAF-patients. D, Quantification of PP2Ac protein levels in RA-cardiomyocytes from Ctl- and cAF-patients. E, Representative co-immunoprecipitation experiments showing Western blots of SK2 and PP2Ac or SK2 and α-actinin-2 (α-Act2) in lysates (lys) or SK2-immunoprecipitates from RA whole-tissue homogenates of Ctl- or cAF-patients, together with negative control for non-specific binding (NSB). Vertical white lines delineate separate regions on the same gel. F, Quantification of SK2-associated PP2Ac (left) or α-Act2 in RA whole-tissue homogenates of Ctl- and cAF-patients. G, Representative immunostaining and associated line scans (bottom) of SK2 in RA-cardiomyocytes from cAF patients incubated with (right) or without BAPTA-AM (25 μmol/L for 5-hours, left). N-numbers indicate numbers of patients. P-values are based on unpaired Student’s t-test (C,D) or Mann-Whitney tests (F).
Figure 7.
Figure 7.. Tachycardia-dependent upregulation of small-conductance Ca2+-activated K+ (SK)-channels.
A, Voltage- or current-clamp protocols (V-Clamp and C-clamp, respectively) comparing baseline conditions with conditions after 10-minutes of depolarizing V-Clamp pulses mimicking action potentials (APs) delivered at 5-Hz. B, Apamin (100-nmol/L)-sensitive ISK at +80 mV in right-atrial (RA)-cardiomyocytes from Ctl-patients at baseline (open symbols) and from RA-cardiomyocytes from Ctl- or cAF-patients after 10-minutes of 5-Hz activation (diagonal-patterned bars). C, Representative APs in RA-cardiomyocytes from Ctl-patients at baseline or after 10-minutes stimulation at 5-Hz in the absence or presence of apamin (left), as well as apamin-induced prolongation of APD at 50% or 90% of repolarization (APD50 and APD90, respectively). D, Apamin-sensitive ISK at +80 mV in RA-cardiomyocytes from Ctl-patients after 10-minutes of 5-Hz activation after pre-incubation with the Ca2+-chelator BAPTA (30-μmol/L for 1-hour), L-type Ca2+-channel blocker nifedipine (1-μmol/L for 3 mins), PP2A-inhibitor okadaic acid (10-nmol/L for 1-hour) or casein kinase type-II inhibitor TBBz (10-μmol/L for 1-hour) (green bars; all affecting SK-channel gating), or latrunculin-A (1-μmol/L for 2-hours) and primaquine (120-μmol/L for 4-hours) (orange bars; both affecting SK-channel trafficking). N-numbers indicate numbers of cardiomyocytes/patients. P-values are based on multilevel mixed models with log-transformed data to account for non-independent measurements in multiple cells from individual patients and are Bonferroni-corrected to account for multiple comparisons.
Figure 8.
Figure 8.. Increased membrane localization of small-conductance Ca2+-activated K+ (SK)-channels after field stimulation.
A, Representative immunocytochemistry of SK2 in right-atrial (RA)-cardiomyocytes from Ctl-patients after 10 minutes of field stimulation at 0.2 Hz or 5 Hz. Lower panels show transversal line profiles of fluorescence intensity (F.I.). Scale bars indicate 10-μm. Bottom panel shows average F.I. of SK2 at the membrane (first and last 10% of cell width) compared to the cytosol (middle 80%) after 10 minutes of field stimulation at 0.2 Hz or 5 Hz. Data are normalized to 0.2 Hz. B, Similar to panel A for SK3. C, Representative co-staining of SK2 (red) and α-actinin2 (green) in RA-cardiomyocytes from Ctl-patients after 10 minutes of field stimulation at 0.2 Hz (left) or 5 Hz (right). Scale bars indicate 20-μm. D, Pearson’s R correlation coefficient for SK2 and α-actinin2 after 0.2 Hz and 5 Hz pacing. N-numbers indicate numbers of cardiomyocytes/patients. P-values are based on multilevel mixed models with log-transformed data (A) or regular data (B,D) to account for non-independent measurements in multiple cells from individual patients and take into account that cardiomyocytes from the same patients were used for 0.2 Hz and 5 Hz.

Comment in

References

    1. Hindricks G, Potpara T, Dagres N, Arbelo E, Bax JJ, Blomstrom-Lundqvist C, Boriani G, Castella M, Dan GA, Dilaveris PE, et al. 2020 ESC Guidelines for the diagnosis and management of atrial fibrillation developed in collaboration with the European Association for Cardio-Thoracic Surgery (EACTS): The Task Force for the diagnosis and management of atrial fibrillation of the European Society of Cardiology (ESC) Developed with the special contribution of the European Heart Rhythm Association (EHRA) of the ESC. Eur Heart J. 2021;42:373–498. doi: 10.1093/eurheartj/ehaa612 - DOI - PubMed
    1. Marrouche NF, Brachmann J, Andresen D, Siebels J, Boersma L, Jordaens L, Merkely B, Pokushalov E, Sanders P, Proff J, et al. Catheter Ablation for Atrial Fibrillation with Heart Failure. N Engl J Med. 2018;378:417–427. doi: 10.1056/NEJMoa1707855 - DOI - PubMed
    1. Kirchhof P, Camm AJ, Goette A, Brandes A, Eckardt L, Elvan A, Fetsch T, van Gelder IC, Haase D, Haegeli LM, et al. Early Rhythm-Control Therapy in Patients with Atrial Fibrillation. N Engl J Med. 2020;383:1305–1316. doi: 10.1056/NEJMoa2019422 - DOI - PubMed
    1. Nattel S, Sager PT, Huser J, Heijman J, Dobrev D. Why translation from basic discoveries to clinical applications is so difficult for atrial fibrillation and possible approaches to improving it. Cardiovasc Res. 2021;117:1616–1631. doi: 10.1093/cvr/cvab093 - DOI - PMC - PubMed
    1. Peyronnet R, Ravens U. Atria-selective antiarrhythmic drugs in need of alliance partners. Pharmacol Res. 2019;145:104262. doi: 10.1016/j.phrs.2019.104262 - DOI - PubMed

Publication types

MeSH terms