

External Validation and Comparison of a General Ward Deterioration Index Between Diversely Different Health Systems
- PMID: 36927631
- PMCID: PMC10187626
- DOI: 10.1097/CCM.0000000000005837
External Validation and Comparison of a General Ward Deterioration Index Between Diversely Different Health Systems
Abstract
Objectives: Implementing a predictive analytic model in a new clinical environment is fraught with challenges. Dataset shifts such as differences in clinical practice, new data acquisition devices, or changes in the electronic health record (EHR) implementation mean that the input data seen by a model can differ significantly from the data it was trained on. Validating models at multiple institutions is therefore critical. Here, using retrospective data, we demonstrate how Predicting Intensive Care Transfers and other UnfoReseen Events (PICTURE), a deterioration index developed at a single academic medical center, generalizes to a second institution with significantly different patient population.
Design: PICTURE is a deterioration index designed for the general ward, which uses structured EHR data such as laboratory values and vital signs.
Setting: The general wards of two large hospitals, one an academic medical center and the other a community hospital.
Subjects: The model has previously been trained and validated on a cohort of 165,018 general ward encounters from a large academic medical center. Here, we apply this model to 11,083 encounters from a separate community hospital.
Interventions: None.
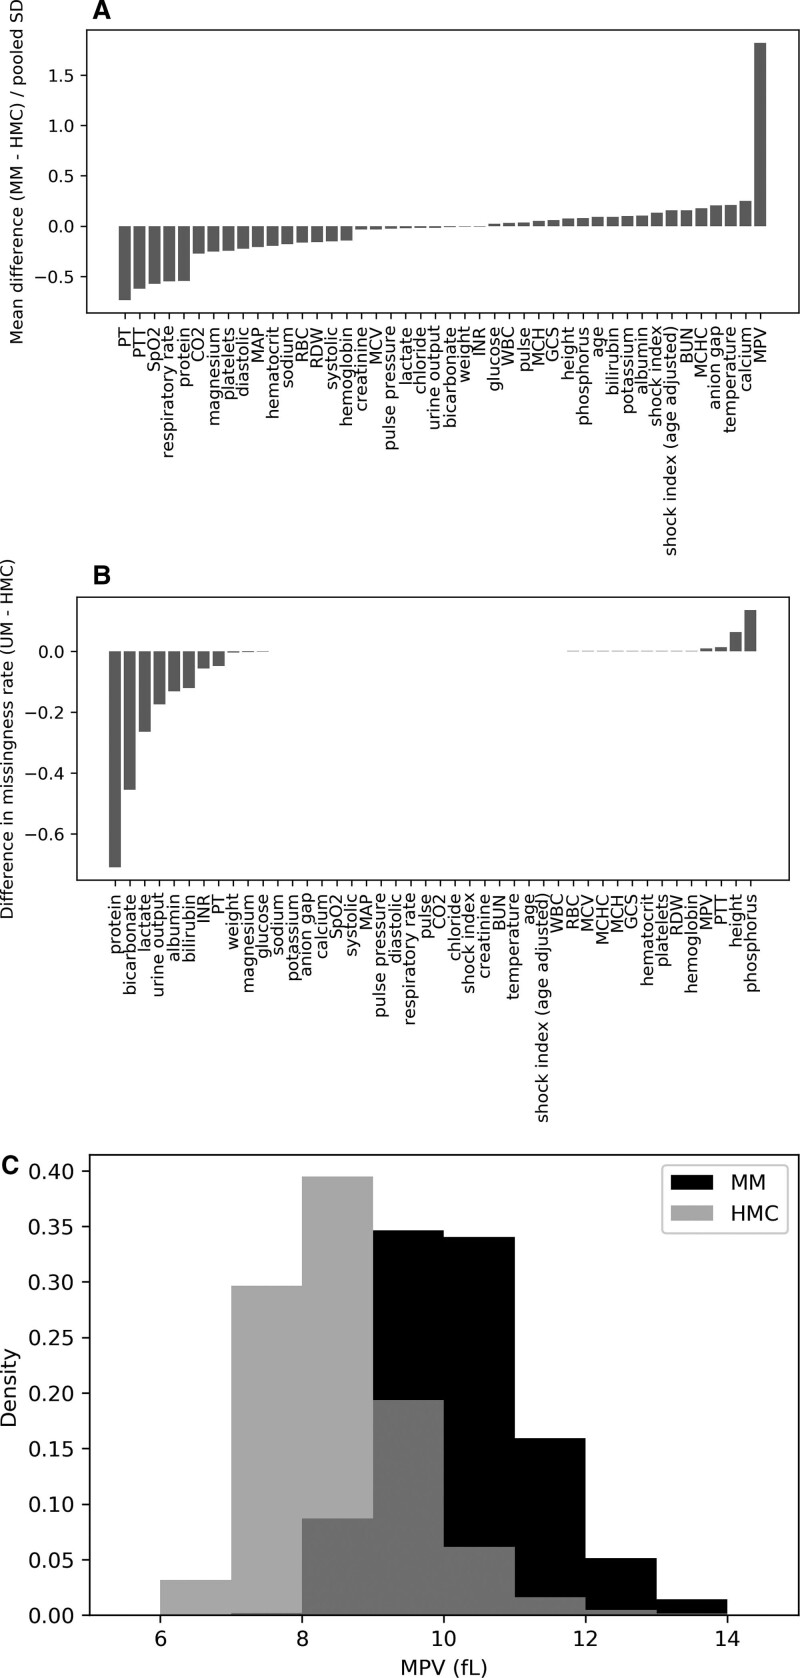
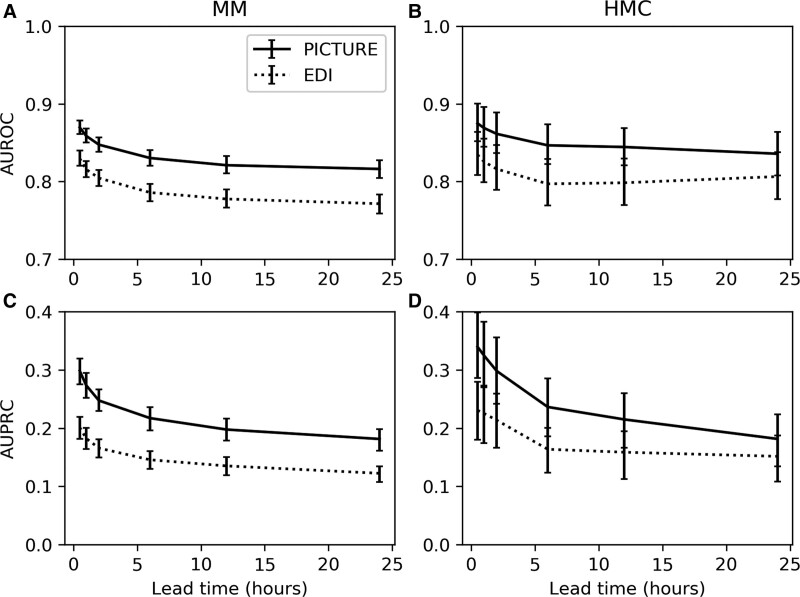
Measurements and main results: The hospitals were found to have significant differences in missingness rates (> 5% difference in 9/52 features), deterioration rate (4.5% vs 2.5%), and racial makeup (20% non-White vs 49% non-White). Despite these differences, PICTURE's performance was consistent (area under the receiver operating characteristic curve [AUROC], 0.870; 95% CI, 0.861-0.878), area under the precision-recall curve (AUPRC, 0.298; 95% CI, 0.275-0.320) at the first hospital; AUROC 0.875 (0.851-0.902), AUPRC 0.339 (0.281-0.398) at the second. AUPRC was standardized to a 2.5% event rate. PICTURE also outperformed both the Epic Deterioration Index and the National Early Warning Score at both institutions.
Conclusions: Important differences were observed between the two institutions, including data availability and demographic makeup. PICTURE was able to identify general ward patients at risk of deterioration at both hospitals with consistent performance (AUROC and AUPRC) and compared favorably to existing metrics.
Copyright © 2023 The Author(s). Published by Wolters Kluwer Health, Inc. on behalf of the Society of Critical Care Medicine and Wolters Kluwer Health, Inc.
Conflict of interest statement
Mr. Cummings’s, Mr. Blackmer’s, Dr. Farzaneh’s, Ms. Cao’s, and Dr. Ansari’s institutions received funding from the Michigan Institute for Data Science and Airstrip Technologies. Mr. Cummings, Mr. Blackmer, Dr. Farzaneh, Ms. Cao, and Drs. Gillies, Medlin, Ward, and Ansari have disclosed that multiple patents have been filed for this work and invention disclosures have been submitted with the Office of Technology Transfer, University of Michigan, Ann Arbor, and that Airstrip Technologies has a license option for Predicting Intensive Care Transfers and other UnfoReseen Events from the University of Michigan. Mr. Motyka disclosed that he is currently employed by at Strata Oncology (Precision Oncology). Dr. Gillies disclosed that he is employed at Regeneron Pharmaceuticals. Dr. Admon’s institution received funding from the National Heart, Lung, and Blood Institute. Drs. Admon and Sjoding received support for article research from the National Institutes of Health (NIH). Dr. Singh’s institution received funding from Blue Cross Blue Shield of Michigan and Teva Pharmaceuticals; he received funding from Flatiron Health. Dr. Sjoding’s institution received funding from the NIH. The remaining authors have disclosed that they do not have any potential conflicts of interest.
Figures
References
-
- Allen J, Currey J, Jones D, et al. : Development and validation of the medical emergency team-risk prediction model for clinical deterioration in acute hospital patients, at time of an emergency admission. Crit Care Med 2022; 50:1588–1598 - PubMed
-
- Saab A, Abi Khalil C, Jammal M, et al. : Early prediction of all-cause clinical deterioration in general wards patients: Development and validation of a biomarker-based machine learning model derived from rapid response team activations. J Patient Saf 2022; 18:578–586 - PubMed
-
- Reardon PM, Seely AJE, Fernando SM, et al. : Can early warning systems enhance detection of high risk patients by rapid response teams? J Intensive Care Med 2021; 36:542–549 - PubMed
Publication types
MeSH terms
Grants and funding
LinkOut - more resources
Full Text Sources
Medical
