. 2023 May 8;8(9):e166850.
doi: 10.1172/jci.insight.166850.

Upregulation of acid ceramidase contributes to tumor progression in tuberous sclerosis complex

Affiliations

Upregulation of acid ceramidase contributes to tumor progression in tuberous sclerosis complex

Aristotelis Astrinidis et al. JCI Insight. .

Abstract

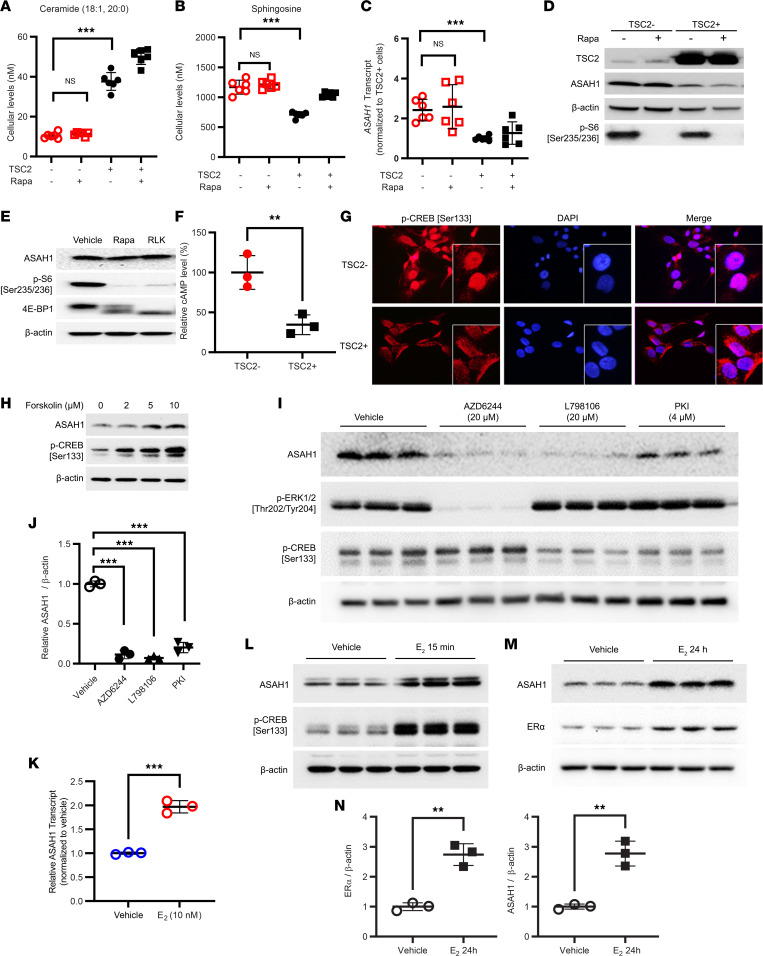
Tuberous sclerosis complex (TSC) is characterized by multisystem, low-grade neoplasia involving the lung, kidneys, brain, and heart. Lymphangioleiomyomatosis (LAM) is a progressive pulmonary disease affecting almost exclusively women. TSC and LAM are both caused by mutations in TSC1 and TSC2 that result in mTORC1 hyperactivation. Here, we report that single-cell RNA sequencing of LAM lungs identified activation of genes in the sphingolipid biosynthesis pathway. Accordingly, the expression of acid ceramidase (ASAH1) and dihydroceramide desaturase (DEGS1), key enzymes controlling sphingolipid and ceramide metabolism, was significantly increased in TSC2-null cells. TSC2 negatively regulated the biosynthesis of tumorigenic sphingolipids, and suppression of ASAH1 by shRNA or the inhibitor ARN14976 (17a) resulted in markedly decreased TSC2-null cell viability. In vivo, 17a significantly decreased the growth of TSC2-null cell-derived mouse xenografts and short-term lung colonization by TSC2-null cells. Combined rapamycin and 17a treatment synergistically inhibited renal cystadenoma growth in Tsc2+/- mice, consistent with increased ASAH1 expression and activity being rapamycin insensitive. Collectively, the present study identifies rapamycin-insensitive ASAH1 upregulation in TSC2-null cells and tumors and provides evidence that targeting aberrant sphingolipid biosynthesis pathways has potential therapeutic value in mechanistic target of rapamycin complex 1-hyperactive neoplasms, including TSC and LAM.

Keywords: Cell Biology; Metabolism; Molecular biology; Mouse models; Tumor suppressors.


Figures

Figure 1
Figure 1. scRNA-Seq analysis identified sphingolipid pathways and related genes induced in LAM mesenchymal cells and renal AML ACTA2+ cells.
(A) Integration of 54,511 cells from 2 LAM lung samples and 6 control lung samples. Cells are visualized using uniform manifold approximation and projection and colored by major lineages. (B) A total of 736 mesenchymal cells from control samples and 190 mesenchymal cells from LAM lung samples are integrated and extracted for direct comparison. (C) Functional enrichment analysis of genes induced in LAM mesenchymal cells versus control mesenchymal cells. (D) Dot plots showing the increasing expression and frequency of ASAH1 and DEGS1 in LAM versus control. Node size represents gene expression frequency. Node color represents the scaled average expression. (E) Box plots showing the expression frequency of representative sphingolipid biosynthesis pathway genes in control mesenchymal cells and LAM mesenchymal cells. Box plots show the interquartile range (box), median (line), and minimum and maximum (whiskers). (F) Visualization of 1,583 cells from lesions of renal AML tumor cells. Cells are visualized using t-distributed stochastic neighbor embedding. Cells are colored by condition. AML lesions consist of 3 major cell types: ACTA2+ AML cells (largest cluster), immune cells, and endothelial cells. AML scRNA-Seq data were downloaded from GEO GSM4035469, with cell type annotation based on the previous study (52). (G) Dot plot showing selected sphingolipid biosynthesis pathway genes’ expression comparison across the 3 AML cell populations. Node size represents gene expression frequency. Node color represents the scaled average expression. (H) Feature plots of LAM and AML markers (ACTA2, PMEL, FIGF, and CTSK) and sphingolipid pathway genes (ASAH1, DEGS1, SPHK1, and SPHK2) in AML cells.
Figure 2
Figure 2. Expression of DEGS1 and ASAH1 is evident in pulmonary LAM lesions.
(A) Sphingolipid biosynthesis pathway shows genes with upregulated expression in TSC2-null cells (in red). (B) Heatmap of sphingolipid metabolism genes expression in female non-LAM lungs (n = 15 subjects) and laser capture microdissected LAM lesion cells (n = 14 subjects). (C) ASAH1 expression in LAM cells, compared with control female non-LAM lungs. ****P < 0.0001, Mann-Whitney test. (D) Immunohistochemistry of hematoxylin and eosin (H&E), smooth muscle actin (ACTA2), phosphorylated S6 (p-S6, Ser235/236), and ASAH1 in LAM lung tissues. Representative images of 3 cases are shown. Scale bars are 100 μm and 20 μm for the top and bottom rows, respectively. (E) Immunoblotting of ASAH1 and transcription factor cAMP-responsive element-binding protein (CREB) in LAM and control lungs (n = 3). (F) Densitometry of ASAH1 and p-CREB (n = 3). *P < 0.05, unpaired t test. (G) H&E, ACTA2, p-S6 (Ser235/236), ASAH1, and DEGS1 in renal AML and normal kidney. Representative images of 3 cases are shown. Scale bars are 20 μm. ACTA2-positive renal AML cells (brown staining), stroma (thin red arrows), infiltrating mononuclear cells (thin yellow arrows), normal glomeruli (red arrowheads), and tubular epithelial cells (black arrows).
Figure 3
Figure 3. Upregulation of ASAH1 and DEGS1 expression in TSC2-null LAM-derived cells.
(A) Heatmap of the expression of sphingolipid biosynthesis pathway genes in TSC2-null (TSC2-) 621-102 and TSC2-addback (TSC2+) 621-103 cells. The scale indicates the fold-change of genes from blue (min) to red (max) (–3 to +3). (B) Transcript levels of ASAH1, DEGS1, and SPHK1 in TSC2-null patient-derived 621-102 and 621-103 cells. (C) The protein levels of TSC2, DEGS1, and ASAH1 were assessed by immunoblotting. β-Actin was used as a loading control. (D) Densitometry of ASAH1 and DEGS1 protein levels normalized to β-actin (n = 3/group). (B and D) **P < 0.01, ***P < 0.001, ****P < 0.0001, unpaired t test.
Figure 4
Figure 4. ASAH1 activity and expression are elevated in a sirolimus-insensitive manner in LAM-derived cells.
621-101 (TSC2-) and 621-103 (TSC2+) cells were treated with 20 nM sirolimus (Rapa) for 24 hours. Cellular levels of ceramide (A) and sphingosine (B) were quantified using LC-MS/MS. (C) ASAH1 transcript levels were quantified by qRT-PCR. (D and E) LAM patient–derived 621-101 (TSC2-) and 621-103 (TSC2+) cells were treated with mTORC1 inhibitor rapamycin (Rapa) (20 nM) or rapalink-1 (RLK1) (0.1 μM) for 24 hours. Protein levels of TSC2, ASAH1, p-S6 (Ser235/236), and 4E-BP1 were assessed by immunoblotting. β-Actin was used as a loading control. (F) Cellular levels of cAMP were quantified in 621-101 (TSC2-) and 621-103 (TSC2+) cells (n = 3). (G) Representative images of confocal microscopy of p-CREB are shown. Nuclei were stained with DAPI. Orginial magnification, ×200. Inset magnification, ×400. (H and I) 621-101 (TSC2-) cells were treated with cAMP agonist forskolin (2, 5, and 10 μM), MEK1/2 inhibitor AZD6244 (20 μM), EP3 inhibitor L798106 (20 μM), or protein kinase A inhibitor (PKI) (4 μM), for 24 hours. Protein levels of ASAH1, p-CREB (S133), and p-Erk1/2 were assessed by immunoblotting. β-Actin was used as a loading control. (J) Densitometry of ASAH1 protein levels normalized to β-actin (n = 3). (KM) 621-101 (TSC2-) cells were treated with 10 nM E2 for 15 minutes or 24 hours. ASAH1 transcript levels were quantified using qRT-PCR. Immunoblot analyses of p-CREB (Ser133), ASAH1, and estrogen receptor-α (ERα) were performed (n = 3/group). β-Actin was used as a loading control. (N) Densitometry of ERα and ASAH1 protein levels (n = 3). (AC, F, J, K, and N) **P < 0.01, ***P < 0.001. (AC and J) Unpaired t test with Bonferroni’s multiple-comparison adjustment. (F, K, and N) Unpaired t test.
Figure 5
Figure 5. Suppression of ASAH1 decreases the survival of TSC2-null cells in vitro.
621-101 (TSC2-) and 621-103 (TSC2+) cells were treated with an ASAH1 inhibitor, 17a (A) or carmofur (B), with indicated concentrations for 72 hours. Cell viability was measured using MTT assay (n = 6/treatment group). Error bars show SEM. (C) TSC2-null 621-101 cells were transfected with 3 independent ASAH1 siRNAs or control siRNA for 48 hours. siRNA knockdown efficiency was determined by qRT-PCR (n = 3/group) and (D) immunoblotting analysis. Fold-change of ASAH1/β-actin was determined using densitometry analysis. β-Actin was used as a loading control. (E) Cell viability was assessed 48 hours after ASAH1 siRNA transfection in 621-101 cells using MTT assay (n = 12/treatment group). (F) Cells were treated with ceramide, then stained with Annexin V: FITC Apoptosis Detection Kit (BD). Cell death was analyzed by flow cytometry (n = 3). (G) The percentage of apoptotic (annexin V+) cells was determined (percentage of Annexin V: FITC-positive cells in total cell number). (H) 621-101 cells were infected with lentiviruses containing shRNA for vector pLKO.1, or ASAH1, then selected with puromycin for 2 weeks. shRNA knockdown efficiency was determined by immunoblotting. β-Actin was used as a loading control. (I) Viability of 621-101 cells transduced with pLKO.1 or ASAH1 shRNA was measured by MTT assay (n = 8–16/treatment group). (J) Stable cells were harvested, then stained with Annexin V: FITC Apoptosis Detection Kit. Cell death was analyzed by flow cytometry (n = 3). (K) The percentage of apoptotic (annexin V+) cells was determined (percentage of Annexin V: FITC-positive cells in total cell number). (L) Cell death was measured using PI exclusion assay. Relative cell death was compared between pLOK.1 and shRNA-ASAH1 cells. (AC, E, G, I, K, and L) **P < 0.01, ***P < 0.001, ****P < 0.0001. (AC and E) Unpaired t test. (G, I, K, and L) Unpaired t test with Bonferroni’s multiple-comparison adjustment.
Figure 6
Figure 6. Suppression of ASAH1 decreases the survival of TSC2-null cells in vivo.
(A) Female NSG mice were inoculated subcutaneously with 2 × 10⁶ ELT3-luciferase–expressing cells. Weekly bioluminescence imaging was performed. Upon ELT3 tumor onset, mice were randomized and treated with vehicle or 17a (10 mg/kg/day, i.p.) for 4 weeks. (B) Tumor photon flux was quantified and normalized to the baseline measurements (week 0). Weekly bioluminescence imaging was performed. (C) 621-101 cells expressing luciferase (621L9) were infected with lentivirus of ASAH1 shRNA cells or control pLKO.1 empty vector. ASAH1 knockdown efficiency was determined by immunoblotting. β-Actin was used as a loading control. (D) Female NSG mice were subcutaneously inoculated with 2 × 10⁶ 621-101-pLKO.1 or 621-101-shASAH1 cells. Tumor formation was detected 21 weeks after cell inoculation. Weekly bioluminescence imaging was performed for up to 32 weeks. (E) Kaplan-Meier tumor-free survival curve. (F) Tumor photon flux was quantified and normalized to the baseline measurements (week 21) (n = 3–4/group). (G) Female NSG mice were treated with vehicle or 17a (10 mg/kg/d, i.p.) for 2 days and then intravenously inoculated with 2 × 10⁵ 621L9 cells. Bioluminescence imaging was performed 1–24 hours after cell inoculation (n = 3). (H) Photon flux at the chest region was quantified. (I) Female NSG mice were intravenously inoculated with 2 × 10⁵ 621L9-ASAH1-shRNA (#1 and #2) cells or control pLKO.1 cells. Bioluminescence imaging was performed 1–24 hours after cell inoculation (n = 4–5). (J) Photon flux at the chest region was quantified. (B, E, F, H, and J) *P < 0.05, **P < 0.01, ***P < 0.001, ****P < 0.0001. (B, F, and H) Unpaired t test. (E) Log-rank (Mantel-Cox) test. (J) Two-way ANOVA with Tukey’s multiple-comparison test.
Figure 7
Figure 7. Combination of ASAH1 and mTORC1 inhibition suppresses Tsc2-null tumor growth and tumor regrowth better than rapamycin alone.
Tsc2+/– A/J mice were given vehicle, rapamycin, 17a, or rapamycin and 17a combinatorial treatment for 12 weeks (n = 4 mice/group). Macroscopic analysis (A) and quantification (B) of renal tumor burden under a dissection microscope upon drug withdrawal. (C) Tumor rebound study and MRI follow-up posttreatment schema. (DF) MRI of Tsc2+/– A/J mouse kidneys at 4 and 8 weeks after withdrawal from treatment. (G) Mouse kidney sections were stained with H&E, p-S6 (Ser235/236), PCNA, and TUNEL. Scale bars are 20 μm except for the idicated 50 μm scale bar. (H) Percentages of cells with nuclear immunoreactivity for PCNA were scored from 5 random fields per section. *P < 0.05, **P < 0.01, Mann-Whitney test. (B, F, and H) **P < 0.01, ***P < 0.001, ****P < 0.0001. (B) Unpaired t test with Bonferroni’s multiple-comparison adjustment. (F and H) One-way ANOVA with Tukey’s multiple-comparison test.

References

    1. Crino PB, et al. The tuberous sclerosis complex. N Engl J Med. 2006;355(13):1345–1356. doi: 10.1056/NEJMra055323. - DOI - PubMed
    1. Henske EP, et al. Tuberous sclerosis complex. Nat Rev Dis Primers. 2016;2:16035. doi: 10.1038/nrdp.2016.35. - DOI - PubMed
    1. Neuman NA, Henske EP. Non-canonical functions of the tuberous sclerosis complex-Rheb signalling axis. EMBO Mol Med. 2011;3(4):189–200. doi: 10.1002/emmm.201100131. - DOI - PMC - PubMed
    1. McCormack FX, Gupta N. Sporadic Lymphangioleiomyomatosis: Clinical Presentation and Diagnostic Evaluation. https://www.uptodate.com/contents/sporadic-lymphangioleiomyomatosis-clin... Updated: December 21, 2022. Accessed March 16, 2023.
    1. Cudzilo CJ, et al. Lymphangioleiomyomatosis screening in women with tuberous sclerosis. Chest. 2013;144(2):578–585. doi: 10.1378/chest.12-2813. - DOI - PubMed

Publication types

Supplementary concepts