. 2023 Mar 16;14(1):1459.
doi: 10.1038/s41467-023-37170-z.

Quinolinate promotes macrophage-induced immune tolerance in glioblastoma through the NMDAR/PPARγ signaling axis

Affiliations

Quinolinate promotes macrophage-induced immune tolerance in glioblastoma through the NMDAR/PPARγ signaling axis

Pravin Kesarwani et al. Nat Commun. .

Abstract

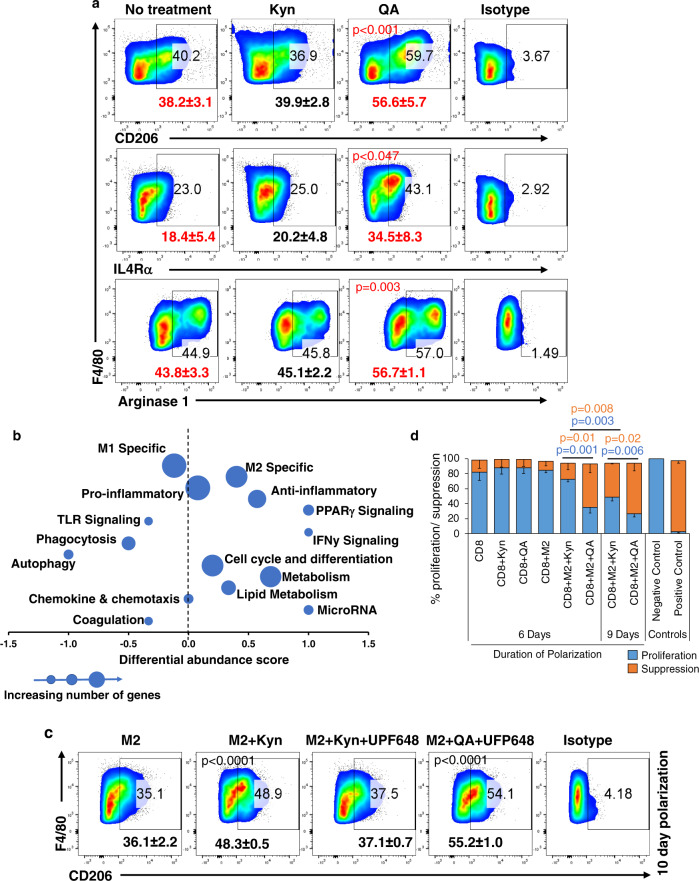
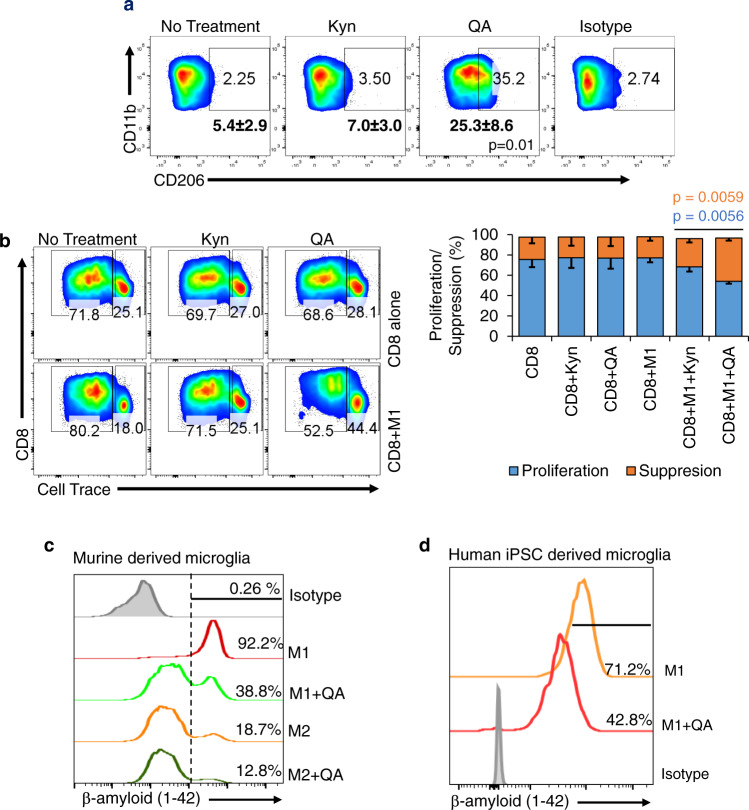
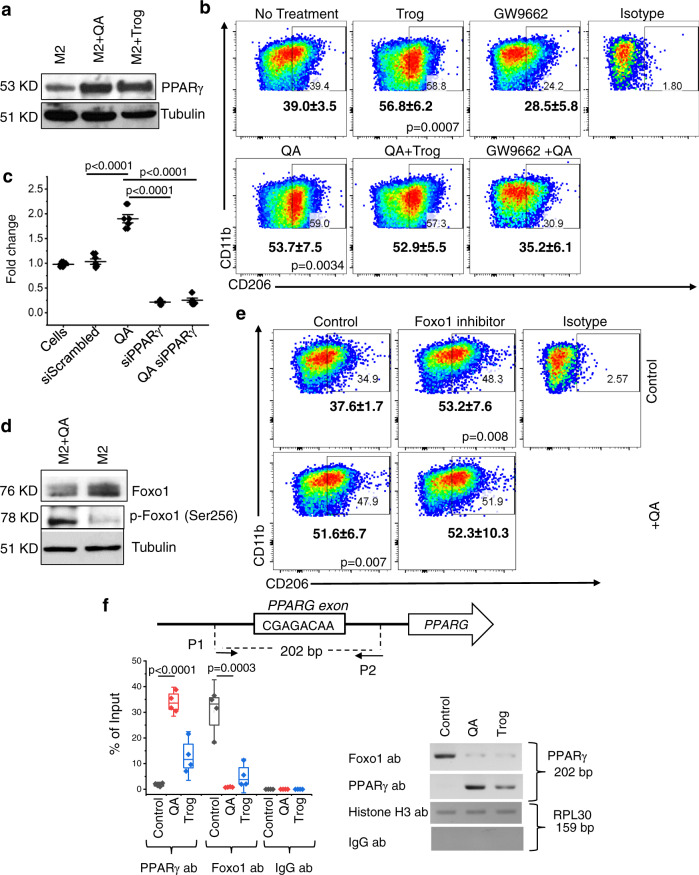
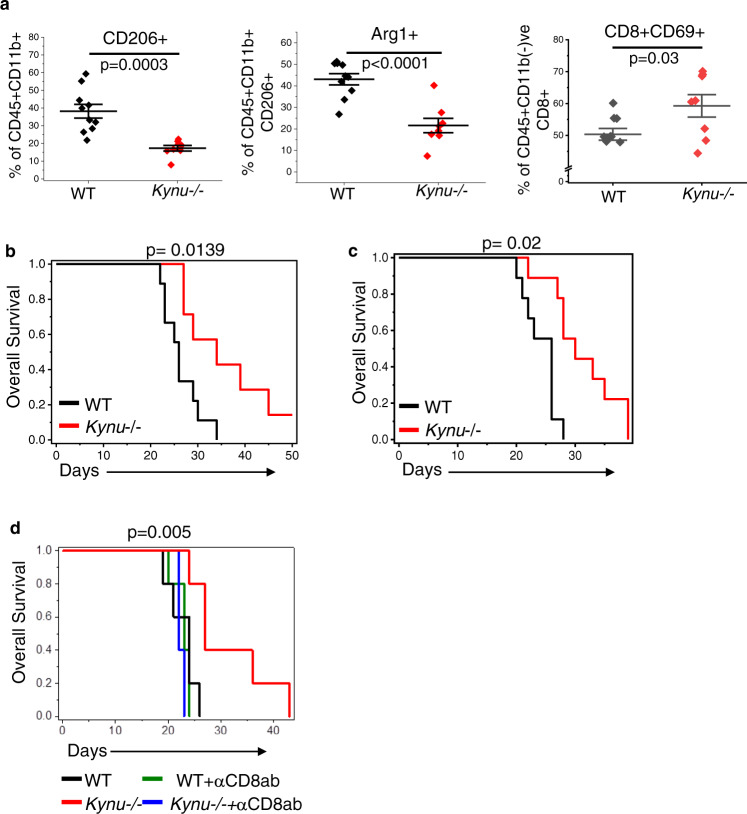
There has been considerable scientific effort dedicated to understanding the biologic consequence and therapeutic implications of aberrant tryptophan metabolism in brain tumors and neurodegenerative diseases. A majority of this work has focused on the upstream metabolism of tryptophan; however, this has resulted in limited clinical application. Using global metabolomic profiling of patient-derived brain tumors, we identify the downstream metabolism of tryptophan and accumulation of quinolinate (QA) as a metabolic node in glioblastoma and demonstrate its critical role in promoting immune tolerance. QA acts as a metabolic checkpoint in glioblastoma by inducing NMDA receptor activation and Foxo1/PPARγ signaling in macrophages, resulting in a tumor supportive phenotype. Using a genetically-engineered mouse model designed to inhibit production of QA, we identify kynureninase as a promising therapeutic target to revert the potent immune suppressive microenvironment in glioblastoma. These findings offer an opportunity to revisit the biologic consequence of this pathway as it relates to oncogenesis and neurodegenerative disease and a framework for developing immune modulatory agents to further clinical gains in these otherwise incurable diseases.


Conflict of interest statement

The authors declare no competing interests.

Figures

Fig. 1
Fig. 1. Quinolinate (QA) accumulation in glioblastoma (GBM).
a Schematic of tryptophan (Trp) metabolism. b Metabolomic profiling performed on patient-derived low-grade astrocytoma (LGA; n = 28; red) and GBM (n = 80; blue) demonstrates differential accumulation of QA in GBM. All samples were biologically independent. c The relative accumulation of QA was evaluated in molecular subtypes of GBM (n = 46), classified as classical (CL, n = 13; red), mesenchymal (M, n = 21; blue), or proneural (PN, n = 12; green). Y axis was abridged at 4. d The murine GBM line TRP was grown orthotopically in C57BL/6 mice (n = 5; blue) and Nu/Nu mice (n = 6; yellow) and analyzed for QA and compared to normal murine brain (n = 5; red). All samples were biologically independent. e QA and kynurenine (Kyn) were quantified in normal brain (gray) and TRP tumors grown orthotopically in C57BL/6 mice with (blue) and without (red) the IDO inhibitor (IDOi) GDC-0919 (n = 3 biologically independent samples/group). f The upstream and downstream metabolism of tryptophan (Trp→Kyn and Kyn→QA, respectively) was evaluated in U251 (n = 3) and MES83 (n = 2) cells +/− IFNγ. All samples were biologically independent. g M2 macrophages (n = 6), myeloid-derived-suppressor cells (MDSC; n = 6), microglial-derived M2 cells (MDM2; n = 3), and regulatory T cells (Treg; n = 4) were isolated from C57BL/6 mice, cultured with Trp or Kyn, and analyzed for QA. All samples were biologically independent. Box plots represent interquartile range, line between data points represents mean, and whiskers represent SE (b, c, d, f and g). Line between data points represents mean, and whiskers represent SE (e). Statistics: Two-tailed Student’s t-test (b, f, and g), one-way ANOVA followed by Tukey’s multiple comparisons test (c, d and e). All tests were performed at 95% confidence interval. Source data are provided as a source data file.
Fig. 2
Fig. 2. QA contributes towards immune suppression by priming monocyte polarization towards an M2-like phenotype.
a Macrophages polarized towards the M2 phenotype ±Kyn or QA (20 µM) were gated for CD45 + F4/80 + CD11b + and analyzed for CD206 (n = 3 or 5/group as indicated in Source Data), IL-4Rα (n = 3/group), or Arginase 1 (n = 3/group) using flow-cytometry. Numbers represent mean ± SD. All samples were biologically independent. b M2 macrophages cultured in presence or absence of QA (20 µM) were flow-sorted for M2 macrophages (CD45 + CD11b + F4/80 + CD206 + ), and mRNA analyzed using Affymetrix arrays (Clariom™ D Assay, mouse; n = 5 biologically independent samples/group). Transcripts were classified into major pathways and a differential abundance (DA) score was calculated using mRNA transcripts significantly increased or decreased (Mann-Whitney U tests and Benjamini-Hochberg corrected p-value < 0.05) in the M2 + QA group compared to the M2 macrophage group. A score of 1 or −1 indicates all genes in a given pathway were increased or decreased, respectively. c Macrophages polarized towards the M2 phenotype ±Kyn or QA (20 µM) for an additional 3 day (10 days total, to allow for further metabolism/generation of QA from Kyn) ± the kynurenine 3-monooxygenase (KMO) inhibitor UFP648. Cells were gated for CD45 + F4/80 + CD11b + CD206 + using flow-cytometry. Numbers represent mean ± SD (n = 3 biologically independent samples/group). d To analyze the functional suppression of M2 macrophages, M2 cells were polarized ±Kyn or QA (20 µM) for 6 or 9 day (n = 3 biologically independent samples/group). Splenocytes from C57BL/6 mice were used for isolating CD8 + T cells using magnetic bead sorting. CFSE labeled CD8 + T cells were activated using plate-bound anti-CD3/CD28 antibody for 3 day in the presence or absence of M2 cells ±Kyn or QA. Data is represented as a bar graph (mean ± SD) demonstrating CFSE dilution (proliferation; blue) or suppression (orange). CFSE labeled CD8 + T cells without stimulation (anti-CD3/CD28 antibody) were used as a positive control of suppression. Unlabeled CD8 + T cells were used as a negative control for proliferation. Statistics: Two-tailed Student’s t-test (a and d), one-way ANOVA followed by Tukey’s multiple comparisons test (c). All tests were performed at 95% confidence interval. Source data are provided as a source data file.
Fig. 3
Fig. 3. QA induces an immune suppressive phenotype to M1 macrophages and microglia.
a M0 macrophages harvested from the bone marrow of C57BL/6 mice were polarized to M1 macrophages with LPS (100 ng/ml) and IFNγ (50 ng/ml) for 24–36 h ±Kyn or QA (20 µM) and gated for M2 macrophage markers (CD45 + F4/80 + CD11b + CD206 + ). Numbers represent mean ± SD (n = 3 biologically independent samples/group). b The functional suppression of M1 macrophages polarized + /- Kyn or QA was performed using CD8/macrophage co-culture experiments with CFSE dilution, as described in Fig. 2. Bar graph demonstrate mean and SD (n = 3 biologically independent samples/group). c Murine-derived microglia were matured in the presence of GM-CSF conditioning media and polarized towards the M1 phenotype (LPS + IFNγ) with (green) or without (red) QA or the M2 phenotype (IL4 + IL13) with (dark green) or without (orange) QA. Cells were pulsed with green florescent β-amyloid (1-42) peptide and analyzed for phagocytosis of this peptide at 16 h by flow cytometry. d Similar studies were performed using human induced pluripotent stem cell (iPSC) derived microglia and polarized towards the M1 phenotype (LPS + IFNγ) with (red) or without (orange) QA. Data is representative of three biologically independent experiments (c, d). Statistics: One-way ANOVA followed by Tukey’s multiple comparisons test (a, b), two-tailed Student’s t-test (b). All tests were performed at 95% confidence interval. Source data are provided as a source data file.
Fig. 4
Fig. 4. QA modulates PPARγ mediated transcriptional programs in M2 macrophages.
M2 macrophages cultured in presence or absence of QA (20 µM) were flow-sorted for M2 macrophages (CD45 + CD11b + F4/80 + CD206 + ), and mRNA analyzed using Affymetrix arrays (Clariom™ D Assay, mouse; n = 5 biologically independent samples/group). a Heatmap demonstrates differentially expressed genes (log 1.5-fold change). b Differentially expressed genes (p < 0.05) are presented as a volcano plot. c Protein-protein interaction and pathway analysis. Statistics: Two-tailed Student’s t-test (a, b). All tests were performed at 95% confidence interval. Source data are provided as a source data file.
Fig. 5
Fig. 5. QA regulates PPARγ signaling using Foxo1.
a Macrophages obtained from C57BL/6 mice were polarized towards the M2 phenotype ±QA (20 µM) or the PPARγ agonist troglitazone (Trog; 5 µM) and evaluated for the indicated proteins by western blot, which is representative of three biologically independent experiments. b Macrophages obtained from C57BL/6 mice were polarized towards the M2 phenotype ±Trog (n = 5), GW9662 (PPARγ antagonist; n = 3) and/or QA (20 µM; n = 5) and analyzed for M2 macrophage markers (CD45 + CD11b + F4/80 + CD206 + ) by flow cytometry. All samples were biologically independent. Numbers represent mean ± SD. c PPARγ transcriptional activity was evaluated in the murine macrophage cell line IC-21 polarized towards the M2 phenotype ±siRNA of indicated proteins by PPARγ transcriptional activity ELISA (n = 5 biologically independent samples). d C57BL/6 mouse-derived macrophages were polarized towards the M2 phenotype ±QA (20 µM) and evaluated for the indicated proteins by western blot, which is representative of 3 biologically independent experiments. e Macrophages were cultured in the presence or absence of QA ± the Foxo1 inhibitor AS-1842856 (0.1 µM) and evaluated for M2 macrophage markers (CD45 + CD11b + F4/80 + CD206 + ) by flow cytometry. Numbers represent mean ± SD (n = 4 biologically independent samples/group). f Chromatin immunoprecipitation (ChIP) was performed on C57BL/6 mouse-derived macrophages polarized towards the M2 phenotype and evaluated alone (gray), with QA (red) or with Trog (blue). ChIP was performed using antibodies against PPARγ, Foxo1, and histone 3 (positive control), and IgG antibody (negative control). After IP and DNA purification, the PPARγ exon (202 bp in length) was analyzed using qPCR and gel electrophoresis. Box plots represent interquartile range, line between the data points represents mean, and whiskers represents SE (n = 4 biologically independent samples/group). Statistics: One-way ANOVA followed by Tukey’s multiple comparisons test (b, c), two-tailed Student’s t-test (e, f). All tests were performed at 95% confidence interval. Source data are provided as a source data file.
Fig. 6
Fig. 6. QA modulates M2 macrophage polarization through the NMDAR/Foxo1/PPARγ signaling axis.
a M2 macrophages were polarized ±QA, gated for macrophage markers (CD45 + CD11b + F4/80 + ) and CD206 + ve with (green) or without (red) QA or CD206-ve with (orange) or without (dark green) QA, and evaluated for expression of the NMDA receptor 1 (NMDAR1; n = 2 biologically independent samples/group). b M2 macrophages were cultured in ±QA, L-AP5 (NMDAR1 inhibitor), or NMDA and cells were gated for M2 macrophages markers (CD45 + CD11b + F4/80 + CD206 + ). Numbers represent mean ± SD (n = 3 biologically independent samples/group). c M2 macrophages were cultured in ±QA, NMDA, or Trog, and indicated proteins were evaluated by western blot, which is representative of three biologically independent experiments. d Schematic depicting the proposed mechanism of QA-induced M2 macrophage polarization. QA binds to the NMDA receptor of macrophages (1), leading to phosphorylation of Foxo1 (2). Phosphorylated Foxo1 is retained in the cytoplasm and destined for ubiquitination. Loss of nuclear Foxo1, a negative regulator of the PPARγ promoter, leads to increased PPARγ expression and transcriptional programs designed to promote macrophage polarization towards the M2 phenotype (3). Statistics: Two-tailed Student’s t test at 95% confidence interval (b). Source data are provided as a source data file.
Fig. 7
Fig. 7. Targeting the downstream metabolism of tryptophan in GBM using the Kynu-/- model.
a Macrophages obtained from C57BL/6 mice were polarized towards the M2 phenotype ±QA (20 µM), and RNA was isolated and evaluated for indicated genes using real-time PCR. Bar graph represent mean ± SD (n = 3 biologically independent samples/group). b Macrophages obtained from C57BL/6NJ Kynu-/- and WT mice were polarized towards the M1 or M2 phenotype in ±QA, and indicated proteins were evaluated by western blot, which is representative of three biologically independent experiments. c, d TRP tumors were grown orthotopically in C57BL/6NJ WT (n = 8; gray) or Kynu-/- (n = 6; red) mice and QA levels was determined by (c) ELISA and (d) immunohistochemical staining. All samples were biologically independent. Line between data points represents mean, and whiskers represent SE (c). Statistics: Two-tailed Student’s t-test (a and c). All tests were performed at 95% confidence interval. Source data are provided as a source data file.
Fig. 8
Fig. 8. Targeting QA accumulation using the Kynu-/- model modulates the immune landscape and demonstrates anti-tumor activity in GBM in vivo.
a TRP murine GBM tumors were grown orthotopically in C57BL/6NJ WT (n = 10; black) or Kynu-/- mice (n = 8; red). Mice were euthanized on day 21 and tumors harvested for immune profiling using flow cytometry, including M2 macrophages (CD45 + CD11b + F4/801 + CD206 + ); Arginase 1 + M2 macrophages (CD45 + CD11b + F4/801 + CD206 + Arg1 + ), and activated CD8 + T cells (CD45 + CD8 + CD69 + ). Line between the data points represents mean and whisker represents SE. All samples were biologically independent. b TRP murine GBM tumors were grown orthotopically in C57BL/6NJ WT (black; n = 9/group) or Kynu-/- (red; n = 7/group) mice and followed for survival using a Kaplan–Meier survival plot. c GL261 murine GBM tumors were grown orthotopically in C57BL/6NJ WT (black) or Kynu-/- (red) mice and followed for survival using a Kaplan–Meier survival plot (n = 9/group). d TRP murine GBM tumors were grown orthotopically in C57BL/6NJ WT without (black) and with (green) CD8 T-cell depletion and Kynu-/- mice without (red) and with (blue) CD8 T-cell depletion using an anti-CD8 antibody delivered i.p. weekly (n = 5/group). All samples were biologically independent. Statistics: Two-tailed Student’s t-test (a), log rank p-value (b, c and d). All tests were performed at 95% confidence interval. Source data are provided as a source data file.

References

    1. Hanahan D, Weinberg RA. Hallmarks of cancer: the next generation. Cell. 2011;144:646–674. doi: 10.1016/j.cell.2011.02.013. - DOI - PubMed
    1. Komohara Y, Ohnishi K, Kuratsu J, Takeya M. Possible involvement of the M2 anti-inflammatory macrophage phenotype in growth of human gliomas. J. Pathol. 2008;216:15–24. doi: 10.1002/path.2370. - DOI - PubMed
    1. Hussain SF, et al. The role of human glioma-infiltrating microglia/macrophages in mediating antitumor immune responses. Neuro Oncol. 2006;8:261–279. doi: 10.1215/15228517-2006-008. - DOI - PMC - PubMed
    1. Wei J, et al. Immune biology of glioma-associated macrophages and microglia: functional and therapeutic implications. Neuro Oncol. 2020;22:180–194. - PMC - PubMed
    1. Cassetta L, Pollard JW. Targeting macrophages: therapeutic approaches in cancer. Nat. Rev. Drug Disco. 2018;17:887–904. doi: 10.1038/nrd.2018.169. - DOI - PubMed

Publication types