Review
. 2023 Mar 1;37(5-6):140-170.
doi: 10.1101/gad.350314.122. Epub 2023 Mar 16.

SPOC domain proteins in health and disease

Affiliations
Review

SPOC domain proteins in health and disease

Lisa-Marie Appel et al. Genes Dev. .

Abstract

Since it was first described >20 yr ago, the SPOC domain (Spen paralog and ortholog C-terminal domain) has been identified in many proteins all across eukaryotic species. SPOC-containing proteins regulate gene expression on various levels ranging from transcription to RNA processing, modification, export, and stability, as well as X-chromosome inactivation. Their manifold roles in controlling transcriptional output implicate them in a plethora of developmental processes, and their misregulation is often associated with cancer. Here, we provide an overview of the biophysical properties of the SPOC domain and its interaction with phosphorylated binding partners, the phylogenetic origin of SPOC domain proteins, the diverse functions of mammalian SPOC proteins and their homologs, the mechanisms by which they regulate differentiation and development, and their roles in cancer.

Keywords: SPOC domain; gene expression; phosphorylation.


Figures

Figure 1.
Figure 1.
Mammalian SPOC proteins. (A) Domain architecture of mammalian SPOC proteins. (PHD) Plant homeodomain, (TLD) TFIIS-like domain, (RRM) RNA recognition motif, (RID) receptor interaction domain, (SPOC) Spen paralog and ortholog C-terminal domain. (B) SPOC domains share a distorted β-barrel fold. Overlay of SPOC structures from PHF3 (6Q2V), SPEN (2RT5), RBM15 (7Z27), and plant protein FPA (5KXF). (C) SPOC shares structural similarity with the Ku80 and MED25 domains. Overlay of PHF3 SPOC (6Q2V), the Ku80 β-barrel domain (6ERF), and the MED25 PTOV/ACID domain (2XNF).
Figure 2.
Figure 2.
Multiple sequence alignment of SPOC proteins. SPOC domains from representative sequences were aligned with MAFFT (Katoh and Toh 2008) and visualized in Jalview (Waterhouse et al. 2009). Sequence identifiers are composed of the official gene name (left), species name, and UniProt accession (right). Residue coloring follows the ClustalX color scheme, with conserved hydrophobic residues in blue, positively charged residues in red, and negatively charged residues in magenta. The red asterisk marks an Arg residue, which is conserved in all SPOC proteins with the exception of SPOCD1 and is essential for phospho-serine binding.
Figure 3.
Figure 3.
SPEN and PHF3 SPOC are phospho-serine binding domains. (A,B) Phospho-serine residues of SMRT (A) and pS5 CTD (B) bind to a positively charged patch on the SPEN SPOC surface. Peptide sequences and their N and C termini are indicated. Electrostatic surface potential of SPEN SPOC was calculated using the Coulombic surface coloring tool in UCSF Chimera and is depicted ranging from −10 (red) to +10 (blue) kcal/(mol × e). (C) Overlay of the SPEN SPOC–SMRT and SPEN–pS5 CTD structures. Residues directly involved in the recognition of SMRT pS2552 and CTD pS5 are highlighted. (D,E) Interactions involved in SPEN SPOC binding to SMRT (D) and pS5 CTD (E). Basic residues that anchor pS2552 of SMRT (D) and pS5 of the CTD (E) to the SPEN SPOC domain are highlighted in blue, and the positively charged surface patch is indicated with a dashed circle. (F) Phospho-serine residues in two adjacent repeats of pS2 CTD bind to two positively charged patches of the PHF3 SPOC surface. Peptide sequence and N and C termini are indicated. Electrostatic surface potential of PHF3 SPOC was calculated using the Coulombic surface coloring tool in UCSF Chimera and is depicted ranging from −10 (red) to +10 (blue) kcal/(mol × e). (G) Interactions involved in PHF3 SPOC binding to pS2 CTD. Basic residues that anchor two pS2 residues of the CTD to the PHF3 SPOC domain are highlighted in blue, and positively charged surface patches are indicated with dashed circles.
Figure 4.
Figure 4.
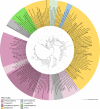
Phylogenetic tree of the SPOC domain protein family. A maximum likelihood tree was reconstructed with IQ-TREE (Minh et al. 2020) using automatic model selection with ModelFinder (Kalyaanamoorthy et al. 2017). Branch support was assessed with UFboot (Hoang et al. 2018), and clades with ≥95% support values are indicated with a blue dot. Branch lengths represent the expected number of substitutions per site. The graphic was created in iTOL (Letunic and Bork 2021). Colored ranges highlight domain combinations and subfamilies.
Figure 5.
Figure 5.
Distribution of domain architectures in selected species. The domain annotation is derived from PFAM (Mistry et al. 2021). Each symbol represents at least one protein with the respective domain combination. Multiple occurrences of the same domain were disregarded, as is the case for RRM domain proteins. Homo sapiens has three proteins with RRM and SPOC domains (RBM15, RBM15B, and SPEN); two proteins with PHD, TLD, and SPOC (PHF3 and DIDO); and one protein with only the TLD and SPOC domain (SPOCD1). The evolutionary timescale was provided by TimeTree (https://www.timetree.org), where unavailable species were replaced with related nodes (Kumar et al. 2022).
Figure 6.
Figure 6.
Gene expression of SPOC proteins in humans. (A,B) Whole-body average (A) and per tissue (B) expression levels (transcripts per million [TPM]) accessed from the GTEx portal (http://www.gtexportal.org). (B) To allow comparison of relative expression among the different genes and tissues, average TPM levels per tissue were normalized using the z-score formula.
Figure 7.
Figure 7.
Overview of the roles of SPEN in transcription regulation and X-chromosome inactivation.
Figure 8.
Figure 8.
Overview of the functions of RBM15 and RBM15B in alternative splicing, m6A modification, and RNA export.
Figure 9.
Figure 9.
Overview of the roles of DIDO and PHF3 in transcription regulation and alternative splicing.
Figure 10.
Figure 10.
The top 10 cancers with mutations in SPOC proteins. TCGA cohorts were ranked by their percentage of cases affected by gene mutations in the various SPOC proteins out of all cases carrying at least one SPOC protein mutation. Data were accessed via the GDC (Genomic Data Commons) data portal (https://portal.gdc.cancer.gov).
Figure 11.
Figure 11.
Frequency and type of somatic mutations in SPOC proteins. (A) Protein mutation information accessed via the COSMIC (Catalogue of Somatic Mutations in Cancer) data portal (https://cancer.sanger.ac.uk) showing the type and frequency of somatic mutations along the SPOC protein positions, with substitution being the most frequent mutation type. Protein domains are indicated with different colors. (Red) SPOC, (blue) PHD, (orange) TLD, (yellow) RRM, (green) RID. (B) Distribution of SPOC protein mutations across patients from TCGA consortium carrying at least one mutation in SPOC proteins. SPEN, followed by DIDO1 and PHF3, is the most frequently mutated SPOC protein. (C) Frequency distribution of the type of mutation for each SPOC protein. Missense mutations are the most frequent mutation type, followed by synonymous substitution and nonsense substation (stop gain).
Figure 12.
Figure 12.
SPOC copy number alterations in cancer. TCGA data were accessed via the GSCA (Gene Set Cancer Analysis) data portal (http://bioinfo.life.hust.edu.cn/GSCA). Heterozygous copy number alterations are more frequent than the homozygous ones. DIDO predominantly shows heterozygous amplification across the TCGA cohorts, whereas deletions are more prevalent for other SPOC proteins. (Het. amp) Heterozygous amplification, (homo. amp.) homozygous amplification, (het. del.) heterozygous deletion, (homo. del.) homozygous deletion.
Figure 13.
Figure 13.
SPOC expression levels in normal compared with tumor tissue across TCGA cohorts. Normalized expression levels (z.score) from TCGA database of paired tumor–normal tissue. The data were accessed via the R client FirebrowseR (Deng et al. 2017).

References

    1. Andriatsilavo M, Stefanutti M, Siudeja K, Perdigoto CN, Boumard B, Gervais L, Gillet-Markowska A, Al Zouabi L, Schweisguth F, Bardin AJ. 2018. Spen limits intestinal stem cell self-renewal. PLoS Genet 14: e1007773. 10.1371/journal.pgen.1007773 - DOI - PMC - PubMed
    1. Appel LM, Franke V, Bruno M, Grishkovskaya I, Kasiliauskaite A, Kaufmann T, Schoeberl UE, Puchinger MG, Kostrhon S, Ebenwaldner C, et al. 2021. PHF3 regulates neuronal gene expression through the Pol II CTD reader domain SPOC. Nat Commun 12: 6078. 10.1038/s41467-021-26360-2 - DOI - PMC - PubMed
    1. Appel LM, Franke V, Benedum J, Grishkovskaya I, Strobl X, Polyansky A, Ammann G, Platzer S, Neudolt A, Wunder A, et al. 2023. The SPOC domain is a phosphoserine binding module that bridges transcription machinery with co- and post-transcriptional regulators. Nat Commun 14: 166. 10.1038/s41467-023-35853-1 - DOI - PMC - PubMed
    1. Ariyoshi M, Schwabe JW. 2003. A conserved structural motif reveals the essential transcriptional repression function of Spen proteins and their role in developmental signaling. Genes Dev 17: 1909–1920. 10.1101/gad.266203 - DOI - PMC - PubMed
    1. Armenia J, Wankowicz SAM, Liu D, Gao J, Kundra R, Reznik E, Chatila WK, Chakravarty D, Han GC, Coleman I, et al. 2018. The long tail of oncogenic drivers in prostate cancer. Nat Genet 50: 645–651. 10.1038/s41588-018-0078-z - DOI - PMC - PubMed

Publication types