. 2023 Apr;4(4):516-534.
doi: 10.1038/s43018-023-00527-w. Epub 2023 Mar 16.

Immune landscape in invasive ductal and lobular breast cancer reveals a divergent macrophage-driven microenvironment

Affiliations

Immune landscape in invasive ductal and lobular breast cancer reveals a divergent macrophage-driven microenvironment

Sayali Onkar et al. Nat Cancer. 2023 Apr.

Erratum in

Abstract

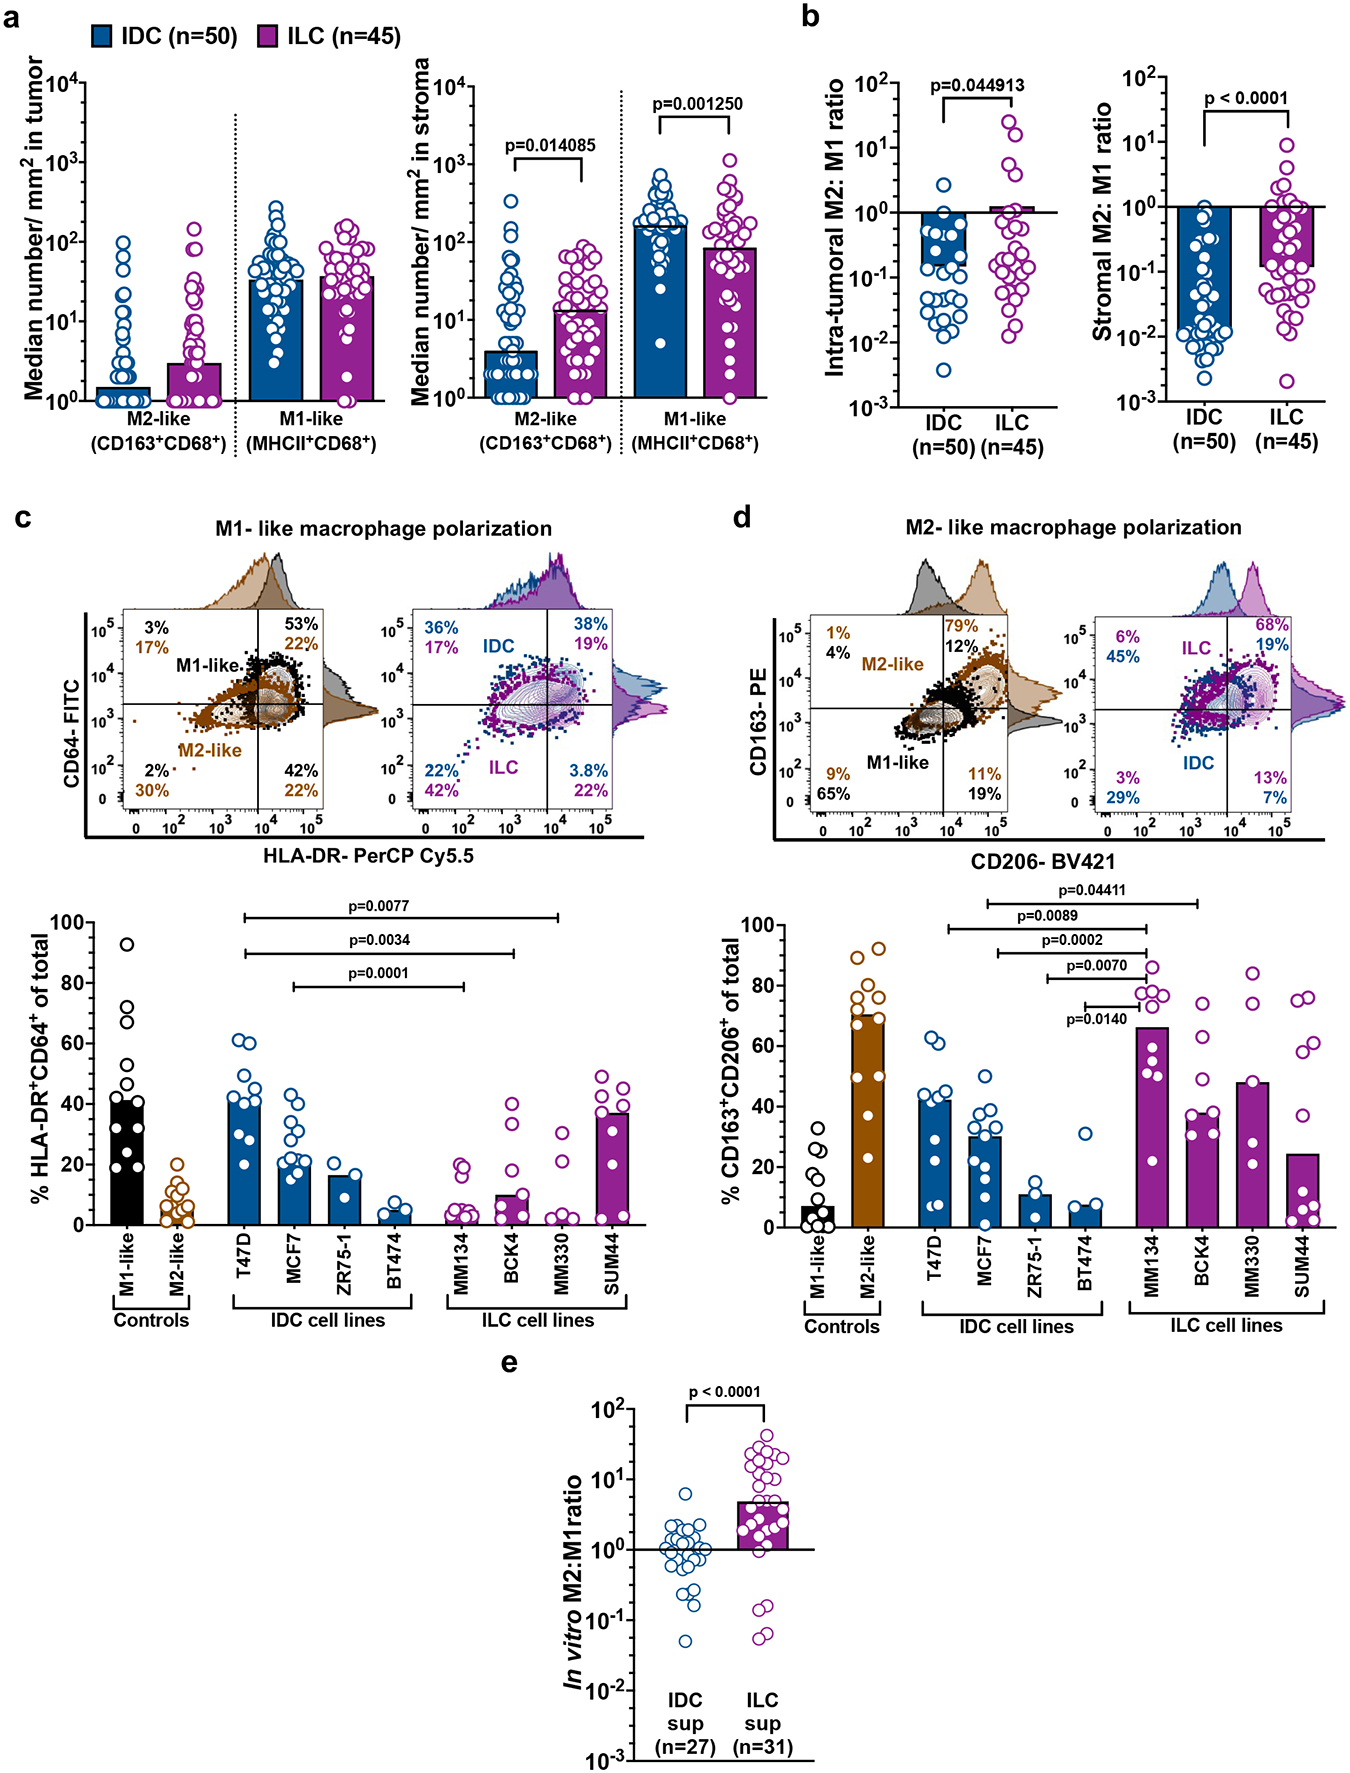
T cell-centric immunotherapies have shown modest clinical benefit thus far for estrogen receptor-positive (ER+) breast cancer. Despite accounting for 70% of all breast cancers, relatively little is known about the immunobiology of ER+ breast cancer in women with invasive ductal carcinoma (IDC) and invasive lobular carcinoma (ILC). To investigate this, we performed phenotypic, transcriptional and functional analyses for a cohort of treatment-naive IDC (n = 94) and ILC (n = 87) tumors. We show that macrophages, and not T cells, are the predominant immune cells infiltrating the tumor bed and the most transcriptionally diverse cell subset between IDC and ILC. Analysis of cellular neighborhoods revealed an interplay between macrophages and T cells associated with longer disease-free survival in IDC but not ILC. Our datasets provide a rich resource for further interrogation into immune cell dynamics in ER+ IDC and ILC and highlight macrophages as a potential target for ER+ breast cancer.


Conflict of interest statement

D.A.A.V. is cofounder and stockholder of Novasenta, Potenza, Tizona and Trishula; stock holder of Oncorus, Werewolf and Apeximmune; has patents licensed and royalties from Astellas, BMS, Novasenta; scientific advisory board member of Tizona, Werewolf, F-Star, Bicara, Apeximmune and T7/Imreg Bio; is a consultant for Astellas, BMS, Almirall, Incyte, G1 Therapeutics and Inzen Therapeutics; and obtained research funding from BMS, Astellas and Novasenta. All authors declare no competing financial or non-financial interests in relation to the work submitted in this manuscript.

Figures

Extended Data Fig. 1 :
Extended Data Fig. 1 :. Flow cytometric panels, gating, and immune cell distributions across ER+ IDC and ILC
a. Representative flow cytometry plots with gating strategy used for lymphoid panel (left) and myeloid panel (right) b. Marker combinations used to define immune cell populations in lymphoid cell panel (left table) and myeloid cell panel (right table) c. Intra- patient lymphoid cell frequencies in ER+ IDC TA (n=27) and matched tumor (n=29) (left panel) and ER+ ILC TA (n=23) and matched tumor (n=24) (right panel). Paired Wilcoxon Rank Test was used for statistical analysis. d. Intra- patient myeloid cell frequencies in ER+ IDC TA (n=19) and matched tumor (n=23) (left panel) and ER+ ILC TA (n=21) and matched tumor (n=23) (right panel). Paired Wilcoxon Rank Test was used for statistical analysis e. Comparison of lymphoid (left) and myeloid (right) infiltrate in ER+ IDC (n=29) vs ILC (n=24) tumor tissues. Non-parametric Mann-Whitney test was used for statistical analysis
Extended Data Fig. 2:
Extended Data Fig. 2:. Immune cell frequencies, T cell characteristics in ER+ IDC and ILC tumor and peripheral blood
a. Stacked bar graph demonstrating patient-wise immune cell composition of ER+ IDC tumors (n=29) b. Stacked bar graph demonstrating patient-wise immune cell composition of ER+ ILC tumors (n=24) c. Pie chart depicting the median percent of T cell functional phenotype composition for CD4+ Tconv (left) and CD8+ T cells (right) in ER+ TIL (top panel) and ER+ PBL (bottom panel) d. Profile of inhibitory receptors PD-1, TIGIT, LAG3, TIM3 and CTLA4 expression on CD8+ T cells in ER+ IDC PBL (n=34) and TIL (n=25) (left panel) and ER+ ILC PBL (n=10) and TIL (n=10) right panel. Dotted line along Y axis denoted 10% of CD8+ T cells. Paired Wilcoxon Rank Test was used for statistical analysis e. Profile of inhibitory receptors PD-1, TIGIT, LAG3, TIM3 and CTLA4 expression on CD4+ T cells in ER+ IDC PBL (n=34) and TIL (n=25) (left panel) and ER+ ILC PBL (n=10) and TIL (n=10) right panel. Dotted line along Y axis denoted 10% of CD4+ Tconv cells. Paired Wilcoxon Rank Test was used for statistical analysis
Extended Data Fig. 3-
Extended Data Fig. 3-. Clinical correlate analysis for ER+ IDC and ILC samples used in the flow cytometry cohort
a. Boxplots demonstrating correlation of pathological grade with total percent CD45+ immune infiltrate (top left), CD4 T cells (top right), CD8 T cells (middle left), macrophages (middle right), M1-like macs (bottom left) and M2-like macs (bottom right) for all ER+ tumors and for grade-wise comparison between ER+ IDC (n=24) and ILC (n=19) samples used in the flow cohort. Non-parametric Wilcoxon rank sum or Kruskal- Wallis test were used for statistical analysis b. Correlation of ER IHC scores with percent total CD45+ immune infiltrate for all ER+ tumors and for ER+ IDC, ILC. Spearman correlation was used for statistical analysis with p value set at 0.05 for significance c. Boxplots depicting range of ER IHC score in IDC and ILC for the entire cohort. Non-parametric Mann Whitney test was used for statistical analysis
Extended Data Fig. 4:
Extended Data Fig. 4:. Multispectral immunohistochemistry analysis and representative images
a. Schematic showing workflow for multispectral immunohistochemistry imaging panel and downstream analysis b. Representative composite and single channel images for each marker used in the panel c. Median cell frequencies for immune cell subsets by mIHC in ER+ tumors (n=115) compared to TNBC (n=21) in tumor bed (left panel) or stroma (right panel). Each circle represents the median value across all regions of interest (ROIs) captured for each patient and bar represents group median. Multiple Mann Whitney non-parametric T test was used for statistical analysis with Holm-Sidak correction for multiple comparison d. Median immune cell frequency distributions in ER+ IDC and ILC and TNBC after excluding HER2+ ER+ IDC and ILC sample across tumor and stromal compartment. Each circle represents the median value across all regions of interest (ROIs) captured for each patient and bar represents group median. Multiple Mann Whitney nonparametric T test was used for statistical analysis with Holm-Sidak correction for multiple comparison e. Pie charts demonstrating median composition of tumor cells and immune cells across all ROIs in ER+ IDC (n=50) (top panel), ILC (n=65) (middle panel) and TNBC (n=21) (bottom panel)
Extended Data Fig. 5:
Extended Data Fig. 5:. Concordance between flow, mIHC cohort and association of cell frequencies with outcome in ER+ IDC and ILC
a. Bar graphs depicting trends for frequency of B cells, CD4+ T cell, CD8+ T cell, Treg and macrophages in ER+ IDC and ILC by flow cytometry (left panel) and mIHC (right panel) b. Median immune cell frequencies for ER+ IDC recurrence (n=17) compared to non-recurrences (n=20) in tumor bed (top panel) and stroma (bottom panel). Each circle represents the median value across all regions of interest (ROIs) captured for each patient and bar represents group median. Multiple Mann Whitney non-parametric T test was used for statistical analysis with Holm-Sidak correction for multiple comparison c. Median immune cell frequencies for ER+ ILC recurrence (n=21) compared to non-recurrences (n=30) in tumor bed (left panel) and stroma (right panel). Each circle represents the median value across all regions of interest (ROIs) captured for each patient and bar represents group median. Multiple Mann Whitney non-parametric T test was used for statistical analysis with Holm-Sidak correction for multiple comparison d. Median M2-like (CD163+CD68+) and M1-like (MHCII+CD68+) frequencies for ER+ IDC recurrence (n=17) compared to non-recurrences (n=20) in tumor bed (left panel) and ER+ ILC recurrence (n=11) compared to non-recurrences (n=20) (right panel). Each circle represents the median value across all regions of interest (ROIs) captured for each patient and bar represents group median. Mann Whitney non-parametric T test was used for statistical testing. e. Tumoral M2: M1 ratio in ER+ IDC ER+ IDC recurrence (n=17) compared to non-recurrences (n=20) (left panel) and in ER+ ILC recurrence (n=11) compared to non-recurrences (n=20) (right panel). Circles represents M2:M1 ratio for each patient. Mann Whitney non-parametric T test was used for statistical testing
Extended Data Fig. 6:
Extended Data Fig. 6:. Distribution of immune cell frequencies across different tumor grades in ER+ IDC and ILC mIHC cohort
a. Table listing p values for correlation of individual immune cell subsets like CD4, CD8 T cells, total macrophages and M1-like and M2-like macrophage with distribution across grade 1, 2, 3 within IDC and ILC. Wilcoxon rank sum test was used for statistical analysis b. Box plots demonstrating correlation of immune cell frequencies in the tumor compartment with pathological grade in all ER+ samples and across grades 1,2 and 3 in ER+ IDC vs ILC. Kruskal- Wallis test was used for statistical analysis. c. Box plots demonstrating correlation of immune cell frequencies in the stromal compartment with pathological grade in all ER+ samples and across grades 1,2 and 3 in ER+ IDC vs ILC. Kruskal- Wallis test was used for statistical analysis.
Extended Data Fig. 7:
Extended Data Fig. 7:. Cellular neighborhood analysis schematic and validation of neighborhoods and intrapatient heterogeneity across ROIs
a. Schematic representing process of identification of cellular neighborhoods with representative images for ER+ IDC, ILC and TNBC b. False color image example of cellular neighborhood composition (left panel) and cell type distribution (right panel) along the X, Y coordinates for cells within a ROI c. Heatmap depicting types of cellular neighborhoods with a distance threshold of 20μm instead of 50μm (Fig 2C) and relative enrichment above or below mean across neighborhoods for B cells (CD20+), CD8+ T cells, CD4+ T cells, Tregs (Foxp3+), tumor cells (PanCK+) and macrophages (CD68+). Likelihood of enrichment calculated as log odds ratio normalized between 5 and −5 d. Frequency distribution of cellular neighborhoods at distance threshold 20μm within ER+ IDC (n=50) and ER+ ILC (n=65). Two tailed Mann Whitney non-parametric T test was used for statistical analysis. e. Heatmap depicting types of cellular neighborhoods with a distance threshold of 70μm instead of 50μm (Fig 2C) and relative enrichment above or below mean across neighborhoods for B cells (CD20+), CD8+ T cells, CD4+ T cells, Tregs (Foxp3+), tumor cells (PanCK+) and macrophages (CD68+). Likelihood of enrichment calculated as log odds ratio normalized between 5 and −5 f. Frequency distribution of cellular neighborhoods at distance threshold 70μm within ER+ IDC (n=50) and ER+ ILC (n=65). Two tailed Mann Whitney non-parametric T test was used for statistical analysis. g. Boxplot visualizing individual patient CN frequencies across ROIs and associated tables listing correlation values for individual ROIs with median value of neighborhood frequency for the patient as a measure of intrapatient heterogeneity in ER+ IDC (left panel) and ILC (right panel). Chi- square test was performed for statistical analysis h. Comparison of variance across ROIs within each CN between IDC and ILC using median standard deviation. Wilcoxon rank sum test was performed for statistical analysis i. Cox-proportional hazards model for overall survival (OS) against log frequency of individual cellular neighborhoods (CNs) as variables adjusting for tumor grade in ER+ IDC (n=50) (left panel) and ER+ILC (n=62) (right panel). Log Hazard ratios with 95% confidence interval with p values for significance are listed for each parameter. Red box highlights significant association between DFS and given variable
Extended Data Fig. 8:
Extended Data Fig. 8:. Logistical regression models for prediction of ER+ IDC and ILC subtype and recurrence vs non- recurrence
a. Table summarizing results of regression models using different features and their associated AUCROC and accuracy. Significant features with predictive value are highlighted in bold in blue color. b. AUC-ROC curves across 5-folds of cross validation (colors represent folds of cross-validation) for ER+ IDC vs ILC subtype classification using neighborhood type (NT) frequencies as a feature and table of model weights associated with features of importance for classification model using neighborhood type frequencies c. AUC-ROC curves across 5-folds of cross validation (colors represent folds of cross-validation) for ER+ IDC vs ILC subtype classification using cell type (CT) frequencies as a feature and associated table of model weights associated with features of importance d. AUC-ROC curves across 5-folds of cross validation (colors represent folds of cross-validation) for ER+ IDC vs ILC subtype classification using neighborhood type (NT) and cell type (CT) frequencies together (NT+ CT) as a feature and associated table of model weights associated with features of importance
Extended Data Fig. 9:
Extended Data Fig. 9:. Logistical regression models for prediction of ER+ IDC and ILC subtype and recurrence vs non- recurrence
a. Density UMAP representing differential cell densities in ER+ TIL (n=14, top panel) and ER+ PBL (n=15, bottom panel) b. Inter patient heterogeneity in percent contribution of immune cell subsets in ER+ IDC and ILC TIL (n=14, top panel) and ER+ IDC and ILC PBL (n=15, bottom panel). Percent contributions for cell subsets normalized to total number of cells recovered from each patient. c. Density UMAP representing differential cell densities in ER+ IDC (middle panel) vs ER+ ILC (right panel) with original tumor infiltrating macrophages UMAP projection as reference (left panel). d. Table listing top 20 significant genes driving the latent time trajectory of tumor infiltrating macrophages in their respective clusters
Extended Data Fig. 10:
Extended Data Fig. 10:. Analysis of monocyte and macrophage polarizing cytokines and chemokines in ER+ IDC and ILC tumor cell line conditioned media
a. Table containing a curated list of cytokines and chemokines directly relevant to monocyte/macrophage polarization, activation and impact on T cell b. Expression of monocyte and macrophage- related chemokine and cytokine genes in ER+ IDC (n=532) and ILC (n=180) patient samples from The Cancer Genome Atlas (TCGA) cohort. Table lists log 2 TPM normalized counts with standard deviation. Highlighted in yellow are the concordant genes found to have a consistent pattern across TCGA, Metabric and SCAN-B cohorts c. Expression of monocyte and macrophage- related chemokine and cytokine genes in ER+ IDC (n=1098) and ILC (n=122) groups from Metabric cohort. Table lists log 2 TPM quantile normalized counts with standard deviation. Highlighted in yellow are the genes found to have a consistent pattern across TCGA, Metabric and SCAN-B cohorts d. Expression of monocyte and macrophage- related chemokine and cytokine genes in ER+ IDC (n=532) and ILC (n=180) patient samples from SCAN-B cohort. Table lists log 2 FPKM normalized counts with standard deviation. Highlighted in yellow are the concordant genes found to have a consistent pattern across TCGA, Metabric and SCAN-B cohorts e. Analysis of cytokine and chemokine concentrations (pg/ ml) using Meso Scale discovery platform in conditioned media collected from ER+ IDC cell lines (n=4: T47D, MCF7, BT474, ZR75–1) and ER+ ILC cell lines (n=4: SUM44, MM134, MM330, BCK4) used in macrophage polarization experiments shown in Fig. 7 c, d. Values in red denote group medians for each analyte. Non-parametric Mann-Whitney test was used for statistical analysis f. Histograms showing comparison of median fluorescence intensity (MFI) for HLA-DR expression in monocytes subjected to M1 polarizing conditions (GM-CSF+ IFNg), M2-polarizing conditions (M-CSF+IL-4+IL-13), IL-15 (MCSF+IL-15) or IL-33 (M-CSF+ IL-33) across 3 healthy donor samples. g. Histograms showing comparison of median fluorescence intensity (MFI) for CD206 expression in monocytes subjected to M1 polarizing conditions (GM-CSF+ IFNg), M2-polarizing conditions (M-CSF+IL-4+IL-13), IL-15 (M-CSF+IL-15) or IL-33 (M-CSF+ IL-33) across 3 healthy donor samples.
Figure 1:
Figure 1:. Phenotypic and Functional Characterization of Immune Infiltrate in ER+ IDC and ILC
a. Overall study schematic detailing patient cohort and experimental approach b. Comparison of percent CD45+fraction of total viable cells by flow cytometry in benign breast tissue (n=7), tumoradjacent tissue (n=51) and ER+ tumor tissues (n=53). Each solid circle represents a patient sample and bar represents group median. Mann Whitney non-parametric two- tailed T test was used for statistical analysis with p value <0.05 considered significant c. Quantification of flow cytometric analysis of immune cell subsets normalized as number of cells/ gm of tissue of benign breast tissues (n=7), tumor-adjacent tissues (n=51) and ER+ tumor tissues (n=53). Mann Whitney nonparametric T test was used for statistical analysiswith p value <0.05 considered significant d. Comparison of percent CD45+fraction of total viable cells by flow cytometry in benign breast tissues (n=7) and ER+ IDC tumor-adjacent tissue (n=28), tumor tissues (n=29) (left panel) and ER+ ILC tumor-adjacent tissues (n=23), tumor tissues (n=24) (right panel). Each solid circle represents a patient sample and bar represents group median. Mann Whitney non-parametric two- tailed T test was used for statistical analysis with p value <0.05 considered significant e. Comparison of T cell functional phenotype between ER+ IDC and ER+ ILC tumor infiltrating CD4+ Tconv cells (left panel) and CD8+ T cells (right panel). Each solid circle represents a patient sample and bar represents group median. Mann Whitney non-parametric two- tailed T test was used for statistical analysis with p value <0.05 considered significant f. Profile of inhibitory receptors PD-1, TIGIT, LAG3, TIM3 and CTLA4 expression on CD4+ Tconv cells in ER+ IDC TIL (n=25) and ER+ ILC (n=10) Paired Wilcoxon Rank Test was used for statistical analysis with p value <0.05 considered significant g. Profile of inhibitory receptors PD-1, TIGIT, LAG3, TIM3 and CTLA4 expression on CD8+ T cells in ER+ IDC TIL (n=25) and ER+ ILC (n=10) Paired Wilcoxon Rank Test was used for statistical analysis with p value <0.05 considered significant h. Ratio of tumor infiltrating M2:M1 macrophages. Each circle represents ratio calculated per patient for ER+ IDC (n=23) and ER+ ILC (n=23). Mann Whitney non-parametric T test was used for statistical analysis with p value <0.05 considered significant
Fig 2:
Fig 2:. In situ spatial distribution reveals distinct patterns of immune infiltration and outcome association in ER+ IDC and ILC
a. Pie charts representing median cellular composition of the tumor microenvironment in ER+ IDC (n=50), ER+ ILC (n=65) and TNBC (n=21) including relative frequencies of B cells, CD4+ T cells, CD8+ T cells, Tregs and macrophages. b. Immune cell frequency distributions in ER+ IDC, ILC and TNBC including HER2+ IDC (n=9) and ILC (n=4) samples (colored in gray) across tumor (left panel) and stromal (right panel) compartments. Each circle represents the median value across all regions of interest (ROIs) captured for each patient and bar represents group median. Multiple Mann Whitney non-parametric T test was used for statistical analysis with Holm-Sidak correction for multiple comparison c. Cox-proportional hazards model for disease-free survival (DFS) against log frequency of B cells, CD4+ T cells, CD8+ T cells, Tregs, total macrophages, M1-like macs and M2-like macs in the tumor compartment as variables adjusting for tumor grade in ER+ IDC (n=47) (left table) and ER+ILC (n=50 or 30) (right table). Hazard ratios with 95% confidence interval with p values for significance are listed for each parameter. Red box highlights the significant association between variable and DFS d. Cox-proportional hazards model for disease-free survival (DFS) against log frequency of B cells, CD4+ T cells, CD8+ T cells, Tregs, total macrophages, M1-like macs and M2-like macs in the stromal compartment as variables adjusting for tumor grade in ER+ IDC (n=47) (left table) and ER+ILC (n=50 or 30) (right table). Hazard ratios with 95% confidence interval with p values for significance are listed for each parameter
Fig 3:
Fig 3:. Macrophages and neighborhoods enriched for macrophages and T cells are associated with better disease-free survival in ER+ IDC but not in ILC
a. Heatmap depicting types of cellular neighborhoods (rows) and relative enrichment above or below mean across neighborhoods for B cells (CD20+), CD8+ T cells, CD4+ T cells, Tregs (Foxp3+), tumor cells (PanCK+) and macrophages (CD68+). Likelihood of enrichment calculated as log odds ratio normalized between 5 and −5 b. Frequency distribution of cellular neighborhoods within ER+ IDC (n=50) and ER+ ILC (n=65). Two tailed Mann Whitney non-parametric T test was used for statistical analysis. c. Pie charts representing median relative contributions of cellular neighborhoods in ER+ IDC (n=50) and ER+ ILC (n=65) samples. d. Neighborhood frequency distribution for recurrence vs non-recurrences subsets within ER+ IDC (left panel) and ER+ ILC (right panel). Each solid circle represents a patient sample. Multiple Mann Whitney non-parametric T test was used for statistical analysis with Holm-Sidak correction for multiple comparisons. e. Cox-proportional hazards model for disease-free survival (DFS) against log frequency of individual cellular neighborhoods (CNs) as variables adjusting for tumor grade in ER+ IDC (n=47) (left panel) and ER+ ILC (n=49) (right panel). Log Hazard ratios with 95% confidence interval with p values for significance are listed for each parameter. Red box highlights the significant association between variable and DFS
Fig 4:
Fig 4:. Transcriptional profile of CD45+ immune cells in ER+ breast identifies monocytes and macrophages as the most divergent cells
a. UMAP projection of clustering of 52,184 cells across 14 ER+ breast cancer patient TIL and 15 PBL showing major immune cell lineages b. Bubble plot showing canonical marker expression across immune cell types utilized in cluster identification. Size of the bubble represents percent population positive for a given marker within the cluster (1%, 50%, 100%) and color represents scaled expression between −2 and 2 c. Quantification of differences between immune cell lineages in ER+ TIL vs PBL using Bhattacharya distance. Each dot represents a subsample of 500 cells from principal component analysis for ER+ IDC or ILC TIL vs PBL and random sample regardless of the subtype. Box plot represents quartiles for 100 replicates of testing and color indicates similarity or divergence based on Bhattacharya distance (greater distance= greater divergence). Fold change denotes difference between random and test groups. All comparison were tested using Wilcoxon rank-sum test and were significant (p<0.05) due to 100 replicates of testing. d. Quantification of differences between immune cell lineages in ER+ IDC TIL vs ER+ ILC TIL using Bhattacharya distance. Each dot represents a subsample of 500 cells from principal component analysis for ER+ IDC vs ILC TIL and random sample regardless of the subtype. Box plot represents quartiles for 100 replicates of testing and color indicates similarity or divergence based on Bhattacharya distance (greater distance= greater divergence). Fold change denotes difference between random and test groups. All comparison were tested using Wilcoxon rank-sum test and were significant (p<0.05) due to 100 replicates of testing. e. Re-clustering of 7,147 monocytes and macrophages recovered from all ER+ IDC and ILC tumor samples yielded 5 distinct clusters shown in their UMAP projection f. Stacked bar graph depicting the distribution of monocyte and macrophage clusters across patient samples in ER+ IDC (n=7) and ER+ ILC (n=7)
Fig 5:
Fig 5:. Dissecting the transcriptomic landscape of tumor infiltrating monocytes and macrophages in ER+IDC and ILC
a. Bubble plot showing canonical marker expression across immune cell types utilized in cluster identification. Size of the bubble represents percent population positive for a given marker within the cluster (1%, 50%, 100%) and color represents scaled expression between −2 and 2 b. Velocity map showing directionality of monocyte/ macrophage development, maturation and activation status superimposed on original UMAP representation of different macrophage clusters in ER+ IDC and ILC tumors. c. Relationship between different monocyte and macrophage clusters across the latent time trajectory. Box plots represent quartile distribution of each cell in given cluster. d. Comparison of relative log2 fold change for differentially expressed genes in ER+IDC cluster 2 compared to all other clusters and ER+ ILC cluster 2 compared to all other clusters. Wilcoxon sum rank test was used for statistical testing with adjusted p value set at less than 0.05 for significance e. Comparison of relative log2 fold change for differentially expressed genes in ER+IDC cluster 3 compared to all other clusters and ER+ ILC cluster 3 compared to all other clusters. Wilcoxon sum rank test was used for statistical testing with adjusted p value set at less than 0.05 for significance
Fig 6:
Fig 6:. Macrophages infiltrating ER+ IDC and ILC tumors are transcriptomically and functionally distinct with potentially different interactions with T cells
a. Significantly enriched pathways identified using SPIA pathway analysis of all differentially expressed genes in macrophage cluster 2 . Length of bars along the concentric circles denote relative enrichment (tA) of pathways between ER+ IDC (left circle) and ER+ ILC (right circle) b. Significantly enriched pathways identified using SPIA pathway analysis of all differentially expressed genes in macrophage cluster 3. Length of bars along the concentric circles denote relative enrichment (tA) of pathways between ER+ IDC (left circle) and ER+ ILC (right circle) c. Circos plots highlighting potential cellular interactions through receptor-ligand expression analysis between monocytes/macrophages and CD4+ or CD8+ T cells in ER+ IDC tumors with top 10 receptor-ligand pairs between monocytes/ macrophages and T cells listed in the table below d. Circos plots highlighting potential cellular interactions through receptor-ligand expression analysis between monocytes/macrophages and CD4+ or CD8+ T cells in ER+ ILC tumors with top 10 receptorligand pairs between monocytes/ macrophages and T cells listed in the table below
Fig 7:
Fig 7:. Macrophages infiltrating ER+ IDC and ILC are phenotypically distinct as a result of tumor cellmediated preferential polarization into M1 and M2-like macrophages
a. Quantification of M2- like (CD163+CD68+) and M1-like (MHCII+ CD68+) macrophages infiltrating tumor bed (left panel) and stroma (right panel) using mIHC for ER+ IDC (n=50) and ER+ ILC (n=45). Each circle represents median across ROIs within each patient and bars represent median for group. Mann Whitney non-parametric T test was used for statistical testing. b. Ratio of M2:M1 macrophages calculated from numbers in C within each patient for ER+ IDC (n=50) and ER+ ILC (n=45) within tumor bed (left panel) and stroma (right panel). Each circle represented individual patients and bars represent median for the group. Mann Whitney non-parametric T test was used for statistical testing. c. Representative flow plots (top panel) for gating M1-like and quantification of percent M1- like macrophages (HLA-DR+CD64+) (bottom panel) post in vitro polarization of healthy donor monocytes. Polarization cocktails containing GM-CSF+ IFNg for M1-like and MCSF+IL-4+IL-13 for M2-like controls was tested across 10 healthy donors each. For test conditions, each circle represents a healthy donor tested with tumor cell line conditioned media for ER+ IDC [T47D(n=10), MCF7(n=11), ZR75–1(n=3), BT474(n=3)] and ER+ ILC [MDA-MB 134(n=10), BCK4(n=7), MDA-MB 330(n=5), SUM44(n=10)]. Multiple Mann Whitney non-parametric T test was used for statistical analysis with Holm-Sidak correction for multiple comparisons d. Representative flow plots (top panel) for gating M2-like and quantification of percent M2-like macrophages (CD163++CD206+) (bottom panel) post in vitro polarization of healthy donor monocytes. Polarization cocktails containing GM-CSF+ IFNg for M1-like and MCSF+IL-4+IL-13 for M2-like controls was tested across 10 healthy donors each. For test conditions, each circle represents a healthy donor tested with tumor cell line conditioned media for ER+ IDC [T47D(n=10), MCF7(n=11), ZR75–1(n=3), BT474(n=3)] and ER+ ILC [MDA-MB 134(n=10), BCK4(n=7), MDA-MB 330(n=5), SUM44(n=10)]. Multiple Mann Whitney non-parametric T test was used for statistical analysis with Holm-Sidak correction for multiple comparisons e. M2:M1 ratio calculated from percent M2 and M1 macrophages within each healthy donor replicate for IDC and ILC conditioned media (sups). Each circle represents replicate HDs combined for all IDC and ILC cell lines and bar represents median for the group. Mann Whitney non-parametric T test was used for statistical testing.

References

    1. Gatti-Mays ME, B. J, Gameiro SR, Bear HD, Prabhakaran S, Fukui J et al., If we build it they will come: targeting the immune response to breast cancer. NPJ Breast Cancer, 2019. 5:37. - PMC - PubMed
    1. Emens LA, Breast Cancer Immunotherapy: Facts and Hopes. Clin Cancer Res (Epub ahead of print), 2017. 3001.2017. - PMC - PubMed
    1. Barroso-Sousa R, & Metzger-Filho O, Differences between invasive lobular and invasive ductal carcinoma of the breast: results and therapeutic implications. Therapeutic Advances in Medical Oncology, 8(4), 261–266, 2016. - PMC - PubMed
    1. Pestalozzi BC, Z. D, Mallon E, Gusterson BA, Price KN, Gelber RD et al., Distinct clinical and prognostic features of infiltrating lobular carcinoma of the breast: combined results of 15 International Breast Cancer Study Group clinical trials. J Clin Oncol, 2008. 20; 26(18):3006–14. - PubMed
    1. Arpino G, Bardou VJ, Clark GM, & Elledge RM , Infiltrating lobular carcinoma of the breast: tumor characteristics and clinical outcome. Breast Cancer Research, 6(3), R149–R156., 2004. - PMC - PubMed

Publication types