. 2023 Mar 16;13(1):4337.
doi: 10.1038/s41598-023-31024-w.

Gut microbiome signatures of Yorkshire Terrier enteropathy during disease and remission

Affiliations

Gut microbiome signatures of Yorkshire Terrier enteropathy during disease and remission

Pavlos G Doulidis et al. Sci Rep. .

Abstract

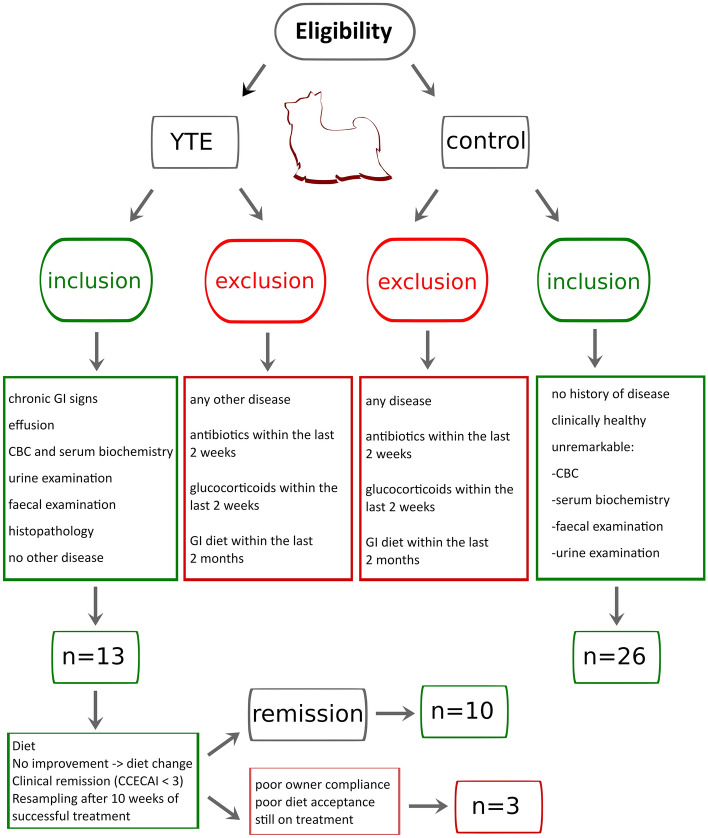
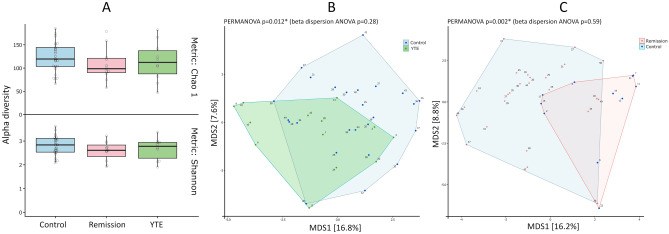
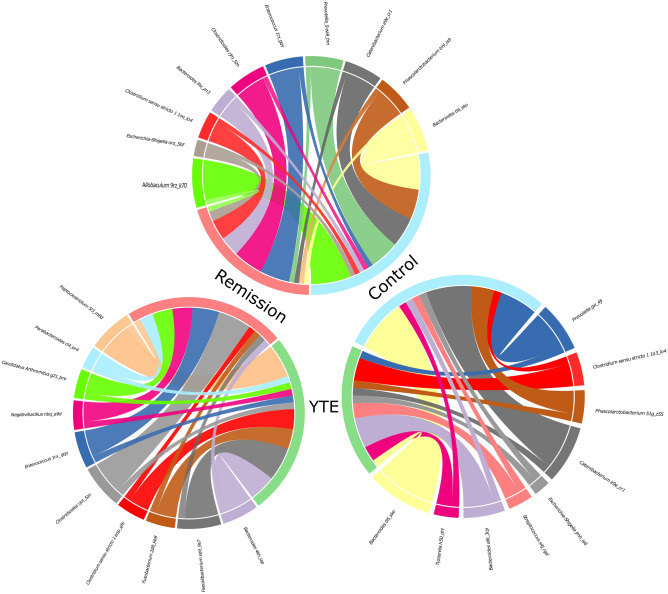
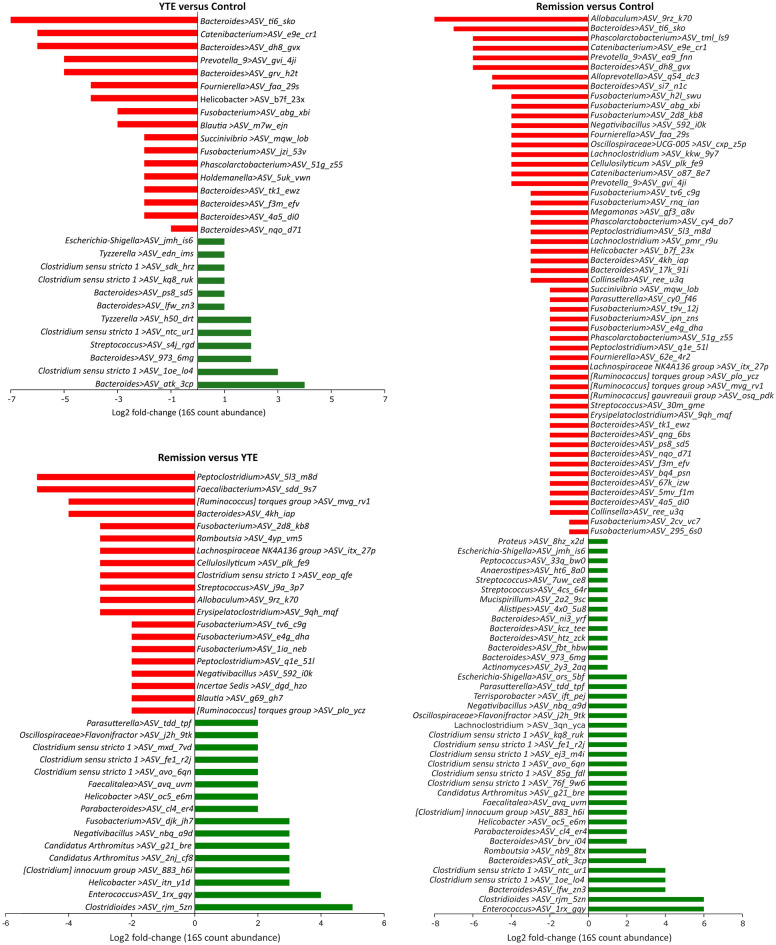
The role of the gut microbiome in developing Inflammatory Bowel Disease (IBD) in humans and dogs has received attention in recent years. Evidence suggests that IBD is associated with alterations in gut microbial composition, but further research is needed in veterinary medicine. The impact of IBD treatment on the gut microbiome needs to be better understood, especially in a breed-specific form of IBD in Yorkshire Terriers known as Yorkshire Terrier Enteropathy (YTE). This study aimed to investigate the difference in gut microbiome composition between YTE dogs during disease and remission and healthy Yorkshire Terriers. Our results showed a significant increase in specific taxa such as Clostridium sensu stricto 1, Escherichia-Shigella, and Streptococcus, and a decrease in Bacteroides, Prevotella, Alloprevotella, and Phascolarctobacterium in YTE dogs compared to healthy controls. No significant difference was found between the microbiome of dogs in remission and those with active disease, suggesting that the gut microbiome is affected beyond clinical recovery.


Conflict of interest statement

The authors declare no competing interests.

Figures

Figure 1
Figure 1
Inclusion and exclusion criteria for subject selection in this study. Diagram illustrating the inclusion and exclusion criteria applied to determine the composition of the three groups (YTE, control and remission).
Figure 2
Figure 2
Classification of the Yorkshire terrier cohort used in this study according to the canine chronic enteropathy activity index (CCECAI). This index was used to calculate clinical severity of the enteropathy in all dogs. Assessing the severity of alterations in 9 different categories, including attitude and activity, appetite, vomiting, faecal consistency, defecation frequency, weight loss, serum albumin concentration, peripheral edema and ascites, and pruritus. Differences among groups were inferred from a Kruskal–Wallis test (p < .00001) followed by Mann–Whitney U-test to compare the three groups.
Figure 3
Figure 3
Alpha and Beta diversity analysis of microbiome of the studied Yorkshire terrier cohort. Alpha diversity of the microbiome in Yorkshire Terrier Enteropathy group (YTE) compared to control and remission groups (A) Shannon or Chao1 metrics show no significant differences among the three groups. Beta diversity shows significant difference between YTE and control (B) and between remission and control (C) but not between YTE and remission dogs.
Figure 4
Figure 4
Chord diagrams showing the associations between differentially abundant taxa of Yorkshire Terrier Enteropathy (YTE), Remission and Control groups. Only the most abundant microbiome ASVs detected are shown. For better comprehension, each circle include two comparisons each time (remission in light red, YTE in green, and control in light blue). The chord diagrams show the key bacterial taxa identified by their comparative abundance. The outer ribbon identifies the respective clinical states (groups) and encompasses the perturbed taxa associated with each state. Chords connect taxa related to more than one state in the inner circle. Only significant hits are represented in these chord charts (at least p < 0.05).
Figure 5
Figure 5
Differential abundances of the ASVs found in the YTE, Remission and Control group gut microbiomes. The shown data were determined by 16S rRNA gene sequencing. The red bars represent bacterial taxa showing a significant decrease during dysbiosis. In contrast, green bars represent those bacteria significantly more abundant in a given condition, expressed as the log2 fold-change in abundance. Only significant hits are represented in these plots (at least p < 0.05).

References

    1. Vázquez-Baeza Y, Hyde ER, Suchodolski JS, Knight R. Dog and human inflammatory bowel disease rely on overlapping yet distinct dysbiosis networks. Nat. Microbiol. 2016;1:1. doi: 10.1038/nmicrobiol.2016.177. - DOI - PubMed
    1. Cerquetella M, et al. Inflammatory bowel disease in the dog: Differences and similarities with humans. World J. Gastroenterol. WJG. 2010;16:1050. doi: 10.3748/wjg.v16.i9.1050. - DOI - PMC - PubMed
    1. Washabau RJ, et al. Endoscopic, biopsy, and histopathologic guidelines for the evaluation of gastrointestinal inflammation in companion animals. J. Vet. Intern. Med. 2010;24:10–26. doi: 10.1111/j.1939-1676.2009.0443.x. - DOI - PubMed
    1. Dandrieux JRS. Inflammatory bowel disease versus chronic enteropathy in dogs: Are they one and the same? J. Small Anim. Pract. 2016;57:589–599. doi: 10.1111/jsap.12588. - DOI - PubMed
    1. Turpin W, Goethel A, Bedrani L, Croitoru K. Determinants of IBD heritability: Genes, bugs, and more. Inflamm. Bowel Dis. 2018;24:1133. doi: 10.1093/ibd/izy085. - DOI - PMC - PubMed

Publication types