

Association of Mitochondrial DNA Copy Number With Brain MRI Markers and Cognitive Function: A Meta-analysis of Community-Based Cohorts
- PMID: 36927883
- PMCID: PMC10159770
- DOI: 10.1212/WNL.0000000000207157
Association of Mitochondrial DNA Copy Number With Brain MRI Markers and Cognitive Function: A Meta-analysis of Community-Based Cohorts
Abstract
Background and objectives: Previous studies suggest that lower mitochondrial DNA (mtDNA) copy number (CN) is associated with neurodegenerative diseases. However, whether mtDNA CN in whole blood is related to endophenotypes of Alzheimer disease (AD) and AD-related dementia (AD/ADRD) needs further investigation. We assessed the association of mtDNA CN with cognitive function and MRI measures in community-based samples of middle-aged to older adults.
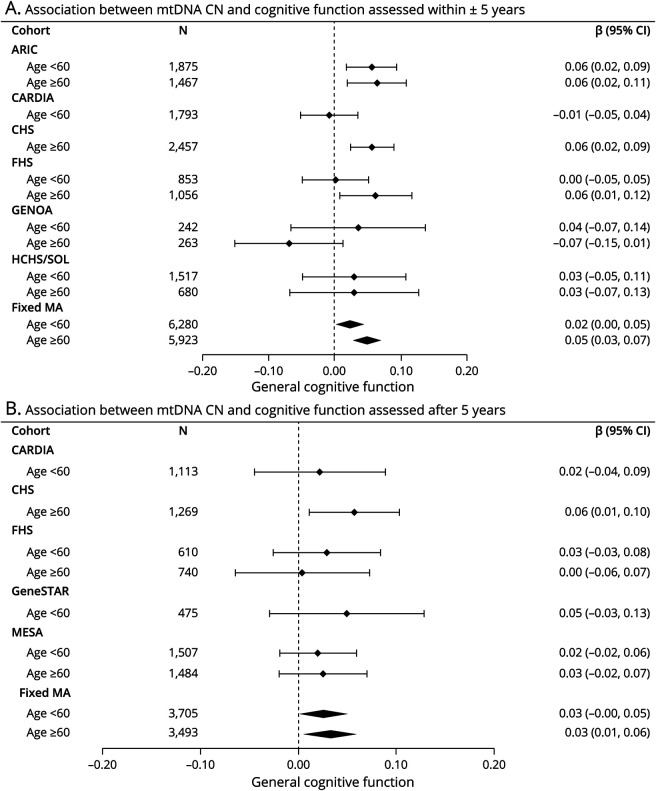
Methods: We included dementia-free participants from 9 diverse community-based cohorts with whole-genome sequencing in the Trans-Omics for Precision Medicine (TOPMed) program. Circulating mtDNA CN was estimated as twice the ratio of the average coverage of mtDNA to nuclear DNA. Brain MRI markers included total brain, hippocampal, and white matter hyperintensity volumes. General cognitive function was derived from distinct cognitive domains. We performed cohort-specific association analyses of mtDNA CN with AD/ADRD endophenotypes assessed within ±5 years (i.e., cross-sectional analyses) or 5-20 years after blood draw (i.e., prospective analyses) adjusting for potential confounders. We further explored associations stratified by sex and age (<60 vs ≥60 years). Fixed-effects or sample size-weighted meta-analyses were performed to combine results. Finally, we performed mendelian randomization (MR) analyses to assess causality.
Results: We included up to 19,152 participants (mean age 59 years, 57% women). Higher mtDNA CN was cross-sectionally associated with better general cognitive function (β = 0.04; 95% CI 0.02-0.06) independent of age, sex, batch effects, race/ethnicity, time between blood draw and cognitive evaluation, cohort-specific variables, and education. Additional adjustment for blood cell counts or cardiometabolic traits led to slightly attenuated results. We observed similar significant associations with cognition in prospective analyses, although of reduced magnitude. We found no significant associations between mtDNA CN and brain MRI measures in meta-analyses. MR analyses did not reveal a causal relation between mtDNA CN in blood and cognition.
Discussion: Higher mtDNA CN in blood is associated with better current and future general cognitive function in large and diverse communities across the United States. Although MR analyses did not support a causal role, additional research is needed to assess causality. Circulating mtDNA CN could serve nevertheless as a biomarker of current and future cognitive function in the community.
Written work prepared by employees of the Federal Government as part of their official duties is, under the U.S. Copyright Act, a “work of the United States Government” for which copyright protection under Title 17 of the United States Code is not available. As such, copyright does not extend to the contributions of employees of the Federal Government.
Conflict of interest statement
B.M. Psaty serves on the Steering Committee of the Yale Open Data Access Project, funded by Johnson & Johnson. The other authors report no relevant disclosures. Go to
Figures


References
-
- 2021 Alzheimer's disease facts and figures. Alzheimers Dement. 2021;17:327-406. - PubMed
-
- Voet D. Fundamentals of Biochemistry. Wiley; 2016.
Publication types
MeSH terms
Substances
Grants and funding
- R01 NS017950/NS/NINDS NIH HHS/United States
- R01 AG054076/AG/NIA NIH HHS/United States
- RF1 AG059421/AG/NIA NIH HHS/United States
- R01 AG048642/AG/NIA NIH HHS/United States
- P50 HD105351/HD/NICHD NIH HHS/United States
- U01 MH105632/MH/NIMH NIH HHS/United States
- K01 HL143142/HL/NHLBI NIH HHS/United States
- R35 AG071916/AG/NIA NIH HHS/United States
- R01 AG063887/AG/NIA NIH HHS/United States
- P30 AG072972/AG/NIA NIH HHS/United States
- R01 HL117626/HL/NHLBI NIH HHS/United States
- R01 HL155569/HL/NHLBI NIH HHS/United States
- R01 HL120393/HL/NHLBI NIH HHS/United States
- R01 EB015611/EB/NIBIB NIH HHS/United States
- RF1 AG054548/AG/NIA NIH HHS/United States
- R01 MH078111/MH/NIMH NIH HHS/United States
- P30 AG066546/AG/NIA NIH HHS/United States
- U01 AG052409/AG/NIA NIH HHS/United States
- P30 AG072947/AG/NIA NIH HHS/United States
- R01 AG058464/AG/NIA NIH HHS/United States
- R01 MH083824/MH/NIMH NIH HHS/United States