. 2023 Mar 16;13(1):4345.
doi: 10.1038/s41598-023-31382-5.

A urine-based ELISA with recombinant non-glycosylated SARS-CoV-2 spike protein for detecting anti-SARS-CoV-2 spike antibodies

Affiliations

A urine-based ELISA with recombinant non-glycosylated SARS-CoV-2 spike protein for detecting anti-SARS-CoV-2 spike antibodies

Fernanda F Ramos et al. Sci Rep. .

Abstract

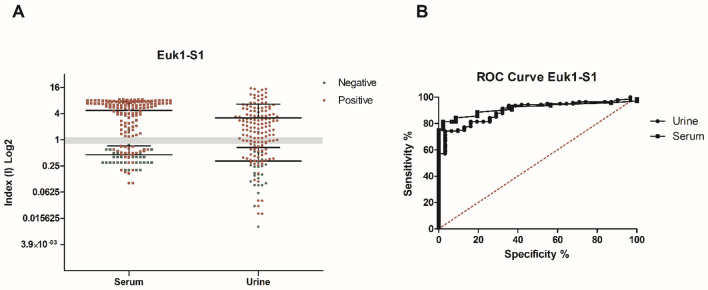
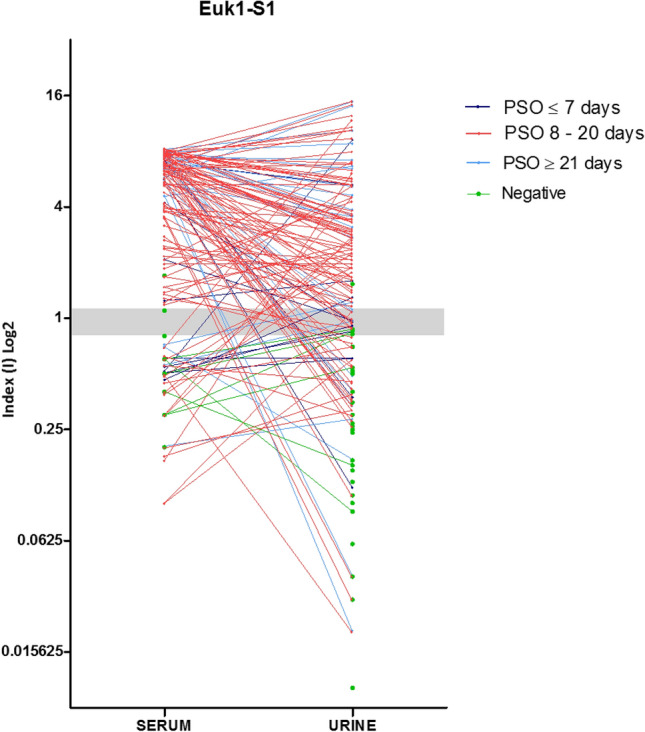
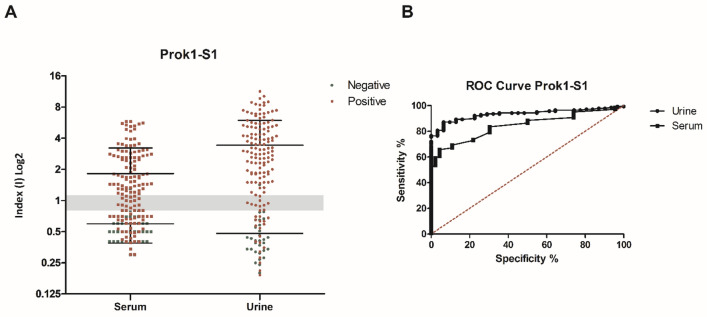
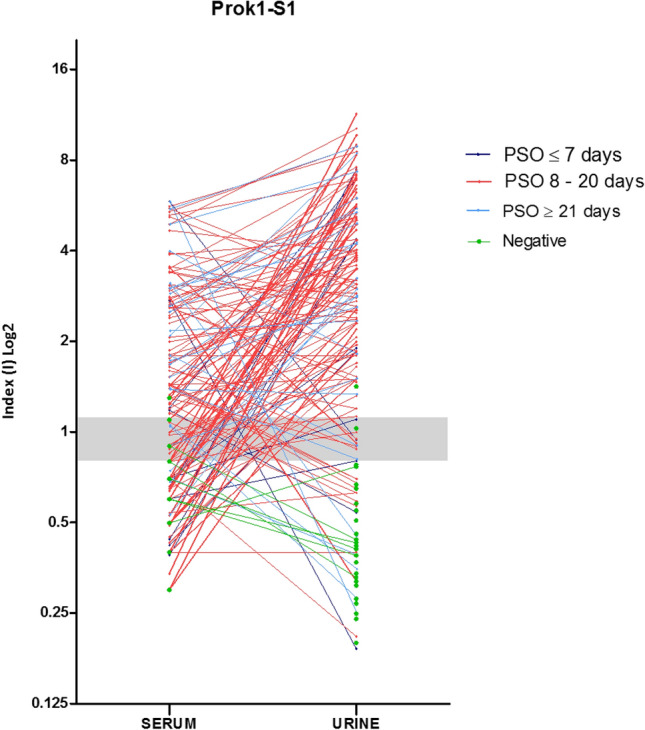
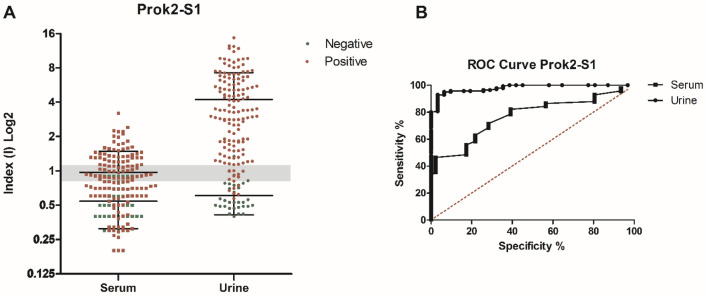
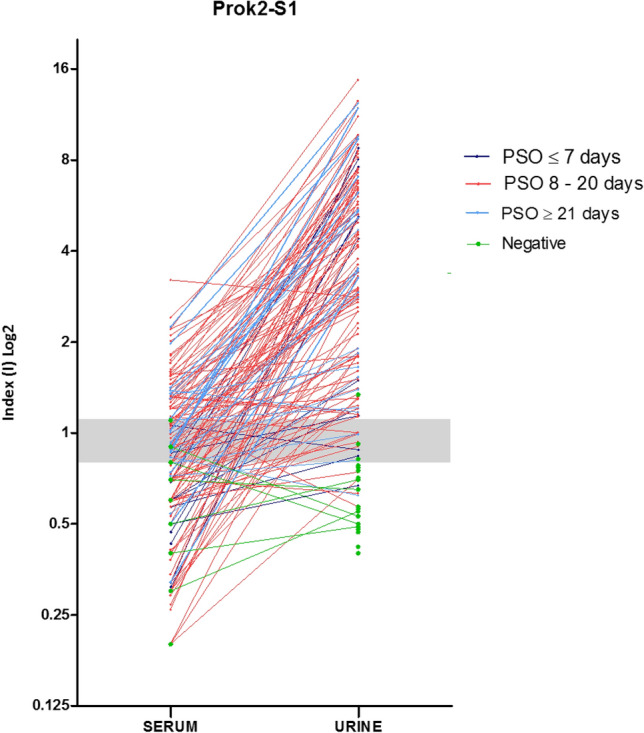
Serological assays have been widely used to detect anti-SARS-CoV-2 antibodies, which are generated from previous exposure to the virus or after vaccination. The presence of anti-SARS-CoV-2 Nucleocapsid antibodies was recently reported in patients´ urine using an in-house urine-based ELISA-platform, allowing a non-invasive way to collect clinical samples and assess immune conversion. In the current study, we evaluated and validated another in-house urine-based ELISA for the detection of anti-SARS-CoV-2 Spike antibodies. Three partial recombinant SARS-CoV-2 Spike proteins comprising the Receptor Binding Domain, expressed in eukaryotic or prokaryotic systems, were tested in an ELISA platform against a panel of over 140 urine and paired serum samples collected from 106 patients confirmed positive for SARS-CoV-2 by qRT-PCR. The key findings from our study were that anti-SARS-CoV-2 Spike antibodies could be detected in urine samples and that the prokaryotic expression of the rSARS-CoV-2 Spike protein was not a barrier to obtain relatively high serology efficiency for the urine-based assay. Thus, use of a urine-based ELISA assay with partial rSARS-CoV-2 Spike proteins, expressed in a prokaryotic system, could be considered as a convenient tool for screening for the presence of anti-SARS-CoV-2 Spike antibodies, and overcome the difficulties arising from sample collection and the need for recombinant proteins produced with eukaryotic expression systems.


Conflict of interest statement

A patent application to the Brazilian National Institute of Industrial Property was issued by UFMG under case number BR 10 2021 014066 6 with FFR, FFB, PFV, JAOS, TARR, CGR, VN, FGF, EAFC and FL as inventors. The authors declare that they have no other competing of interests.

Figures

Figure 1
Figure 1
Comparative diagnostic performance of rSARS-CoV-2 Euk1-S1 protein with patient urine and serum samples. (A) ELISA assays were done using positive samples (n = 140 urine and n = 140 serum) from COVID-19 patients with previously positive qRT-PCR and negative samples (n = 31 urine and n = 46 serum). The mean of each group is shown and the gray band indicates indeterminate values for each sample, while index values below the range (< 0.8) are negative and values above (> 1.1) are considered positive. (B) Receiver Operating Characteristic (ROC) curves were constructed using the individual index (I) value for each sample, to obtain sensitivity, specificity and area under the curve values.
Figure 2
Figure 2
Evaluation of comparative urine and serum index values (I) for each patient according to the days Post-Symptoms Onset (PSO) by using rSARS-CoV-2 Euk1-S1 protein. The index values obtained from urine and serum samples for each patient are represented by circles and when paired they are interconnected by lines, each color being specific to the collection period after the onset of symptoms. Individual data were divided according to the PSO days of the collection date, i.e. at ≤ 7 days, 8 to 20 days and ≥ 21 days.
Figure 3
Figure 3
Comparative diagnostic performance of rSARS-CoV-2 Prok1-S1 protein with patient urine and serum samples. (A) ELISA assays were done using positive samples (n = 140 urine and n = 140 serum) from COVID-19 patients with previously positive qRT-PCR and negative samples (n = 31 urine and n = 46 serum). The mean of each group is shown and the gray band indicates indeterminate values for each sample, while index values below the range (< 0.8) are negative and values above (> 1.1) are considered positive. (B) Receiver Operating Characteristic (ROC) curves were constructed using the individual index (I) value for each sample, to obtain sensitivity, specificity and area under the curve values.
Figure 4
Figure 4
Evaluation of comparative urine and serum index values (I) for each patient according to the days post-symptoms onset (PSO) by using rSARS-CoV-2 Prok1-S1 protein. The index values obtained from urine and serum samples for each patient are represented by circles and when paired they are interconnected by lines, each color being specific to the collection period after the onset of symptoms Individual data were divided according to the PSO days of the collection date, i.e. at ≤ 7 days, 8 to 20 days and ≥ 21 days.
Figure 5
Figure 5
Comparative diagnostic performance of rSARS-CoV-2 Prok2-S1 protein with patient urine and serum samples. (A) ELISA assays were done using positive samples (n = 140 urine and n = 140 serum) from COVID-19 patients with previously positive qRT-PCR and negative samples (n = 31 urine and n = 46 serum). The mean of each group is shown and the gray band indicates indeterminate values for each sample, while index values below the range (< 0.8) are negative and values above (> 1.1) are considered positive. (B) Receiver Operating Characteristic (ROC) curves were constructed using the individual index (I) value for each sample, to obtain sensitivity, specificity and area under the curve values.
Figure 6
Figure 6
Evaluation of comparative urine and serum index values (I) of each patient according to the days post-symptoms onset (PSO) by using rSARS-CoV-2 Prok2-S1 protein. The index values obtained from urine and serum samples for each patient are represented by circles and when paired they are interconnected by lines, each color being specific to the collection period after the onset of symptoms Individual data were divided according to the PSO days of the collection date, i.e. at ≤ 7 days, 8 to 20 days and ≥ 21 days.

References

    1. WHO. Coronavirus (COVID-19) dashboard. World Health Organization. https://COVID19.who.int/ (2021).
    1. FDA. EUA authorized serology test performance. Food and Drug Administration. https://www.fda.gov/medical-devices/coronavirus-disease-2019-covid-19-em... (2021)
    1. WHO. Antigen-detection in the diagnosis of SARS-CoV-2 infection. World Health Organization. https://www.who.int/publications/i/item/antigen-detection-in-the-diagnos... (2021).
    1. Amanat F, et al. A serological assay to detect SARS-CoV-2 seroconversion in humans. Nat. Med. 2020;26:1033–1036. doi: 10.1038/s41591-020-0913-5. - DOI - PMC - PubMed
    1. Weissleder R, Lee H, Ko J, Pittet MJ. COVID-19 diagnostics in context. Sci. Transl. Med. 2020;12:543. doi: 10.1126/scitranslmed.abc1931. - DOI - PubMed

Publication types

Substances