. 2023 May;37(5):1068-1079.
doi: 10.1038/s41375-023-01867-3. Epub 2023 Mar 16.

Inhibition of ERK1/2 signaling prevents bone marrow fibrosis by reducing osteopontin plasma levels in a myelofibrosis mouse model

Affiliations

Inhibition of ERK1/2 signaling prevents bone marrow fibrosis by reducing osteopontin plasma levels in a myelofibrosis mouse model

Elisa Bianchi et al. Leukemia. 2023 May.

Abstract

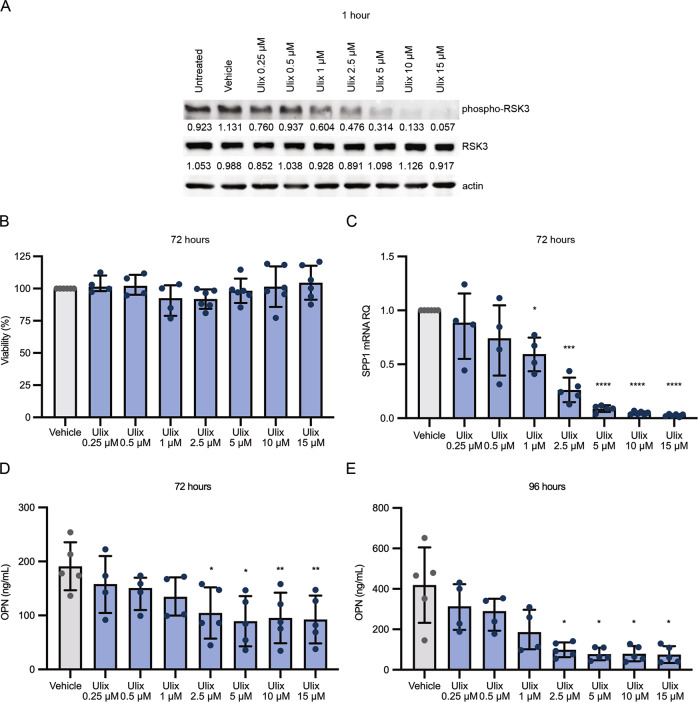
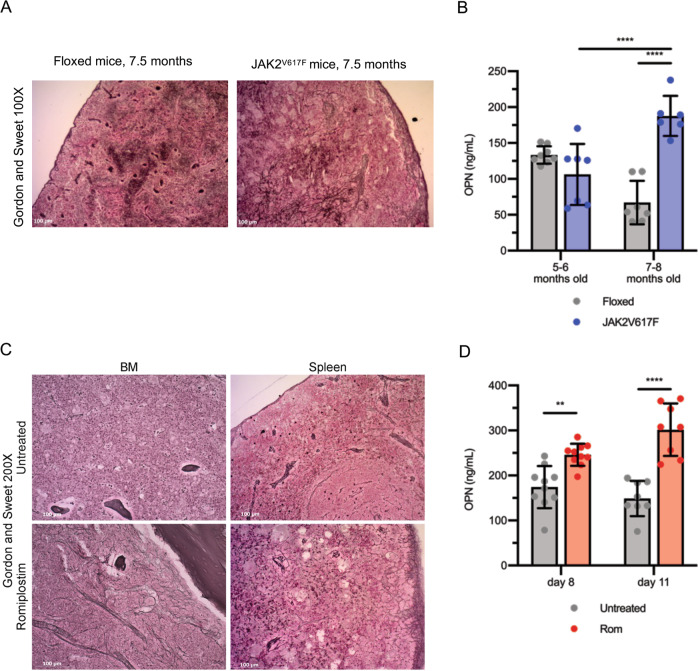
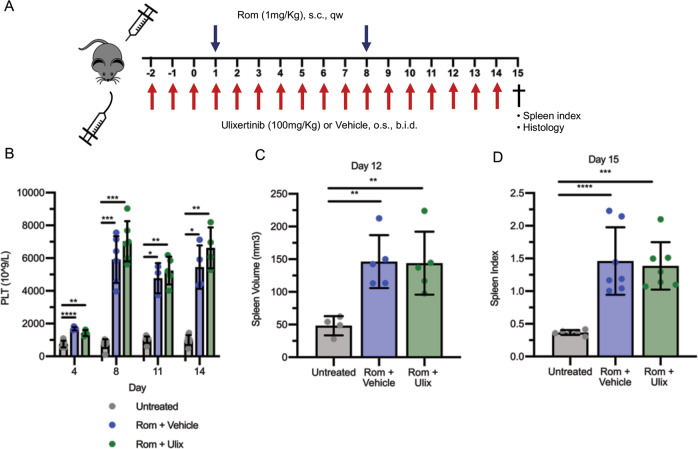
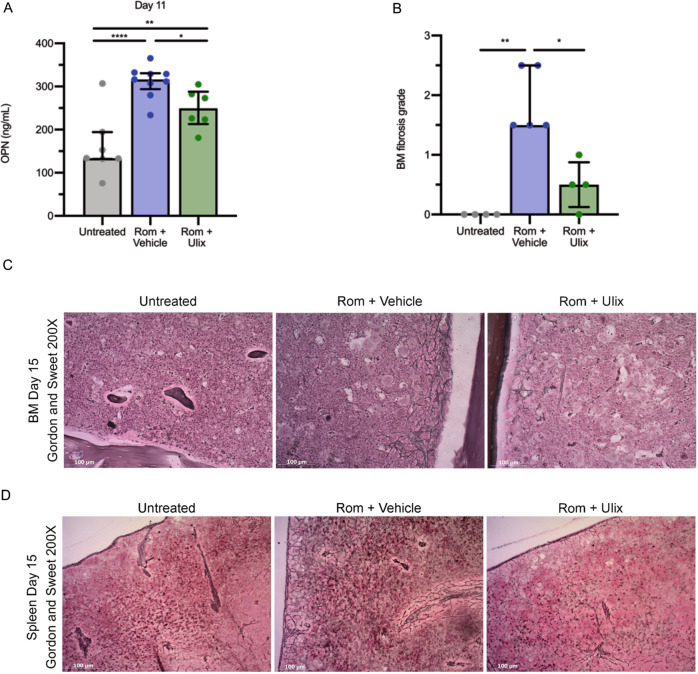
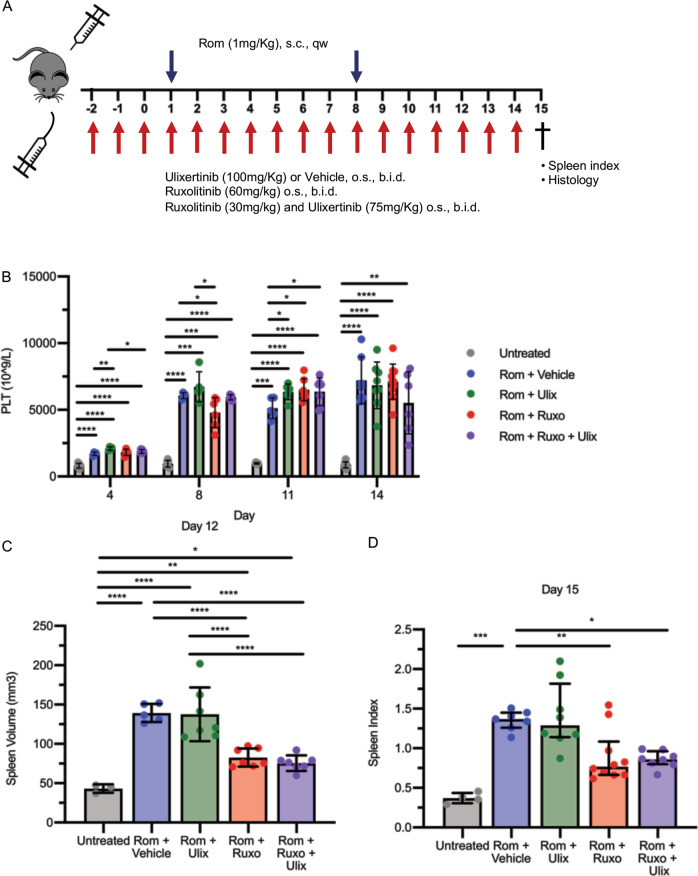
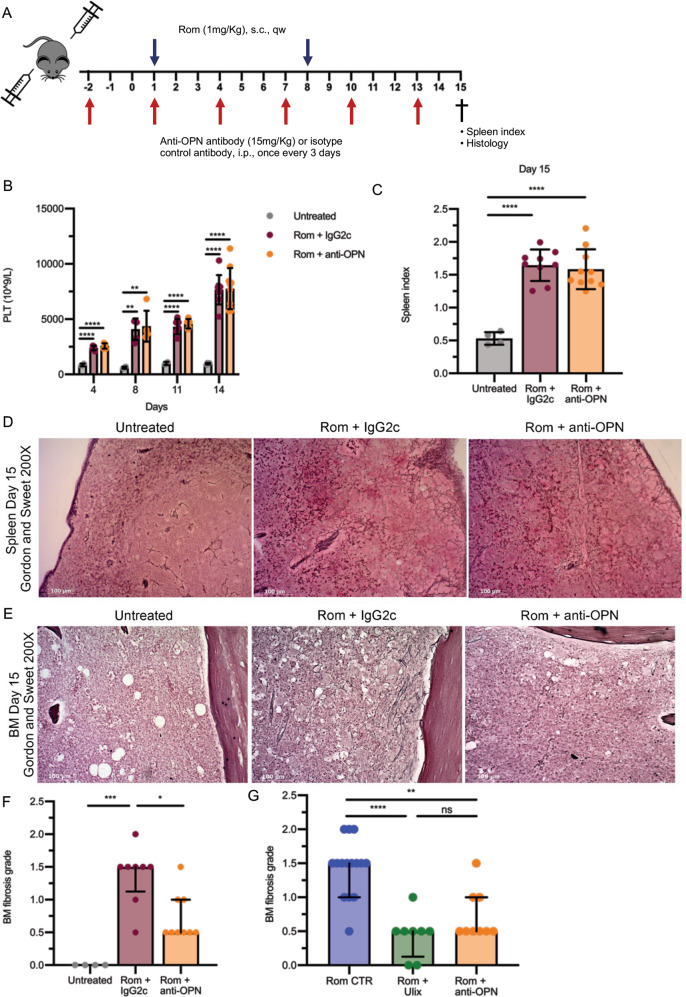
Clonal myeloproliferation and development of bone marrow (BM) fibrosis are the major pathogenetic events in myelofibrosis (MF). The identification of novel antifibrotic strategies is of utmost importance since the effectiveness of current therapies in reverting BM fibrosis is debated. We previously demonstrated that osteopontin (OPN) has a profibrotic role in MF by promoting mesenchymal stromal cells proliferation and collagen production. Moreover, increased plasma OPN correlated with higher BM fibrosis grade and inferior overall survival in MF patients. To understand whether OPN is a druggable target in MF, we assessed putative inhibitors of OPN expression in vitro and identified ERK1/2 as a major regulator of OPN production. Increased OPN plasma levels were associated with BM fibrosis development in the Romiplostim-induced MF mouse model. Moreover, ERK1/2 inhibition led to a remarkable reduction of OPN production and BM fibrosis in Romiplostim-treated mice. Strikingly, the antifibrotic effect of ERK1/2 inhibition can be mainly ascribed to the reduced OPN production since it could be recapitulated through the administration of anti-OPN neutralizing antibody. Our results demonstrate that OPN is a novel druggable target in MF and pave the way to antifibrotic therapies based on the inhibition of ERK1/2-driven OPN production or the neutralization of OPN activity.


Conflict of interest statement

The authors declare no competing interests.

Figures

Fig. 1
Fig. 1. ERK1/2 inhibition using Ulixertinib reduces OPN production by monocytes in vitro.
Normal human monocytes were treated with increasing concentration of ERK1/2 inhibitor Ulixertinib. A Western blot analysis of phospho-RSK3 protein levels in monocyte after Ulixertinib treatment. B Monocytes viability was evaluated using XTT assay after 72 h of treatment. C SPP1 mRNA expression was evaluated by means of real time qRT-PCR after 72 h of treatment. OPN production by monocytes was assessed by means of ELISA (Enzyme-linked immunosorbent assay) in culture supernatants at 72 (D) and 96 hours (E) of treatment. Histograms represent the mean values while bars indicate the standard deviation. Comparisons were performed by means of one-way ANOVA. *: P ≤ 0.05; **: P ≤ 0.01; ***: P ≤ 0.001; ****: P ≤ 0.0001 Abbreviations: SPP1 osteopontin; RQ relative quantity; OPN osteopontin; Ulix Ulixertinib.
Fig. 2
Fig. 2. Plasma OPN is increased in MF mouse models.
A Representative images of Gordon and Sweet’s reticulin staining of spleen sections from JAK2V617F/+ mice and control JAK2floxed/+ animals 7.5 months after birth. Magnification 100×. B OPN plasma levels were evaluated by means of ELISA (enzyme-linked immunosorbent assay) in JAK2V617F/+ and JAK2floxed/+ mice at 5-6 months and 7–8 months after birth. (n = 6–8/group). C BM and spleen fibrosis detection by Gordon and Sweet’s reticulin staining in mice treated with thrombopoietin mimetic Romiplostim (Rom) and control animals (Untreated). Magnification 200×. D Protein levels of OPN were assessed by means of ELISA in plasma from mice treated with Romiplostim or in control animals 8 and 11 days after the first administration (n = 8–10/group). Histograms represent mean values while bars indicate the standard deviation. Comparisons were performed by means of one-way ANOVA. *: P ≤ 0.05; **: P ≤ 0.01; ***: P ≤ 0.001; ****: P ≤ 0.0001 Abbreviations: OPN osteopontin; Rom romiplostim; BM bone marrow.
Fig. 3
Fig. 3. ERK1/2 inhibition does not affect thrombocytosis and splenomegaly induced by Romiplostim.
A Schematic outline of the experimental design. Mice were given Romiplostim 1 mg/kg through sub-cutaneous injection once weekly. ERK1/2 inhibitor Ulixertinib 100 mg/kg or vehicle (10% DMSO in 20% SBE-β-CD in saline) was administered through oral gavage twice daily starting 3 days before the first Romiplostim injection. Mice were sacrificed after 15 days of Romiplostim treatment. B Platelet count of control mice (Untreated, in gray, n = 6–9/group), mice treated with Romiplostim alone (Rom + Vehicle, in blue, n = 4–6/group) and animals treated with Romiplostim and Ulixertinib (Rom + Ulix, in green, n = 4–6/group). Platelet count was assessed at days 4, 8, 11, and 14. Spleen volume (C) was assessed by means of Vevo2100 ultra sound system at day 12 (n = 4–5/group) while spleen index (D) was calculated at sacrifice (day 15) (n = 6–7/group). Histograms represent mean values while bars indicate the standard deviation. Comparisons were performed by means of one-way ANOVA. *: P ≤ 0.05; **: P ≤ 0.01 ***: P ≤ 0.001; ****: P ≤ 0.0001 vs Untreated. Abbreviations: s.c. sub-cutaneous; qw once weekly; o.s. oral gavage; b.i.d. twice daily; PLT platelets; Rom Romiplostim; Ulix ulixertinib.
Fig. 4
Fig. 4. ERK1/2 inhibition reduces OPN plasma concentration and reverses BM fibrosis induced by Romiplostim.
A OPN plasma concentration was evaluated by means of ELISA (enzyme-linked immunosorbent assay) in control mice (Untreated) and Romiplostim-treated animals receiving vehicle (Rom + Vehicle, in blue) or Ulixertinib (Rom + Ulix, in green). ELISA was performed 11 days after the first Romiplostim administration (n = 6–9/group). Histograms represent mean values while bars indicate the standard deviation. Comparisons were performed by means of one-way ANOVA. B Blinded fibrosis grade quantification was performed by a specialized pathologist. Histograms represent median values while bars indicate the interquartile range (n = 4-5/group). Comparisons were performed by means of Kruskal-Wallis’ test. C Representative images of Gordon and Sweet’s reticulin staining of bone marrow (BM) sections from Untreated, Rom + Vehicle and Rom + Ulix mice. Magnification 200×. D Spleen fibrosis as shown by Gordon and Sweet’s reticulin staining. Magnification 200×. *: P ≤ 0.05; **: P ≤ 0.01; ***: P ≤ 0.001; ****: P ≤ 0.0001 Abbreviations: OPN osteopontin; Rom romiplostim; Ulix Ulixertinib; BM bone marrow.
Fig. 5
Fig. 5. Combined ERK1/2 and JAK1/2 inhibition does not affect thrombocytosis but improves splenomegaly induced by Romiplostim.
A Schematic outline of the experimental design. Myelofibrosis was induced by sub-cutaneous injection of Romiplostim (1 mg/kg, once weekly). Mice were given vehicle (10% DMSO in 20% SBE-β-CD in saline) (Rom + Vehicle, in blue), Ulixertinib 100 mg/kg (Rom + Ulix, in green), Ruxolitinib 60 mg/kg (Rom + Ruxo, in red) or a combination of Ulixertinib 75 mg/kg and Ruxolitinib 30 mg/kg (Rom + Ruxo + Ulix, in purple) through oral gavage twice daily starting 3 days before the first Romiplostim injection. Mice were sacrificed after 15 days of Romiplostim treatment. B Platelet count was assessed at days 4, 8, 11, and 14 (n = 4–10/group). Spleen volume (C) was assessed by means of Vevo2100 ultra sound system at day 12 (n = 3-7/group) while spleen index (D) was calculated at sacrifice (day 15) (n = 4–10/group). In Panels B and C histograms represent mean values while bars indicate the standard deviation. Comparisons were performed by means of one-way ANOVA. Histograms in panel D represent median values while bars indicate the interquartile range. Comparisons were performed by means of Kruskal-Wallis’ test. *: P ≤ 0.05; **: P ≤ 0.01. Abbreviations: s.c. sub-cutaneous; qw once weekly; o.s. oral gavage; b.i.d. twice daily; PLT platelets; Rom Romiplostim; Ulix ulixertinib, Ruxo Ruxolitinib.
Fig. 6
Fig. 6. Combined ERK1/2 and JAK1/2 inhibition reduces plasma OPN and reverses BM fibrosis induced by Romiplostim.
A OPN plasma concentration was evaluated by means of ELISA (enzyme-linked immunosorbent assay) in control mice (Untreated) and Romiplostim-treated animals receiving vehicle (Rom + Vehicle, in blue), Ulixertinib (Rom + Ulix, in green), Ruxolitinib (Rom + Ruxo, in red) or a combination of Ulixertinib and Ruxolitinib (Rom + Ruxo + Ulix, in purple). ELISA was performed 11 days after the first Romiplostim administration (n = 7–9/group). Histograms represent mean values while bars indicate the standard deviation. Comparisons were performed by means of one-way ANOVA. B Blinded fibrosis grade quantification was performed by a specialized pathologist (n = 4–8/group) Histograms represent median values while bars indicate the interquartile range. Comparisons were performed by means of Kruskal-Wallis’ test. C Representative images of Gordon and Sweet’s reticulin staining of BM sections from mice belonging to each experimental group. Magnification 200×. D Spleen fibrosis as shown by Gordon and Sweet’s reticulin staining. Magnification 200X. *: P ≤ 0.05; **: P ≤ 0.01; ***: P ≤ 0.001; ****: P ≤ 0.0001 Abbreviations: OPN osteopontin; Rom romiplostim; Ulix Ulixertinib; Ruxo Ruxolitinib; BM bone marrow.
Fig. 7
Fig. 7. Treatment with anti-OPN neutralizing antibody recapitulates the antifibrotic effect of Ulixertinib.
A Schematic outline of the experimental design. Myelofibrosis was induced by sub-cutaneous injection of Romiplostim (1 mg/kg, once weekly). Mice were given anti-OPN antibody 15 mg/kg (Rom + anti-OPN, in orange) or an isotype control 15 mg/kg (Rom + IgG2c, in brown) through intraperitoneal injection once every 3 days starting 3 days before the first Romiplostim injection. Mice were sacrificed after 15 days of Rom treatment for the evaluation of spleen index and bone marrow and spleen fibrosis. B Platelet count was assessed at days 4, 8, 11, and 14 (n = 4–10/group). C Spleen index was calculated at sacrifice (day 15) (n = 4–10/group). D Spleen fibrosis as shown by Gordon and Sweet’s reticulin staining in Untreated and treated mice. Magnification 200×. E Representative images of Gordon and Sweet’s reticulin staining of bone marrow (BM) sections from mice belonging to Untreated, Rom + IgG2c and Rom + anti-OPN groups. Magnification 200×. F Blinded fibrosis grade quantification (n = 4–10/group) was performed by a specialized pathologist. G Comparison of BM fibrosis grade reduction after ERK1/2 inhibition through Ulixertinib and anti-OPN treatment, a comprehensive analysis of data from Fig. 6B and Fig. 7F was performed (n = 8–15/group). In B and C histograms represent mean values while bars indicate the standard deviation; comparisons were performed by means of one-way ANOVA. In F and G histograms represent median values while bars indicate the interquartile range; comparisons were performed by means of Kruskal-Wallis’ test. *: P ≤ 0.05; **: P ≤ 0.01; ***: P ≤ 0.001; ****: P ≤ 0.0001 Abbreviations: n number of samples; s.c. sub-cutaneous; qw once weekly; i.p. intraperitoneal; OPN osteopontin; Rom romiplostim; PLT platelets; Ulix Ulixertinib; BM bone marrow.

References

    1. Arber DA, Orazi A, Hasserjian R, Thiele J, Borowitz MJ, Le Beau MM, et al. The 2016 revision to the World Health Organization classification of myeloid neoplasms and acute leukemia. Blood. 2016;127:2391–405. doi: 10.1182/blood-2016-03-643544. - DOI - PubMed
    1. Bianchi E, Norfo R, Pennucci V, Zini R, Manfredini R. Genomic landscape of megakaryopoiesis and platelet function defects. Blood. 2016;127:1249–59. doi: 10.1182/blood-2015-07-607952. - DOI - PMC - PubMed
    1. Ortmann CA, Kent DG, Nangalia J, Silber Y, Wedge DC, Grinfeld J, et al. Effect of mutation order on myeloproliferative neoplasms. N Engl J Med. 2015;372:601–12. doi: 10.1056/NEJMoa1412098. - DOI - PMC - PubMed
    1. Lundberg P, Karow A, Nienhold R, Looser R, Hao-Shen H, Nissen I, et al. Clonal evolution and clinical correlates of somatic mutations in myeloproliferative neoplasms. Blood. 2014;123:2220–8. doi: 10.1182/blood-2013-11-537167. - DOI - PubMed
    1. Tenedini E, Bernardis I, Artusi V, Artuso L, Roncaglia E, Guglielmelli P, et al. Targeted cancer exome sequencing reveals recurrent mutations in myeloproliferative neoplasms. Leukemia. 2014;28:1052–9. doi: 10.1038/leu.2013.302. - DOI - PMC - PubMed

Publication types