. 2023 Apr;8(4):727-744.
doi: 10.1038/s41564-022-01319-1. Epub 2023 Mar 16.

Hyperactive nanobacteria with host-dependent traits pervade Omnitrophota

Affiliations

Hyperactive nanobacteria with host-dependent traits pervade Omnitrophota

Cale O Seymour et al. Nat Microbiol. 2023 Apr.

Abstract

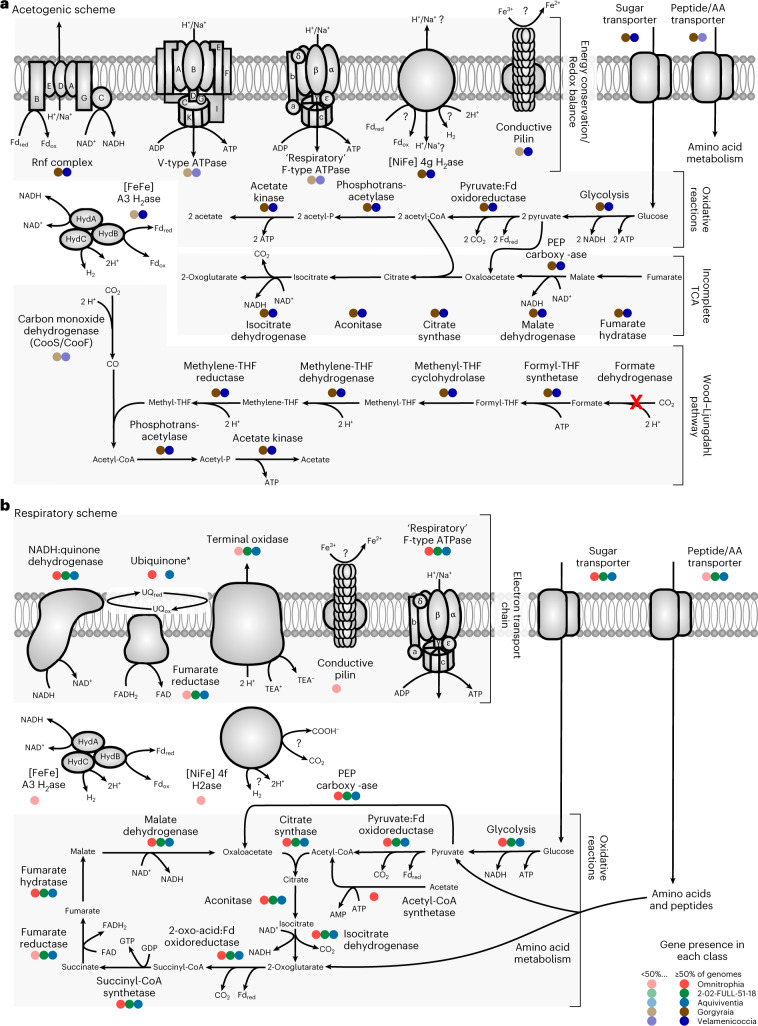
Candidate bacterial phylum Omnitrophota has not been isolated and is poorly understood. We analysed 72 newly sequenced and 349 existing Omnitrophota genomes representing 6 classes and 276 species, along with Earth Microbiome Project data to evaluate habitat, metabolic traits and lifestyles. We applied fluorescence-activated cell sorting and differential size filtration, and showed that most Omnitrophota are ultra-small (~0.2 μm) cells that are found in water, sediments and soils. Omnitrophota genomes in 6 classes are reduced, but maintain major biosynthetic and energy conservation pathways, including acetogenesis (with or without the Wood-Ljungdahl pathway) and diverse respirations. At least 64% of Omnitrophota genomes encode gene clusters typical of bacterial symbionts, suggesting host-associated lifestyles. We repurposed quantitative stable-isotope probing data from soils dominated by andesite, basalt or granite weathering and identified 3 families with high isotope uptake consistent with obligate bacterial predators. We propose that most Omnitrophota inhabit various ecosystems as predators or parasites.


Conflict of interest statement

The authors declare no competing interests.

Figures

Fig. 1
Fig. 1. Omnitrophota genomes and taxonomy.
a, Genome size estimates for ≥90% complete Omnitrophota genomes. b, Genome completeness and 16S rRNA gene detection statistics of all Omnitrophota genomes included in this analysis. Colours represent classes. In a and b, boxplots represent interquartile ranges, horizontal/vertical bars are means and vertical/horizontal bars are 95% confidence intervals. c, Maximum-likelihood phylogeny constructed from the concatenated Bac120 marker set of 204 Omnitrophota species representatives. The number within parentheses at the end of each tip corresponds to the genome ID in Supplementary Table 1. Dotted nodes indicate SH-aLRT support ≥80% and UFboot support ≥95%. Source data
Fig. 2
Fig. 2. Omnitrophota cell size.
a, Genomes associated with microscopically observed organisms are indicated with red circles. SAGs with associated particle size estimates are indicated as blue dots. Cell size estimates associated with MAGs from Rifle, Colorado, and Crystal Geyser, Utah are based on serial-filtered samples. Filters are shown as black or white circles: filters represented by filled circles retained the organism; unfilled circles did not have Omnitrophota MAGs. Lines connecting dots represent the estimated cell size ranges given the observed data. b, Relative abundance of 16S rRNA genes in filtrates from Cave Spring (CS), Kiup Spring (KS) and Grapevine Spring (GVS). Red lines indicate an increase in relative abundance from the 0.45 μm filter to the 0.2 μm filter. c, The same calculation performed at the family level. Source data
Fig. 3
Fig. 3. Predicted physiology and environmental data.
Predicted physiology and environmental data for the highest-quality genome for each species group that has a near-complete (≥90%) genome. Bars to the right of taxon names and in background reflect classes (Fig. 1). Numbers in parentheses next to taxon names are unique genome identifiers as discussed in text. ‘Genome size’ indicates the observed size of each genome. ‘Cell size’ indicates evidence that the genome was sequenced from small cells (<0.5 μm, filled small circle) or large cells (>0.5 μm, filled large circle). ‘Acetogen/WLP’, Wood-Ljungdahl pathway and acetogenesis; ‘acs2’, acetyl-CoA synthetase; ‘acsABCDE’, CO dehydrogenase/acetyl-CoA synthase; ‘Respiration’, ‘e- acceptors’ and ‘H2ase’ (hydrogenase) indicate genes predicted to encode proteins involved in energy metabolism. ‘Lo-O2’, cytochrome c oxidase complex; ‘Hi-O2’, cytochrome bd ubiquinol; ‘M+’, metal-reducing cytochromes; ‘e- Pilin’, conductive pili. Symbiosis-related genes include ‘T4aP’ (type-4a pilus), ‘Tad’ (tight-adherence pilus), ‘sF-ATP (‘symbiotic’ type 2/3 FoF1 ATPase α-subunit), ‘Translocase’ (ATP/ADP translocase) and ‘big ORF’ (indicating the presence of a large ORF). ‘Temp’, ‘O2’ and ‘pH’ indicate the observed temperature, oxygen concentration (mM) and pH of the sample from which each genome was sequenced. Data for additional Omnitrophota genomes are summarized in Supplementary Fig. 10. Source data
Fig. 4
Fig. 4. Conserved energy metabolism in major lineages of Omnitrophota.
a, Predicted metabolism of putative acetogens or syntrophs in Velamenicoccia and Gorgyraia. b, Predicted metabolism of putatively respiratory lineages Omnitrophia, Aquiviventia and 2-02-FULL-51-18. Reactions are represented by arrows. Enzymes or complexes that are present are represented by coloured circles. Colours correspond to each class. Shapes are opaque if gene or gene set catalysing a given reaction is present in the representative genomes of ≥50% of species, transparent if >1% and <50% of species, or deleted if present in only one or no species. See Supplementary Tables 5 and 6 for details of these features for ANI cluster representatives. Red X indicates enzyme/complex is absent in Omnitrophota. * indicates canonical ubiquinone pathway is not complete. Source data
Fig. 5
Fig. 5. Summary of genomic evidence for parasitism and predation.
a, Systems related to symbiosis in Omnitrophota genomes. Circles correspond to occurrence in each class, with lighter-shaded circles indicating <50% of species in the class encoding the system. b, Phylogeny of homologues of ‘tight-adherence’ apparatus intermembrane platform protein TadC. The highlighted clade indicates a cluster of homologues from Omnitrophota genomes. The characterized TadC from Halobacteriovorax marinus is indicated with a red point. c, Phylogeny of F-type ATP synthase subunit α. Highlighted clades indicate Omnitrophota proteins putatively involved in chemiosmotic ATP synthesis (‘Respiratory’ or ‘Symbiotic’). Putative ‘symbiotic’ ATPase gene clusters in Omnitrophota genomes are typically co-located with type-4a pilus gene clusters as in Mycoplasma genomes. Tips corresponding to the biochemically characterized respiratory homologue from Waddlia chondrophila and the pathogenesis-related homologue from Mycoplasma mobile are represented with blue and red points, respectively. d, Phylogeny of ATP/ADP translocase homologues. The light-blue highlighted clade represents homologues Omnitrophota. The red clade represents homologues from Flavobacteriaceae, including Croceibacter atlanticus. The red point represents a homologue from W. chondrophila, blue from ‘Ca. Babela massiliensis’ and brown from the Omnitrophota species P. frigidipaludosa. e, Illustration of the largest ORF from the class Omnitrophia, which encodes domains possibly involved in adhesion. Source data
Fig. 6
Fig. 6. Family-level qSIP in diverse soils.
Y axis shows the percent difference between AFE ratios for a given taxon (P) compared to all non-predatory (NP) taxa from the same sample. Boxes display the median and inner quartiles, while whiskers extend to the 95% confidence interval of the distribution of AFE ratios for a given taxon within each experimental group. N = 114 qSIP experiments. Source data
Extended Data Fig. 1
Extended Data Fig. 1. General bacterial marker set analysis.
CheckM General bacterial marker set analysis. (a) Barplot showing the percent of Omnitrophota genomes with a given marker gene. The red line indicates the mean (uncorrected) contamination of all Omnitrophota genomes. The black line indicates the mean (uncorrected) completeness estimate of all Omnitrophota genomes. The number at the top of the bar indicates the number of genomes that encode a given marker. (b) Histogram showing the distribution of marker genes, according to how many of the Omnitrophota genomes encoded them. (c) Dotplot showing the percent of Omnitrophota genomes with a given marker compared to the mean contamination of all Omnitrophota genomes encoding that marker. (d) Dotplot comparing the percent of genomes that encode a given marker and the mean distance on the GTDB tree between those genomes. Source data
Extended Data Fig. 2
Extended Data Fig. 2. Concatenated protein phylogenies with class-level annotations.
Phylogenetic trees constructed from the Bac120, UBCG, BcgTree and Uni156 marker sets, painted with Class-level taxonomy. Tips reflect genome identifiers used in the study along with proposed taxonomic names in bold, corresponding to Supplementary Table 1. Supported nodes (SH-aLRT ≥ 80% and UFboot ≥ 95%) are indicated with a black dot.
Extended Data Fig. 3
Extended Data Fig. 3. Global distribution of Omnitrophota.
(a) Maps showing the coordinates of Earth Microbiome Project (EMP) samples in which Omnitrophota sequence variants were observed in (from top to bottom) EMP environmental ontology (EMPO) level-2 categories: Non-saline, Saline, Plant-associated, and Animal-associated. Bubbles depict relative abundance of the phylum and are colored to indicate EMPO level 3. (b) Log10-scale distribution of percent relative abundances of each class of Omnitrophota within each EMPO-3 category. (c) Multi-pie chart displaying the percent of EMP samples containing Omnitrophota sequences in each EMPO-3 category (x-axis). ‘Aero’ refers to aerosol samples, ‘Sedi’ sediment, ‘Surf’ surface, ‘H2O’ water, ‘Sal’ hypersaline, ‘Corp’ corpus, ‘Rhiz’ rhizosphere, ‘Pgut’ proximal gut, ‘Dgut’ distal gut, ‘Secr’ secretion. Source data
Extended Data Fig. 4
Extended Data Fig. 4. Genome sizes of Omnitrophota and other phyla.
Only ≥50% complete, ≤10% contaminated genomes were used. Genome size was estimated from observed assembly size, completeness, and contamination. The centermost divider of each boxplot represents the median. Upper and lower bounds of each box represent Q3 and Q2 respectively. Whiskers extend beyond Q3 and Q2 by ±1.5 IQR. ‘*‘ indicates a significant (p < 0.05; one-way ANOVA with Tukey’s Post-Hoc test) difference in genome size between Omnitrophota and each outgroup phylum. N = 3309 (191 Omnitrophota and 3118 outgroup phyla). Source data
Extended Data Fig. 5
Extended Data Fig. 5. Examples of the acetogenic or syntrophic metabolism scheme in Omnitrophota genomes.
Predicted energy and carbon metabolism of putatively acetogenic or syntrophic species (a) Makaraimicrobium thalassicum, (b) Velamenicoccus archaeovorus, and (c) Fontincolimonas calida. Lines represent genes or modules as appropriate. Reactions are represented by arrows. A red ‘X’ indicates that a complex or gene is missing or incomplete.
Extended Data Fig. 6
Extended Data Fig. 6. Examples of the respiratory metabolism scheme in Omnitrophota genomes.
Predicted energy and carbon metabolism of putatively respiratory species (a) Aquivivens invisus and (b) Aquincolibacterium aerophilum. Lines represent genes or modules as appropriate. Reactions are represented by arrows. A red ‘X’ indicates that a complex or gene is missing or incomplete.
Extended Data Fig. 7
Extended Data Fig. 7. Taxonomic classification of Omnitrophota ORFs.
Taxonomic affiliation of Omnitrophota ORFs according to classification using Kraken RefSeq (a) and MaxiKraken (b) databases. Velamenicoccus archaeovorus is represented in RefSeq, and as a consequence, closely related ORFs from Velamenicoccia genomes classify as ‘Omnitrophica’. (c) Family-level affiliation of ORFs from Aquiviventia genomes. Source data

References

    1. Pruesse E, et al. SILVA: a comprehensive online resource for quality checked and aligned ribosomal RNA sequence data compatible with ARB. Nucleic Acids Res. 2007;35:7188–7196. doi: 10.1093/nar/gkm864. - DOI - PMC - PubMed
    1. Glöckner J, et al. Phylogenetic diversity and metagenomics of candidate division OP3. Environ. Microbiol. 2010;12:1218–1229. doi: 10.1111/j.1462-2920.2010.02164.x. - DOI - PubMed
    1. Hugenholtz P, Pitulle C, Hershberger KL, Pace NR. Novel division level bacterial diversity in a Yellowstone hot spring. J. Bacteriol. 1998;180:366–376. doi: 10.1128/JB.180.2.366-376.1998. - DOI - PMC - PubMed
    1. Rinke C, et al. Insights into the phylogeny and coding potential of microbial dark matter. Nature. 2013;499:431–437. doi: 10.1038/nature12352. - DOI - PubMed
    1. Kolinko S, Richter M, Glöckner F-O, Brachmann A, Schüler D. Single-cell genomics of uncultivated deep-branching magnetotactic bacteria reveals a conserved set of magnetosome genes. Environ. Microbiol. 2016;18:21–37. doi: 10.1111/1462-2920.12907. - DOI - PubMed

Publication types

Substances