. 2023 Apr 3;133(7):e164413.
doi: 10.1172/JCI164413.

Kras oncogene ablation prevents resistance in advanced lung adenocarcinomas

Affiliations

Kras oncogene ablation prevents resistance in advanced lung adenocarcinomas

Marina Salmón et al. J Clin Invest. .

Abstract

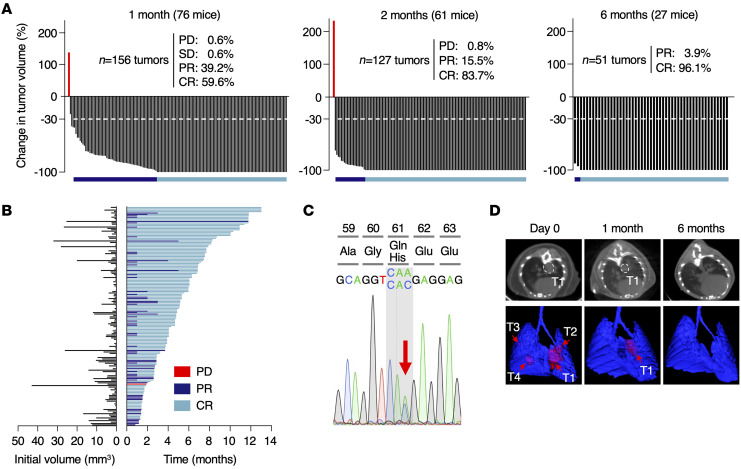
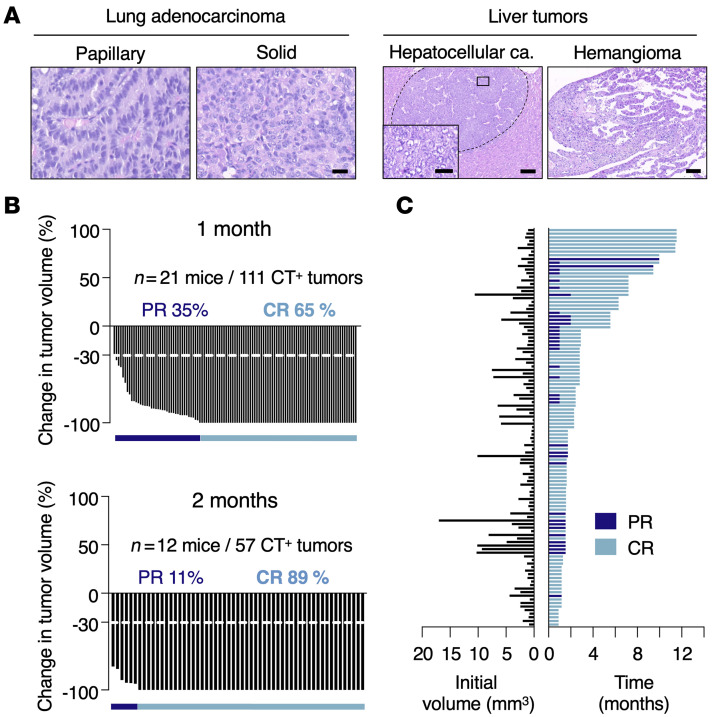
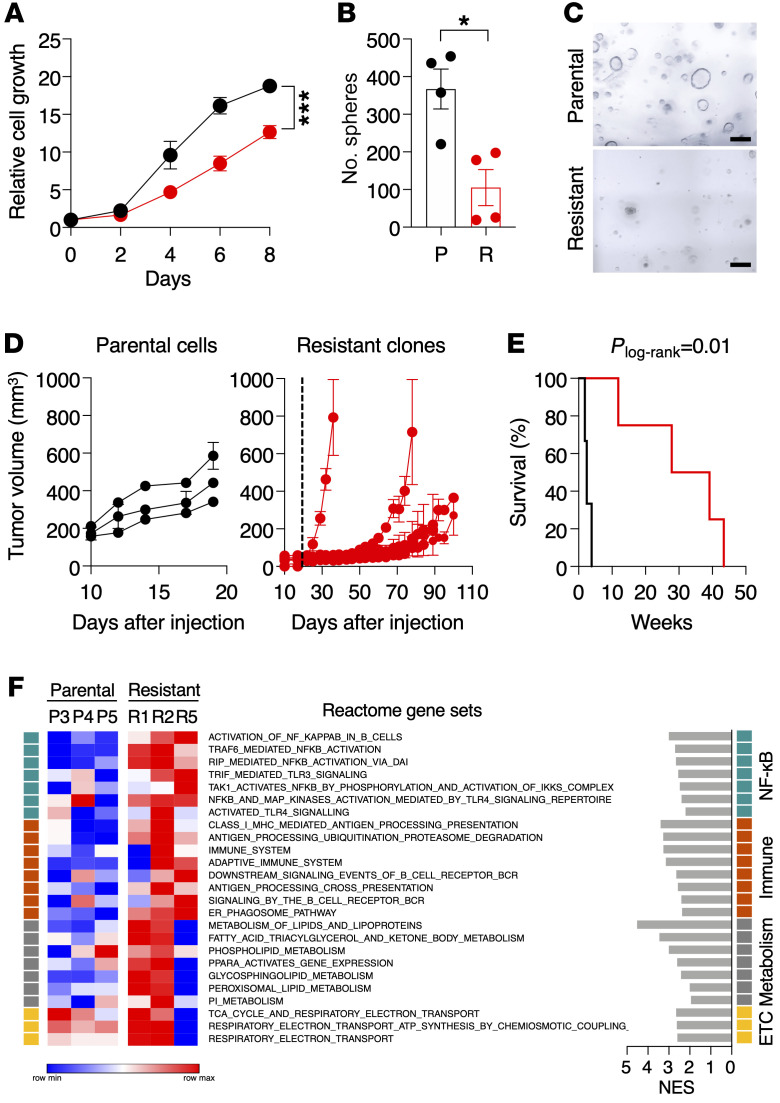
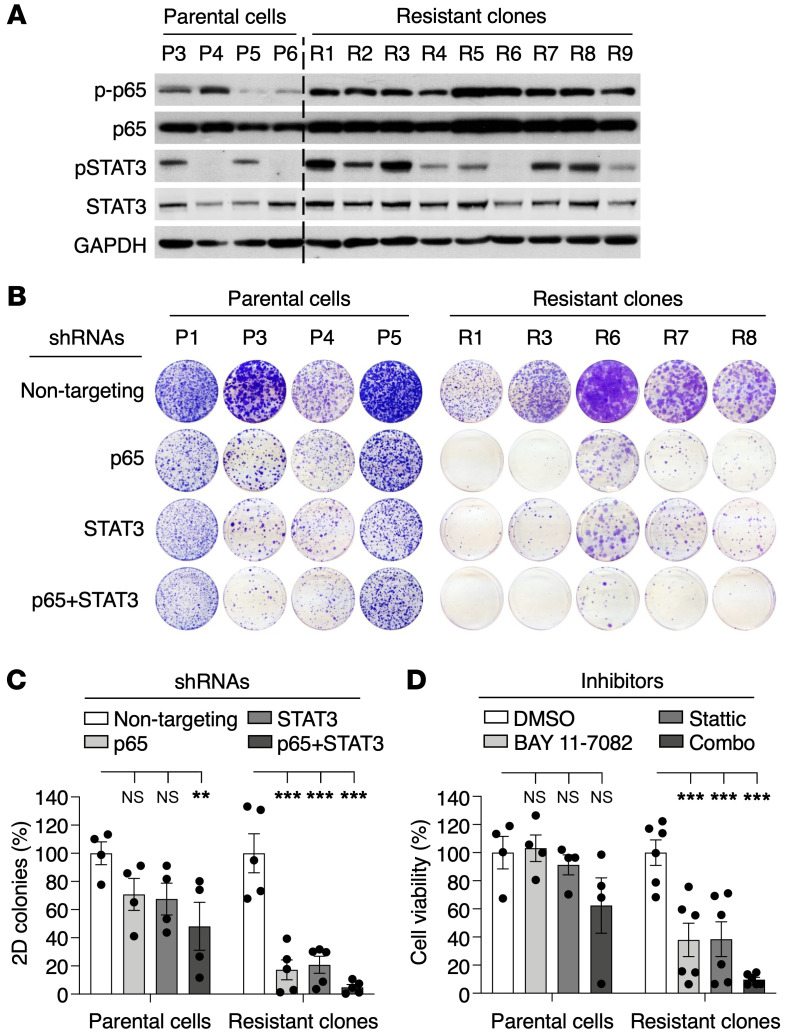
KRASG12C inhibitors have revolutionized the clinical management of patients with KRASG12C-mutant lung adenocarcinoma. However, patient exposure to these inhibitors leads to the rapid onset of resistance. In this study, we have used genetically engineered mice to compare the therapeutic efficacy and the emergence of tumor resistance between genetic ablation of mutant Kras expression and pharmacological inhibition of oncogenic KRAS activity. Whereas Kras ablation induces massive tumor regression and prevents the appearance of resistant cells in vivo, treatment of KrasG12C/Trp53-driven lung adenocarcinomas with sotorasib, a selective KRASG12C inhibitor, caused a limited antitumor response similar to that observed in the clinic, including the rapid onset of resistance. Unlike in human tumors, we did not observe mutations in components of the RAS-signaling pathways. Instead, sotorasib-resistant tumors displayed amplification of the mutant Kras allele and activation of xenobiotic metabolism pathways, suggesting that reduction of the on-target activity of KRASG12C inhibitors is the main mechanism responsible for the onset of resistance. In sum, our results suggest that resistance to KRAS inhibitors could be prevented by achieving a more robust inhibition of KRAS signaling mimicking the results obtained upon Kras ablation.

Keywords: Drug therapy; Lung cancer; Oncogenes; Oncology.


Figures

Figure 1
Figure 1. Genetic ablation of KrasG12V in KG12VloxPC2 lung tumors induces massive tumor regression.
(A) Waterfall plots representing the changes in tumor volume of tumors present in KG12VloxPC2 mice exposed to a TMX diet for 1 (n = 76 mice/156 tumors), 2 (n = 61 mice/127 tumors), and 6 months (n = 27 mice/51 tumors), as determined by CT scans. Percentages of tumors showing progressive (PD) or stable disease (SD), PR, or CR are depicted in the figure. A growing tumor lacking the resident KrasG12V oncogene is depicted in red. The dotted lines mark 30% regression levels. Horizontal bars indicate tumors undergoing PR (dark blue) and CR (light blue). (B) Initial tumor size (left) and duration of response (right) from individual tumors represented in A until they reach a humane end point. Colors are those described in A. (C) Sequencing chromatogram depicting the Q61H mutation in the WT Kras allele present in the single tumor that displayed PD after KrasG12V ablation. The arrow indicates the WT (CAA) and mutated (CAC) codons. (D) Representative images illustrating CT scans (top) and 3D rendering (bottom) of lungs depicting tumor response after 1 and 6 months of TMX exposure. Tumors are outlined (top) or indicated by arrows (bottom). T1, tumor 1.
Figure 2
Figure 2. Effect of Kras ablation in urethane-induced lung tumors.
(A) Representative images of H&E-stained, paraffin-embedded sections of LUADs with papillary or solid structure (left) and of liver tumors including a hepatocellular carcinoma and a hemangioma (right) present in KloxPC2 mice exposed to urethane. Scale bars: 100 μm (low magnification); 20 μm (high magnification). (B) Waterfall plots representing changes in tumor volume in KloxPC2 mice exposed to a TMX diet for 1 month (n = 21 mice/111 tumors) (top) or 2 months (n = 12 mice/57 tumors) (bottom). Percentages of tumors undergoing PR (dark blue bar) or CR (light blue bar) are depicted in the figure. (C) Initial tumor size (left) and duration of response (right) from individual tumors represented in B. Colors indicate whether individual tumors underwent PR (dark blue) or CR (light blue) up to the time of the humane end point.
Figure 3
Figure 3. Characterization of tumor cells resistant to genetic KrasG12V ablation.
(A) Relative growth of Kras+/G12Vlox;Trp53–/– tumor cells (black circles, n = 5) derived from KG12VloxP mice and resistant Kras+/–;Trp53–/– clones, obtained upon ablation of the KrasG12V oncogene (red circles, n = 9) for the indicated times. Data are represented as mean ± SEM. P values were calculated using unpaired Student’s t test by comparing areas under the curve. ***P < 0.001. (B) Quantification of 3D spheres of parental Kras+/G12Vlox;Trp53–/– cells (P, black circles, n = 4) and resistant Kras+/–;Trp53–/– clones (R, red circles, n = 4) in Matrigel for 7 days. Data are represented as mean ± SEM. P values were calculated using unpaired Student’s t test. *P < 0.05. (C) Representative images of 3D spheres of parental Kras+/G12Vlox;Trp53–/– cells and resistant Kras+/–;Trp53–/–clones grown in Matrigel for 7 days. Scale bars: 200 μm. (D) Tumor growth of parental cell lines and resistant clones after subcutaneous implantation in immunodeficient mice. Each lane represents an independent Kras+/G12Vlox;Trp53–/– cell line (black circles, n = 3) (left) or resistant Kras+/–;Trp53–/– clone (red circles, n = 6) (right). Dotted line marks the maximum time we allowed parental cells to grow (20 days) for comparison purposes. Data are represented as mean ± SEM. (E) Survival of immunodeficient mice after transpleural orthotopic injection of parental Kras+/G12Vlox;Trp53–/– cell lines (black, n = 3) and resistant Kras+/–;Trp53–/– clones (red, n = 4). Plog-rank = 0.01. (F) Heatmap representing color-coded enrichment scores from single-sample GSEA analysis of RNA-Seq data using Reactome gene sets comparing 3 parental Kras+/G12Vlox;Trp53–/– cell lines and 3 resistant Kras+/–;Trp53–/– clones. Gene sets were ranked based on related functions indicated on the right. The normalized enrichment score (NES) is also shown. Only gene sets significantly enriched at FDR q values < 0.25 were considered.
Figure 4
Figure 4. NF-κB and STAT3 signaling mediate survival of resistant Kras+/–;Trp53–/– clones.
(A) Western blot analysis of phospho-p65 (p-p65), p65, p-STAT3, and STAT3 expression in parental Kras+/G12Vlox;Trp53–/– cell lines (P3 to P6) and resistant Kras+/–;Trp53–/– clones (R1 to R9). GAPDH served as loading control. (B) Colony formation assays on 10 cm cell culture dishes of parental Kras+/G12Vlox;Trp53–/– cell lines and resistant Kras+/–;Trp53–/– clones expressing either nontargeting shRNA or shRNAs against p65 and/or STAT3. (C) Quantification of the number of colonies present in the experiment described in B. Data are represented as mean ± SEM. P values were calculated using 2-way ANOVA. **P < 0.01; ***P < 0.001. (D) Viability of parental Kras+/G12Vlox;Trp53–/– cell lines (n = 4) and resistant Kras+/–;Trp53–/– clones (n = 6) treated with BAY 11-7082 (10 μM) and Stattic (5 μM) either individually or in combination (Combo). Data are represented as mean ± SEM. P values were calculated using 2-way ANOVA. ***P < 0.001.
Figure 5
Figure 5. BIRC5 is required for survival of resistant Kras+/–;Trp53–/– clones.
(A) Shown are log2 fold change (FC) values determined by quantitative reverse-transcriptase PCR (qRT-PCR) for NF-κB target genes in parental Kras+/G12Vlox;Trp53–/– cells (P, black, n = 6) and resistant Kras+/–;Trp53–/– clones (R, red, n = 6). β-Actin was used for normalization. P values were calculated using unpaired Student’s t test. *P < 0.05; **P < 0.01. (B) Western blot analysis of BIRC5 expression in lysates from parental Kras+/G12Vlox;Trp53–/– cell lines (P3 to P6) and resistant Kras+/–;Trp53–/– clones (R3 to R8) after expression of 2 independent shRNAs. GAPDH served as loading control. (C) Colony-formation assays on 10 cm cell culture dishes of parental Kras+/G12Vlox;Trp53–/– cell lines and resistant Kras+/–;Trp53–/– clones expressing either nontargeting shRNA or 2 independent shRNAs against BIRC5. (D) Quantification of the number of colonies present in the experiment described in C. Data are represented as mean ± SEM. P values were calculated using 2-way ANOVA. **P < 0.01; ***P < 0.001. (E) Western blot analysis of p-p65, p65, and BIRC5 expression in lysates from a parental Kras+/G12Vlox;Trp53–/– cell line treated with TNF-α (20 ng/ml) for the indicated time points. GAPDH served as loading control.
Figure 6
Figure 6. Tumor response to sotorasib treatment in KG12CP mice.
(A) Waterfall plot representing the changes in tumor volumes of individual lung tumors present in Kras+/FSFG12C;Trp53F/F (KG12CP) mice treated with sotorasib for 1 month (n = 15 mice/52 tumors). Tumors whose volume at the time of the first CT were smaller (orange) or larger (black bars) than 2 mm3 are indicated. (B) Tumor volumes determined by CT scans of representative tumors in KG12CP mice treated with sotorasib for the indicated times. (C) CT scans (top) and 3D rendering (bottom) of lungs of KG12CP mice at the beginning (day 0) and after sotorasib treatment for 4 and 20 weeks (w). Visible lesions are outlined by dotted lines (above) and in red (bottom). (D) Representative images of H&E, Ki67, pERK, cleaved caspase-3 (CC3), and CD8 staining in paraffin-embedded sections of tumors from KG12CP mice either untreated (Control), treated with sotorasib for 1 or 2 weeks, and after they became resistant to sotorasib (Resistant). Scale bars: 20 μm. (E) Quantification of the percentages of Ki67+, CC3+, and CD8+ cells and pERK+ areas in sections of tumors from KG12CP mice either untreated (C) or treated with sotorasib for 1 or 2 weeks, and after they became resistant to sotorasib (R). Data are represented as mean ± SEM. P values were calculated using 1-way ANOVA. *P < 0.05; **P < 0.01; ***P < 0.001. (F) Percentages of the different histological grades (II to V) displayed by lung tumors in KG12CP mice. Different shades of gray indicate increasing grades. Tumors present in KG12CP mice untreated, treated with sotorasib for 1 or 2 weeks, and after they became resistant to sotorasib are indicated.
Figure 7
Figure 7. Genomic and transcriptomic analysis of sotorasib-resistant tumors.
(A) Heatmaps representing log2 ratio copy number variations (CNVs) from WES data of control and sotorasib-resistant tumors in all chromosomes (top) and in chromosome 6 (bottom). Each row represents an individual sample. Copy number gains are represented in shades of red, while copy number losses are depicted in shades of blue. The position of Kras on chromosome 6 is indicated. (B) Absolute copy numbers of WT Kras (white bars) as well as KrasG12C alleles (black bars) from control and sotorasib-resistant tumors. Data were obtained from WES analyses. (C) Principal component analysis (PCA) displaying the distribution of control tumors (blue) and sotorasib-resistant tumors (red). (D) Normalized enrichment scores of biological pathways significantly enriched in sotorasib-resistant tumors obtained from GSEA of KEGG gene sets. Proliferation-related pathways are represented in green and drug metabolism-related pathways in red. Only gene sets significantly enriched at FDR q values < 0.25 were considered. (E) Relative viability of PDX-dc1 and MIA PaCa-2 cells infected with empty lentiviral vectors or lentiviral vectors (white circles, n = 3 for MIA PaCa-2 cells, n = 2 for PDX-dc-1 cells)expressing GSTM1, GSTM3, and GSTM5 proteins (black circles, n = 3 for MIA PaCa-2 cells, n = 2 for PDX-dc-1 cells) after treatment with the indicated doses of sotorasib for 72 hours. P values were calculated using unpaired Student’s t test. *P < 0.05. (F) Western blot analysis of PDX-dc1 and MIA PaCa-2 cells infected with empty lentiviral vectors or lentiviral vectors expressing HA-GSTM1, HA-GSTM3, and/or HA-GSTM5 proteins using anti-HA antibodies. Vinculin expression served as a loading control.
Figure 8
Figure 8. Resistance to sotorasib is reversible.
(A) (Left) Growth of sotorasib-resistant tumors after subcutaneous implantation in immunodeficient mice treated either with vehicle (black circles) or 100 mg/kg sotorasib following a discontinuous treatment (blue circles) in which they were preexpanded in untreated immunodeficient mice. (Right) Growth of sotorasib-resistant tumors after subcutaneous implantation in immunodeficient mice treated either with vehicle (black circles) or with 100 mg/kg sotorasib following a continuous treatment (red circles) in which they were preexpanded in immunodeficient mice continuously treated with 100 mg/kg of sotorasib. Dotted lines indicate the differential time scale for tumors to become sotorasib resistant following discontinuous versus continuous exposure to sotorasib. (B) Viability of lung tumor cells treated with the indicated concentrations of sotorasib for 72 hours in 2D (left) and 3D (right) cultures. Tumor cells derived from untreated tumors expressing KrasG12V (white circles, n = 3) or KrasG12C (black circles, n = 3) as well as tumor cells obtained from sotorasib-resistant tumors either left untreated in culture (blue circles, n = 4) or cultured in the presence of 10 μM sotorasib (red circles, n = 2). Data are represented as mean ± SEM. (C) Specific GST activity (U/mg) of untreated control KrasG12C tumor cells, tumor cells obtained from sotorasib-resistant tumors untreated in vitro (R/U), and tumor cells obtained from sotorasib-resistant tumors cultured in the presence of 10 μM of sotorasib (R/T). Colors are those described in B. Data are represented as mean ± SEM. P values were calculated using an ANOVA test. **P < 0.01. (D) Representative images of interphase and metaphase FISH analyses of 2 cell lines (1 and 2) obtained from sotorasib-resistant tumors, cultured in the absence of sotorasib (sotorasib withdrawal) or in the presence of 10 μM of sotorasib (+ sotorasib). Scale bars: 5 μm. (E) Absence (white bars) or presence of Kras (black bars) amplification in cell lines 1 and 2 grown in the absence (–) or presence (+) of 10 μM of sotorasib.

References

    1. Hirsch FR, et al. Lung cancer: current therapies and new targeted treatments. Lancet. 2017;389(10066):299–311. doi: 10.1016/S0140-6736(16)30958-8. - DOI - PubMed
    1. Ostrem JM, et al. K-Ras(G12C) inhibitors allosterically control GTP affinity and effector interactions. Nature. 2013;503(7477):548–551. doi: 10.1038/nature12796. - DOI - PMC - PubMed
    1. Prior IA, et al. The frequency of ras mutations in cancer. Cancer Res. 2020;80(14):2969–2974. doi: 10.1158/0008-5472.CAN-19-3682. - DOI - PMC - PubMed
    1. Lito P, et al. Allele-specific inhibitors inactivate mutant KRAS G12C by a trapping mechanism. Science. 2016;351(6273):604–608. doi: 10.1126/science.aad6204. - DOI - PMC - PubMed
    1. Patricelli MP, et al. Selective inhibition of oncogenic KRAS output with small molecules targeting the inactive state. Cancer Discov. 2016;6(3):316–329. doi: 10.1158/2159-8290.CD-15-1105. - DOI - PubMed

Publication types

Substances