. 2023 Mar 16;13(1):4385.
doi: 10.1038/s41598-023-31274-8.

Ecological drivers of breeding periodicity in four forest neotropical eagles

Affiliations

Ecological drivers of breeding periodicity in four forest neotropical eagles

Marcel Henrique Blank et al. Sci Rep. .

Abstract

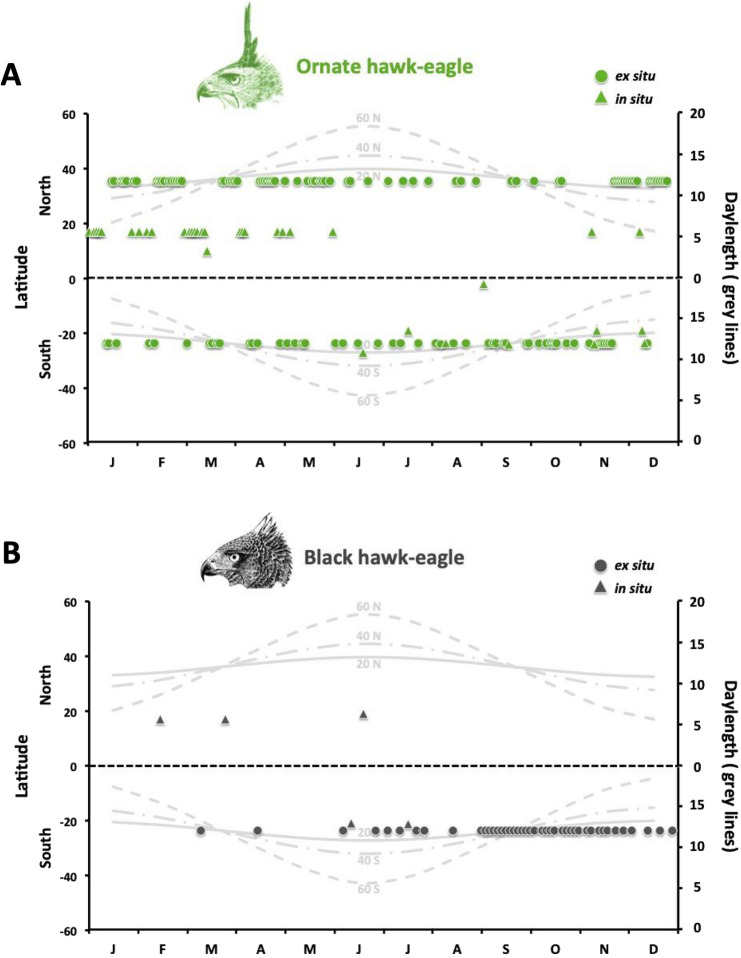
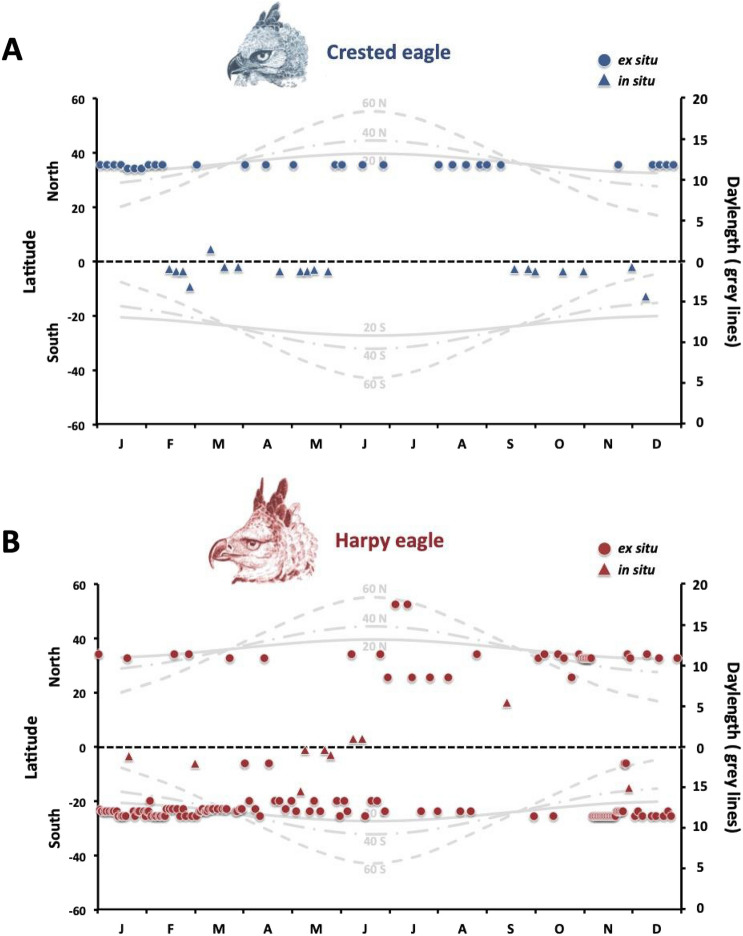
We explore the potential factors that affect clutch initiation in four Neotropical large raptors (Harpy eagle-HE, Crested eagle-CE, Ornate hawk-eagle-OHE, and Black hawk-eagle-BHE) by analyzing 414 clutch events mostly obtained from captive individuals. Differences in how clutch initiation is associated with changes in photoperiod were found between HE and both hawk-eagles, and between CE and BHE. Changes in temperature at the time of clutch initiation only differed between HE and OHE, whereas changes in precipitation varied between BHE and all other species. Principal Component Analysis of these environmental cues showed that ellipses in the dataset of each species overlap, but only ellipses from CE and OHE had the same variation trends. This means that although these species live under similar ecological conditions, they exhibit three different patterns of response to environmental cues. Apparently, these patterns are not associated with phylogenetic relatedness because species belonging to the same clade do not show the same response pattern. Diet diversity analysis revealed that HE has the least varied diet, and CE and OHE the most varied diet. The fact that species who fit the same reproductive timing response to environmental cues show similar diets leads us to hypothesize that breeding in these eagles was most likely shaped by food availability.


Conflict of interest statement

The authors declare no competing interests.

Figures

Figure 1
Figure 1
Annual distribution of clutches in (A) Ornate hawk-eagle (Spizaetus ornatus) and (B) Black hawk-eagle (Spizaetus tyrannus) females. Circles and triangles represent clutch events recorded in captivity and in the wild, respectively. Solid, dash-dotted and dashed gray lines depict annual variations in daylength at latitudes 20°, 40° and 60° of the northern and southern hemispheres.
Figure 2
Figure 2
Annual distribution of clutches in (A) Crested eagle (Morphnus guianensis) and (B) Harpy eagle (Harpia harpyja) females. Circles and triangles represent clutch events recorded in captivity and in the wild, respectively. Solid, dash-dotted and dashed gray lines depict annual variations in daylength at latitudes 20°, 40° and 60° of the northern and southern hemispheres.
Figure 3
Figure 3
Violin plots of the relative changes in (A) photoperiod, (B) temperature and (C) precipitation in which clutch initiation occurred in the four Neotropical species surveyed in this study. Red, blue, green and black violin plots represent values obtained from Harpy eagles, Crested eagles, Ornate hawk-eagles and Black hawk-eagles, respectively. Black horizontal lines indicate medians whereas red dots depict means. Boxes illustrate interquartile range and outliers 1.5 times the interquartile range from the box are shown as dots. Different letters indicate statistical differences between species within the same environmental factors (P < 0.05).
Figure 4
Figure 4
Principal Component Analysis (PCA) of the variables relative changes in photoperiod, temperature, and precipitation. The first principal component (x axes) explained 62.5% of the data variation and the second principal component explained 27% of the variation of the data variation. The ellipses define the region that contains 68% of the data for each eagle. The red arrows represent the loadings of each variable (relative photoperiod, relative temperature and relative precipitation). The values of the data in terms of the principal components were multiplied by -1 to facilitate the visualization.
Figure 5
Figure 5
Prey type and size of the Ornate hawk-eagle, Black hawk-eagle, Crested eagle and Harpy eagles. The pie charts illustrate the percentages of mammals, reptiles and birds consumed by each species and the silhouettes represent the orders of the animals they prey on. The bar charts show the percentages of prey by size category (Small—0–300 g; Medium—300–900 g; and Large—> 900 g). In the lower panel, the percentages next to animal silhouettes detail how much a particular order accounts for the total prey consumed by each raptor. S.o.—Ornate hawk-eagle (Spizaetus ornatus); S.t.—Black hawk-eagle (Spizaetus tyrannus); M.g.—Crested eagle (Morphnus guianensis); and H.h.—Harpy eagle (Harpia harpyja).

References

    1. Dawson A. Control of the annual cycle in birds: Endocrine constraints and plasticity in response to ecological variability. Philos. Trans. R. Soc. B Biol. Sci. 2008;363:1621–1633. doi: 10.1098/rstb.2007.0004. - DOI - PMC - PubMed
    1. Krause JS, Meddle SL, Wingfield JC. The effects of acute restraint stress on plasma levels of prolactin and corticosterone across life-history stages in a short-lived bird: Gambel’s white-crowned sparrow (Zonotrichia leucophrys gambelii) Physiol. Biochem. Zool. 2015;88:589–598. doi: 10.1086/683321. - DOI - PubMed
    1. Dawson A, Sharp PJ. Photorefractoriness in birds-photoperiodic and non-photoperiodic control. Gen. Comp. Endocrinol. 2007;153:378–384. doi: 10.1016/j.ygcen.2007.01.043. - DOI - PubMed
    1. Hau M. Timing of breeding in variable environments: Tropical birds as model systems. Horm. Behav. 2001;40:281–290. doi: 10.1006/hbeh.2001.1673. - DOI - PubMed
    1. Pereira RJG, Granzinolli MAM, Duarte JMB. Annual profile of fecal androgen and glucocorticoid levels in free-living male American kestrels from southern mid-latitude areas. Gen. Comp. Endocrinol. 2010;166:94–103. doi: 10.1016/j.ygcen.2009.12.012. - DOI - PubMed

Publication types