. 2023 Jun 29;141(26):3199-3214.
doi: 10.1182/blood.2022016779.

Iron homeostasis governs erythroid phenotype in polycythemia vera

Affiliations

Iron homeostasis governs erythroid phenotype in polycythemia vera

Cavan Bennett et al. Blood. .

Abstract

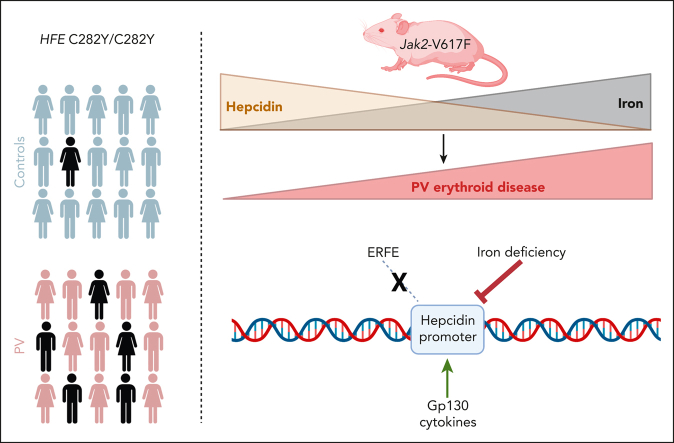
Polycythemia vera (PV) is a myeloproliferative neoplasm driven by activating mutations in JAK2 that result in unrestrained erythrocyte production, increasing patients' hematocrit and hemoglobin concentrations, placing them at risk of life-threatening thrombotic events. Our genome-wide association study of 440 PV cases and 403 351 controls using UK Biobank data showed that single nucleotide polymorphisms in HFE known to cause hemochromatosis are highly associated with PV diagnosis, linking iron regulation to PV. Analysis of the FinnGen dataset independently confirmed overrepresentation of homozygous HFE variants in patients with PV. HFE influences the expression of hepcidin, the master regulator of systemic iron homeostasis. Through genetic dissection of mouse models of PV, we show that the PV erythroid phenotype is directly linked to hepcidin expression: endogenous hepcidin upregulation alleviates erythroid disease whereas hepcidin ablation worsens it. Furthermore, we demonstrate that in PV, hepcidin is not regulated by expanded erythropoiesis but is likely governed by inflammatory cytokines signaling via GP130-coupled receptors. These findings have important implications for understanding the pathophysiology of PV and offer new therapeutic strategies for this disease.


Conflict of interest statement

Conflict-of-interest disclosure: U.S. is a full-time employee of Silence Therapeutics GmbH and has stock options. The remaining authors declare no competing financial interests.

Figures

None
Graphical abstract
Figure 1.
Figure 1.
GWAS of PV. (A) Schematic of GWAS. Created with BioRender.com. (B) Manhattan plot showing results of GWAS of 440 PV cases vs 403 351 controls, assuming an additive genetic model. The red dashed line shows genome-wide significance level (P < 5E-8). Three loci with associations exceeding this threshold are labeled with the nearest gene. (C) Top SNP at each genetic loci that reached genome-wide significance. (D) LocusZoom plot of associations at the HFE locus, assuming a recessive genetic model. Rs1800562 (C282Y) highlighted, with the other SNPs colored per linkage disequilibrium (r2) to that SNP.
Figure 1.
Figure 1.
GWAS of PV. (A) Schematic of GWAS. Created with BioRender.com. (B) Manhattan plot showing results of GWAS of 440 PV cases vs 403 351 controls, assuming an additive genetic model. The red dashed line shows genome-wide significance level (P < 5E-8). Three loci with associations exceeding this threshold are labeled with the nearest gene. (C) Top SNP at each genetic loci that reached genome-wide significance. (D) LocusZoom plot of associations at the HFE locus, assuming a recessive genetic model. Rs1800562 (C282Y) highlighted, with the other SNPs colored per linkage disequilibrium (r2) to that SNP.
Figure 2.
Figure 2.
Iron and erythroid parameters in patients with PV and healthy controls. HCT (A), red blood cells (RBCs) (B), ferritin (C), transferrin saturation (D), serum hepcidin (E), serum ERFE (F), hepcidin-to-ferritin ratio (G), platelet count (H), and leukocyte count (I) of healthy controls (HC; blue) and patients with PV (red) (PV and HC, n = 30 each). Mann-Whitney test for panels A,D-I or unpaired 2-tailed t test with Welch correction for panels B-C. ∗∗P < .01; ∗∗∗P < .001; ∗∗∗∗P < .0001. HCT, hematocrit; ns, nonsignificant.
Figure 3.
Figure 3.
Novel mouse model of PV. (A) Schematic of BM transplant PV mouse model. (B-G) RBCs (B), reticulocytes (C), HCT (D), HGB (E), MCH (F), and MCV (G); control, n = 24 control and PV, n = 25. (H) Kidney Epo mRNA expression relative to Hprt; n = 6. (I) Spleen weight normalized to total body weight; n = 24. (J) Terminal erythropoiesis in the BM determined by flow cytometry. Based on CD44 expression and FSC-A, Ter119+ cells were gated into 5 distinct populations: I, proerythroblast (Pro-E); II, basophilic erythroblasts (Baso); III, polychromatic erythroblasts (Poly); IV, orthochromatic erythroblasts and reticulocytes (Ortho/Retic); and V, RBCs. Control, n = 24 control and PV, n = 25. Erfe mRNA expression relative to Hprt in (K) the BM, n = 13 control; PV, n = 17, and (L) the spleen; control, n = 7; PV, n = 14. (M) Serum ERFE; control, n = 14; PV, n = 15. (N) Liver Hamp1 mRNA expression relative to Hprt; control, n = 13; PV, n = 17. (O) Serum hepcidin; control, n = 9 and PV, n = 12. (P) Serum iron; n = 6. (Q) Liver; control, n = 17 and PV, n = 21. (R) Spleen (n = 15) nonheme iron content. Mann-Whitney test for panels B,D,I,L,M,N, unpaired 2-tailed t test with Welch correction for panels C,E-H,K,O-R, or two-way analysis of variance (ANOVA) with Šídák correction for multiple comparisons for panel J. ∗∗P < .01; ∗∗∗P < .001; and ∗∗∗∗P<.0001.
Figure 4.
Figure 4.
ERFE does not affect hepcidin in PV. (A) Serum ERFE; control, n = 4; Erfe-KO, n = 4; PV, n = 5; and PV × Erfe-KO, n = 11. (B) Liver Hamp1 mRNA expression relative to Hprt; control, n = 15; Erfe-KO, n = 15; PV, n = 15; and PV × Erfe-KO, n = 13. (C) Serum hepcidin; control, n = 4; Erfe-KO, n = 4; PV, n = 12; and PV × Erfe-KO, n = 12. (D) Liver and (E) spleen nonheme iron content; control, n = 6; Erfe-KO, n = 6; PV × Erfe-KO, n = 6; and PV, n = 8. (F-H) RBCs (F), HCT (G), and HGB (H); control, n = 9; Erfe-KO, n = 8; PV, n = 15; and PV × Erfe-KO, n = 14. (I) Terminal erythropoiesis in the BM determined by flow cytometry. Based on CD44 expression and FSC-A, Ter119+ cells were gated into 5 distinct populations: I, proerythroblast (Pro-E); II, basophilic erythroblasts (Baso); III, polychromatic erythroblasts (Poly); IV, orthochromatic erythroblasts and reticulocytes (Ortho/Retic); and V, RBCs; control, n = 9; Erfe-KO, n = 8; PV, n = 13; and PV × Erfe-KO, n = 12. One-way ANOVA for panels A,C,E-H, Kruskal-Wallis test for panels B,D, or two-way ANOVA with Dunnett correction for multiple comparisons for panel I. ∗P < .05; ∗∗P < .01; In panel I, “∗” represents control vs PV, and “^” represents PV vs PV × Erfe-KO.
Figure 5.
Figure 5.
Hepcidin deletion worsens PV erythroid disease severity. (A) Liver Hamp1 mRNA expression relative to Hprt. (B) Serum hepcidin. (C-E) HGB (C), MCH (D), and HCT (E). (F) Terminal erythropoiesis in the BM determined by flow cytometry. Based on CD44 expression and FSC-A, Ter119+ cells were gated into 5 distinct populations: I , proerythroblasts; II, basophilic erythroblasts; III, polychromatic erythroblasts; IV, orthochromatic erythroblasts and reticulocytes; and V, RBCs. (G) MCV. (H) Liver and (I) spleen nonheme liver iron. (J) RBCs. Control, n = 6; iHamp-KO, n = 4; PV, n = 4; and PV × iHamp-KO, n = 7, except for panel B in which control, n = 3; PV, n = 3; and PV × iHamp-KO, n = 4. Kruskal-Wallis test for panels A,D,G, ordinary one-way ANOVA for panels B-C,E,H-J, or two-way ANOVA with Dunnett correction for multiple comparisons for panel F. ∗P < .05; ∗∗P < .01; ∗∗∗P < .001; ∗∗∗∗P < .0001.
Figure 6.
Figure 6.
TMPRSS6 inhibition increases endogenous hepcidin and improves PV disease severity. (A) Schematic of experimental design. (B-C) Liver Tmprss6 (B) and Hamp1 (C) mRNA expression relative to Hprt; control + NTC, n = 9; PV + NTC, n = 16; PV + TMP, n = 18. (D) Serum hepcidin; control + NTC, n = 4; PV + NTC, n = 7; PV + TMP, n = 8. (E-H) HCT (E), HGB (F), MCH (G), and RBCs (H); control + NTC, n = 6; PV + NTC, n = 14; PV + TMP, n = 17. (I) Kidney Epo mRNA expression relative to Hprt; control + NTC, n = 9; PV + NTC, n = 16; PV + TMP, n = 17. (J-K) Terminal erythropoiesis in the BM (J) and the spleen (K) determined by flow cytometry. Based on CD44 expression and FSC-A, Ter119+ cells were gated into 5 distinct populations: I, proerythroblasts; II, basophilic erythroblasts; III, polychromatic erythroblasts; IV, orthochromatic erythroblasts and reticulocytes; and V, RBCs; BM: control + NTC, n = 7; PV + NTC, n = 13; and PV + TMP, n = 19; and spleen: control + NTC, n = 7; PV + NTC, n = 5; and PV + TMP, n = 7. (L-M) Spleen (L) and BM (M) Erfe mRNA expression relative to Hprt; spleen: control + NTC, n = 9; PV + NTC, n = 8; and PV + TMP, n = 8; BM: control + NTC, n = 8; PV + NTC, n = 11; PV + TMP, n = 16. (N) Serum ERFE; control + NTC, n = 7; PV + NTC, n = 7; and PV + TMP, n = 8. (O) MCV; control + NTC, n = 6; PV + NTC, n = 14; and PV + TMP, n = 17. (P) Serum iron; control group, n = 2; PV groups, n = 4. (Q-R) Liver (Q) and spleen (R) nonheme iron content; liver: control + NTC, n = 9; PV + NTC, n = 16; PV + TMP, n = 18; spleen: control + NTC, n = 5 and PV groups, n = 11. Kruskal-Wallis test for panels B,D,G,I,L-N,P,R, ordinary one-way ANOVA for panels C,E-F,H,O,Q, or two-way ANOVA with Tukey correction for multiple comparisons for panels J-K. ∗P < .05; ∗∗P < .01; ∗∗∗P < .001; ∗∗∗∗P < .0001. NTC, nontargeting control siRNA; TMP, TMPRSS6 siRNA.
Figure 7.
Figure 7.
Inflammatory cytokines may upregulate hepcidin in PV. (A) Mean-difference plot showing the average log expression of each gene (x-axis) and their log-fold change between PV and control liver samples (y-axis). The DEGs are highlighted with points in red and blue indicating upregulated and downregulated genes, respectively (adjusted P value <.05). (B) Heatmap of the expression of all DEGs with hierarchical clustering in which expression values are standardized to have mean of 0 and standard deviation of 1 for each gene. (C) Bar chart depicting GO biological processes, MSigDB hallmark gene sets, or KEGG pathways relating to JAK-STAT signaling, inflammatory response, IL-6 responses, or cytokine-cytokine receptor interactions that are associated with upregulated genes in PV liver samples vs control. x-axis represents statistical significance of the enrichment, increasing from left to right. The red dotted line represents P = .05. (D) HAMP mRNA expression of HepG2 cells cultured in media supplemented with 2% plasma from HC donors or patients with PV; HC, n = 4; PV, n = 3. (E) Mouse serum IL-6; control, n = 8; PV, n = 10. (F-H) Liver Saa1 (F), Fga (G), and Hamp1 (H) relative to Hprt; control + anti–immunoglobulin G (IgG), n = 14; control + anti–IL-6, n = 9; PV + anti-IgG, n = 10; and PV + anti–IL-6, n = 13. (I) SMAD7 and FGA mRNA expression of HepG2 cells cultured in media supplemented with 2% plasma from HC donors or patients with PV; n = 4. (J-K) HAMP mRNA expression of HepG2 (J) or Huh7 (K) cells cultured in media supplemented with 10 ng/mL recombinant human IL-6–family cytokines; n = 3. The red line in panel J indicates HAMP expression in the absence of additional cytokines. (L) HAMP mRNA expression of HepG2 cells cultured in media supplemented with 2% plasma from HC donors or patients with PV with the addition of anti-GP130 antibodies or vehicle control (phosphate-buffered saline); n = 4. Unpaired 2-tailed t test with Welch correction for panels D-E, Kruskal-Wallis test for panels F-H, or two-way ANOVA with Šídák correction for multiple comparisons for panels I,L. ∗P < .05; ∗∗P < .01; ∗∗∗P < .001; ∗∗∗∗P < .0001. GO, gene ontology; OSM, oncostatin M; LIF, leukemia inhibitory factor; CT-1, cardiotrophin 1; CNTF, ciliary neurotrophic factor; CLCF1, cardiotrophin-like cytokine factor.

Comment in

References

    1. Baxter EJ, Scott LM, Campbell PJ, et al. Acquired mutation of the tyrosine kinase JAK2 in human myeloproliferative disorders. Lancet. 2005;365(9464):1054–1061. - PubMed
    1. James C, Ugo V, Le Couédic JP, et al. A unique clonal JAK2 mutation leading to constitutive signalling causes polycythaemia vera. Nature. 2005;434(7037):1144–1148. - PubMed
    1. Levine RL, Wadleigh M, Cools J, et al. Activating mutation in the tyrosine kinase JAK2 in polycythemia vera, essential thrombocythemia, and myeloid metaplasia with myelofibrosis. Cancer Cell. 2005;7(4):387–397. - PubMed
    1. Kralovics R, Passamonti F, Buser AS, et al. A gain-of-function mutation of JAK2 in myeloproliferative disorders. N Engl J Med. 2005;352(17):1779–1790. - PubMed
    1. McMullin MF, Wilkins BS, Harrison CN. Management of polycythaemia vera: a critical review of current data. Br J Haematol. 2016;172(3):337–349. - PubMed

Publication types