. 2023 Apr;22(4):511-523.
doi: 10.1038/s41563-023-01495-3. Epub 2023 Mar 16.

Combinatorial treatment rescues tumour-microenvironment-mediated attenuation of MALT1 inhibitors in B-cell lymphomas

Affiliations

Combinatorial treatment rescues tumour-microenvironment-mediated attenuation of MALT1 inhibitors in B-cell lymphomas

Shivem B Shah et al. Nat Mater. 2023 Apr.

Abstract

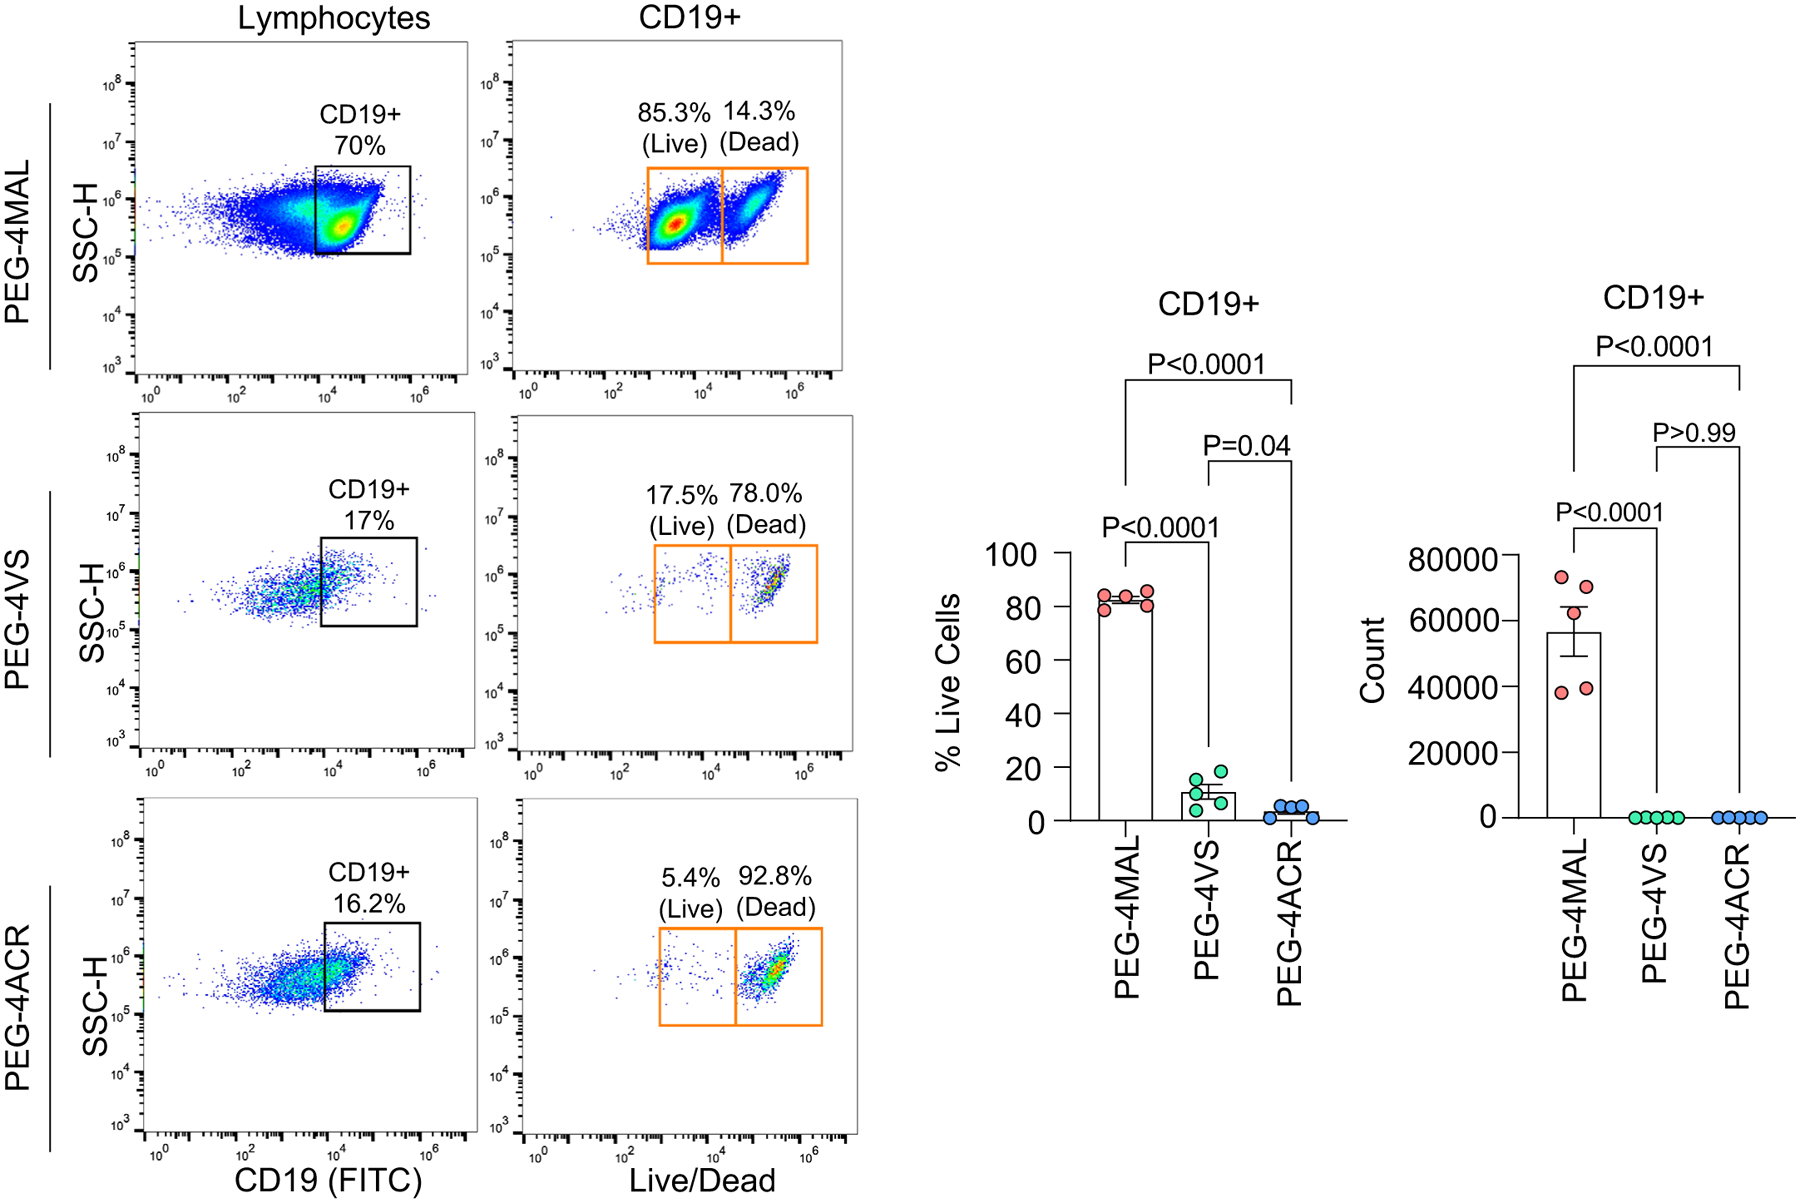
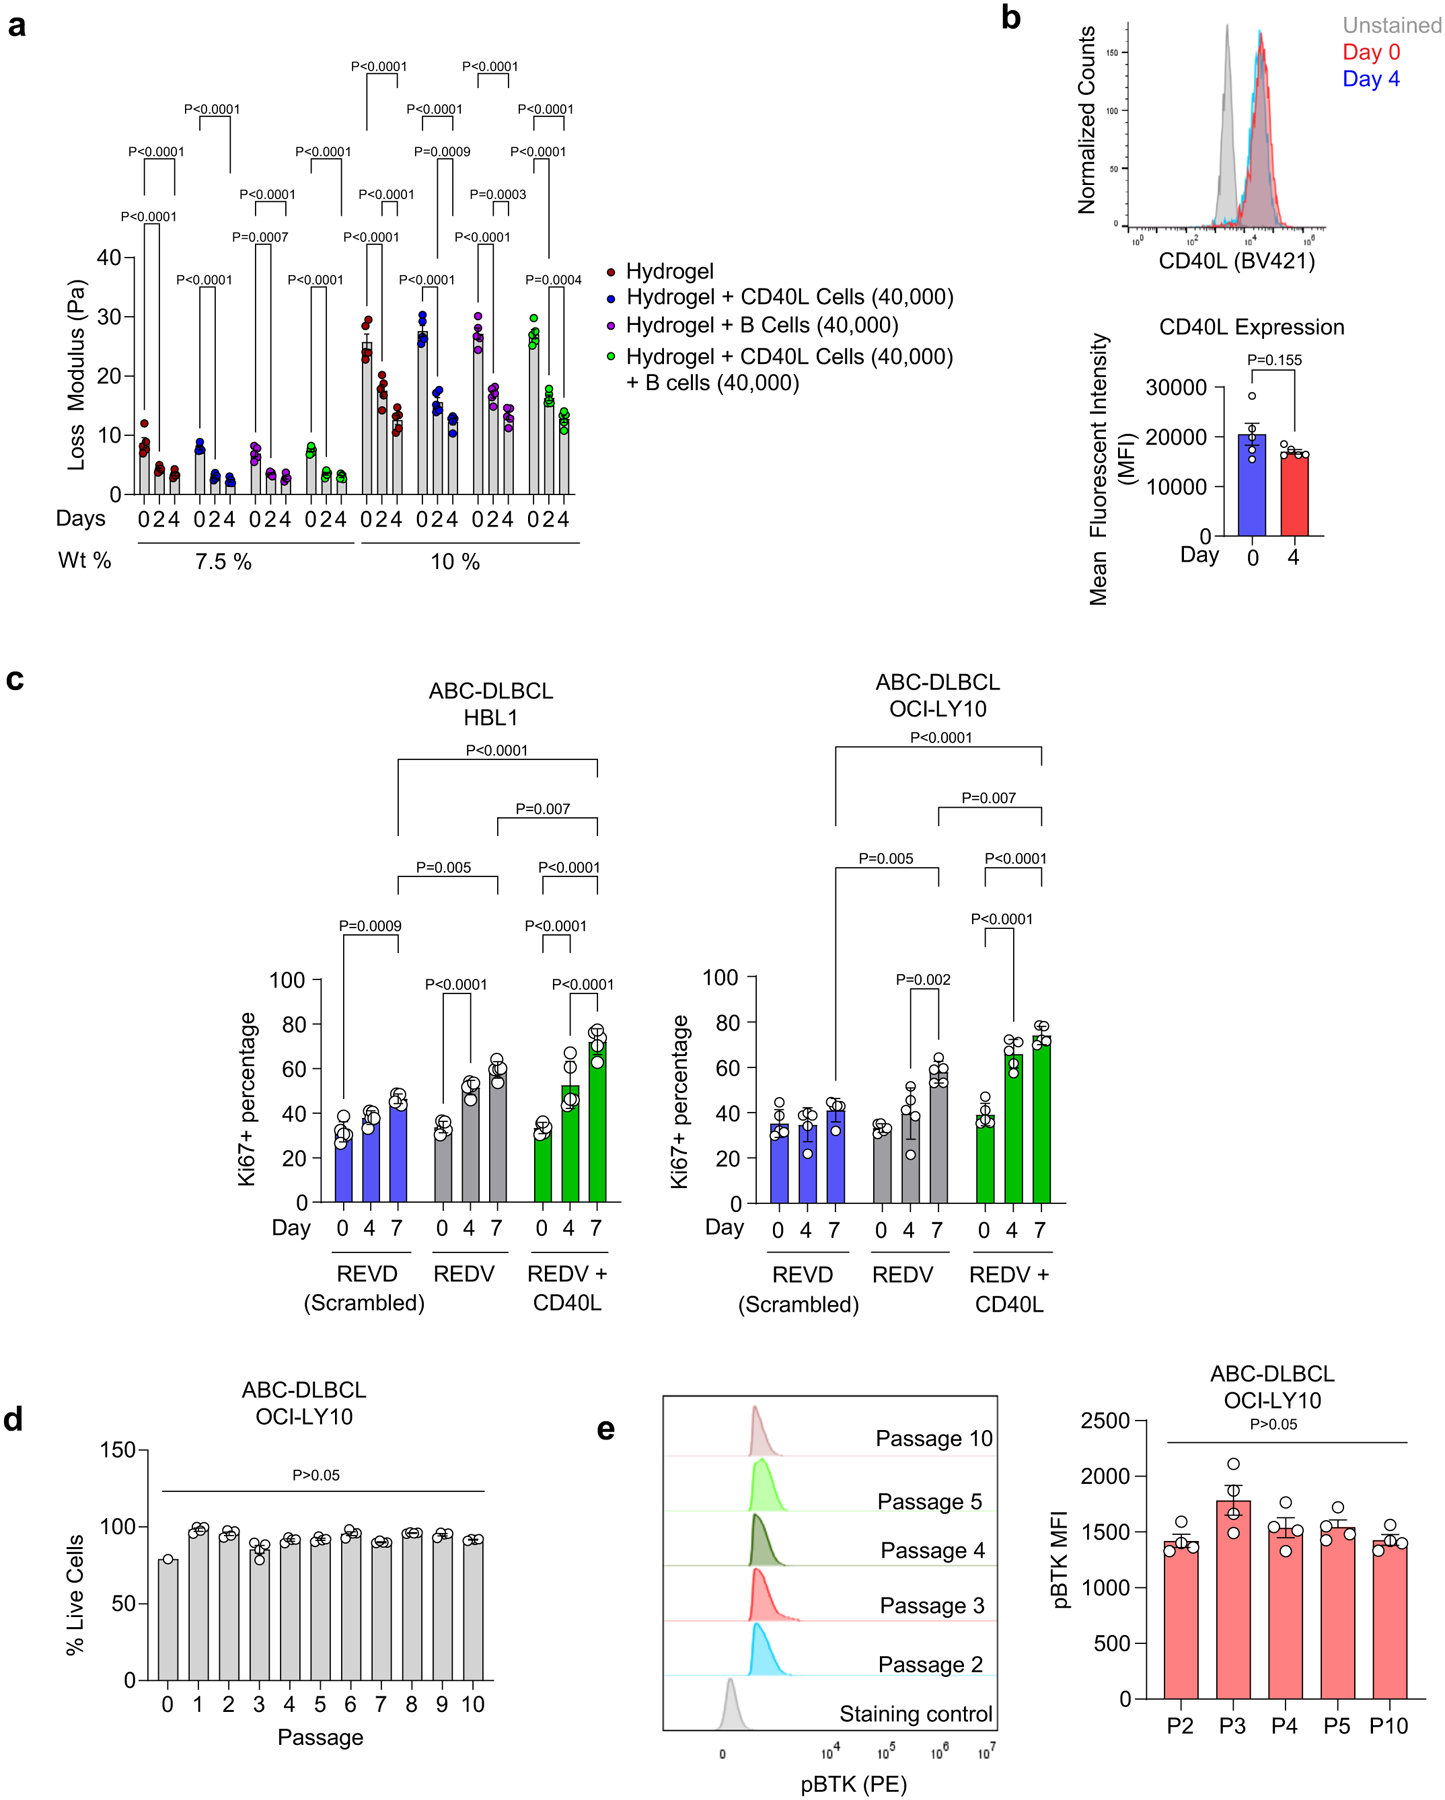
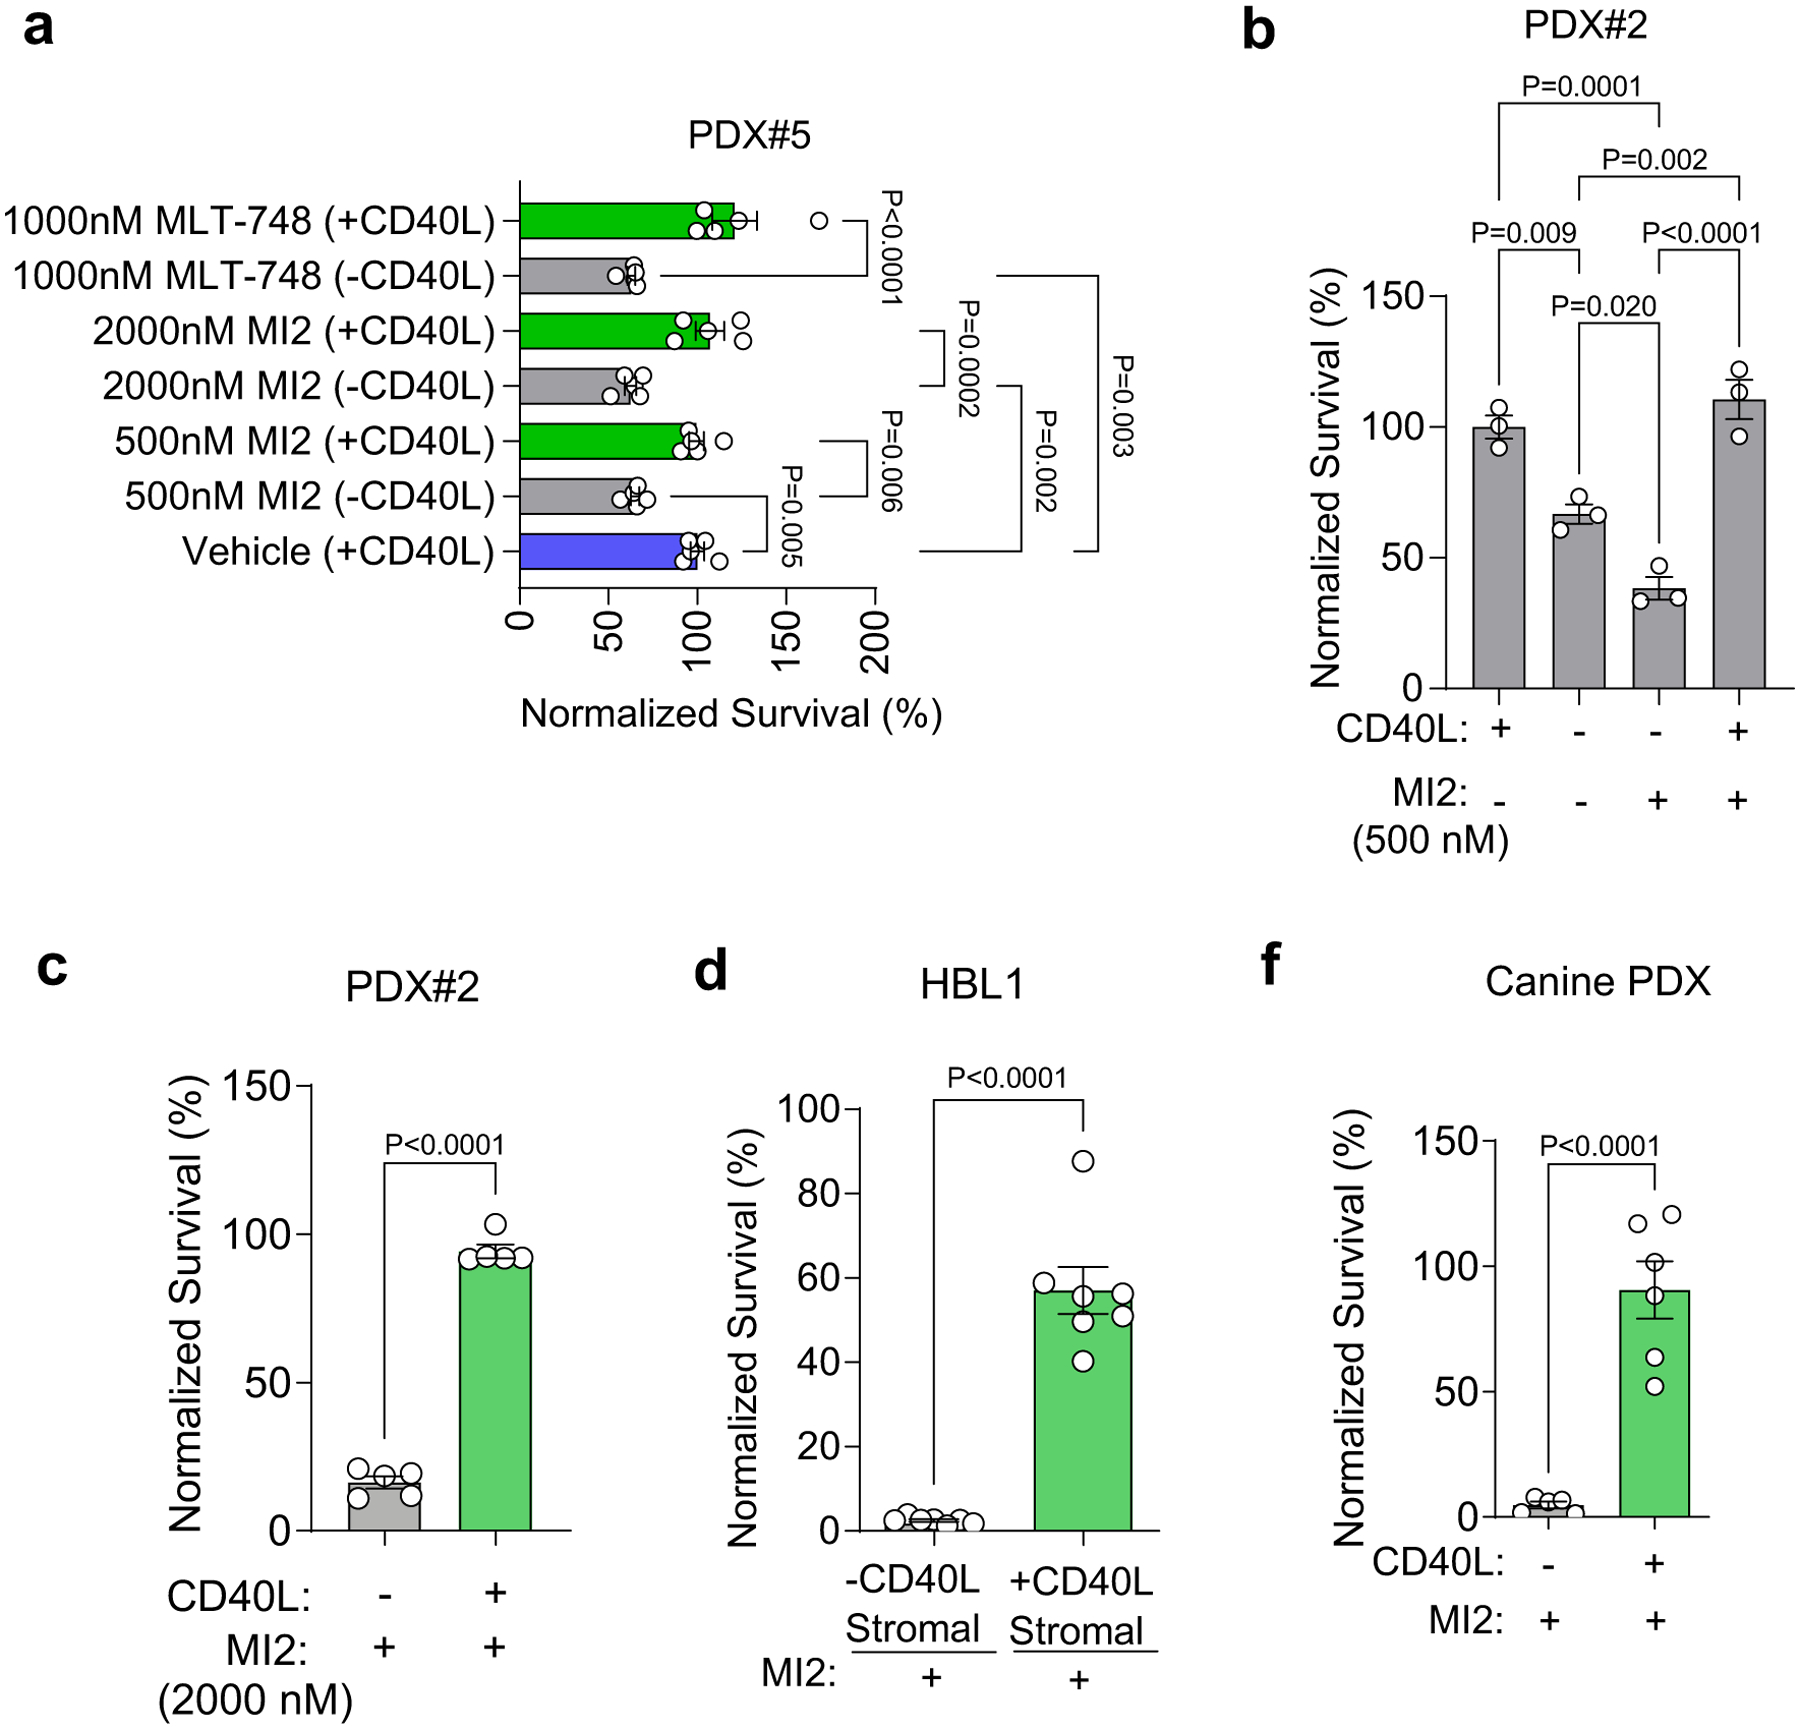
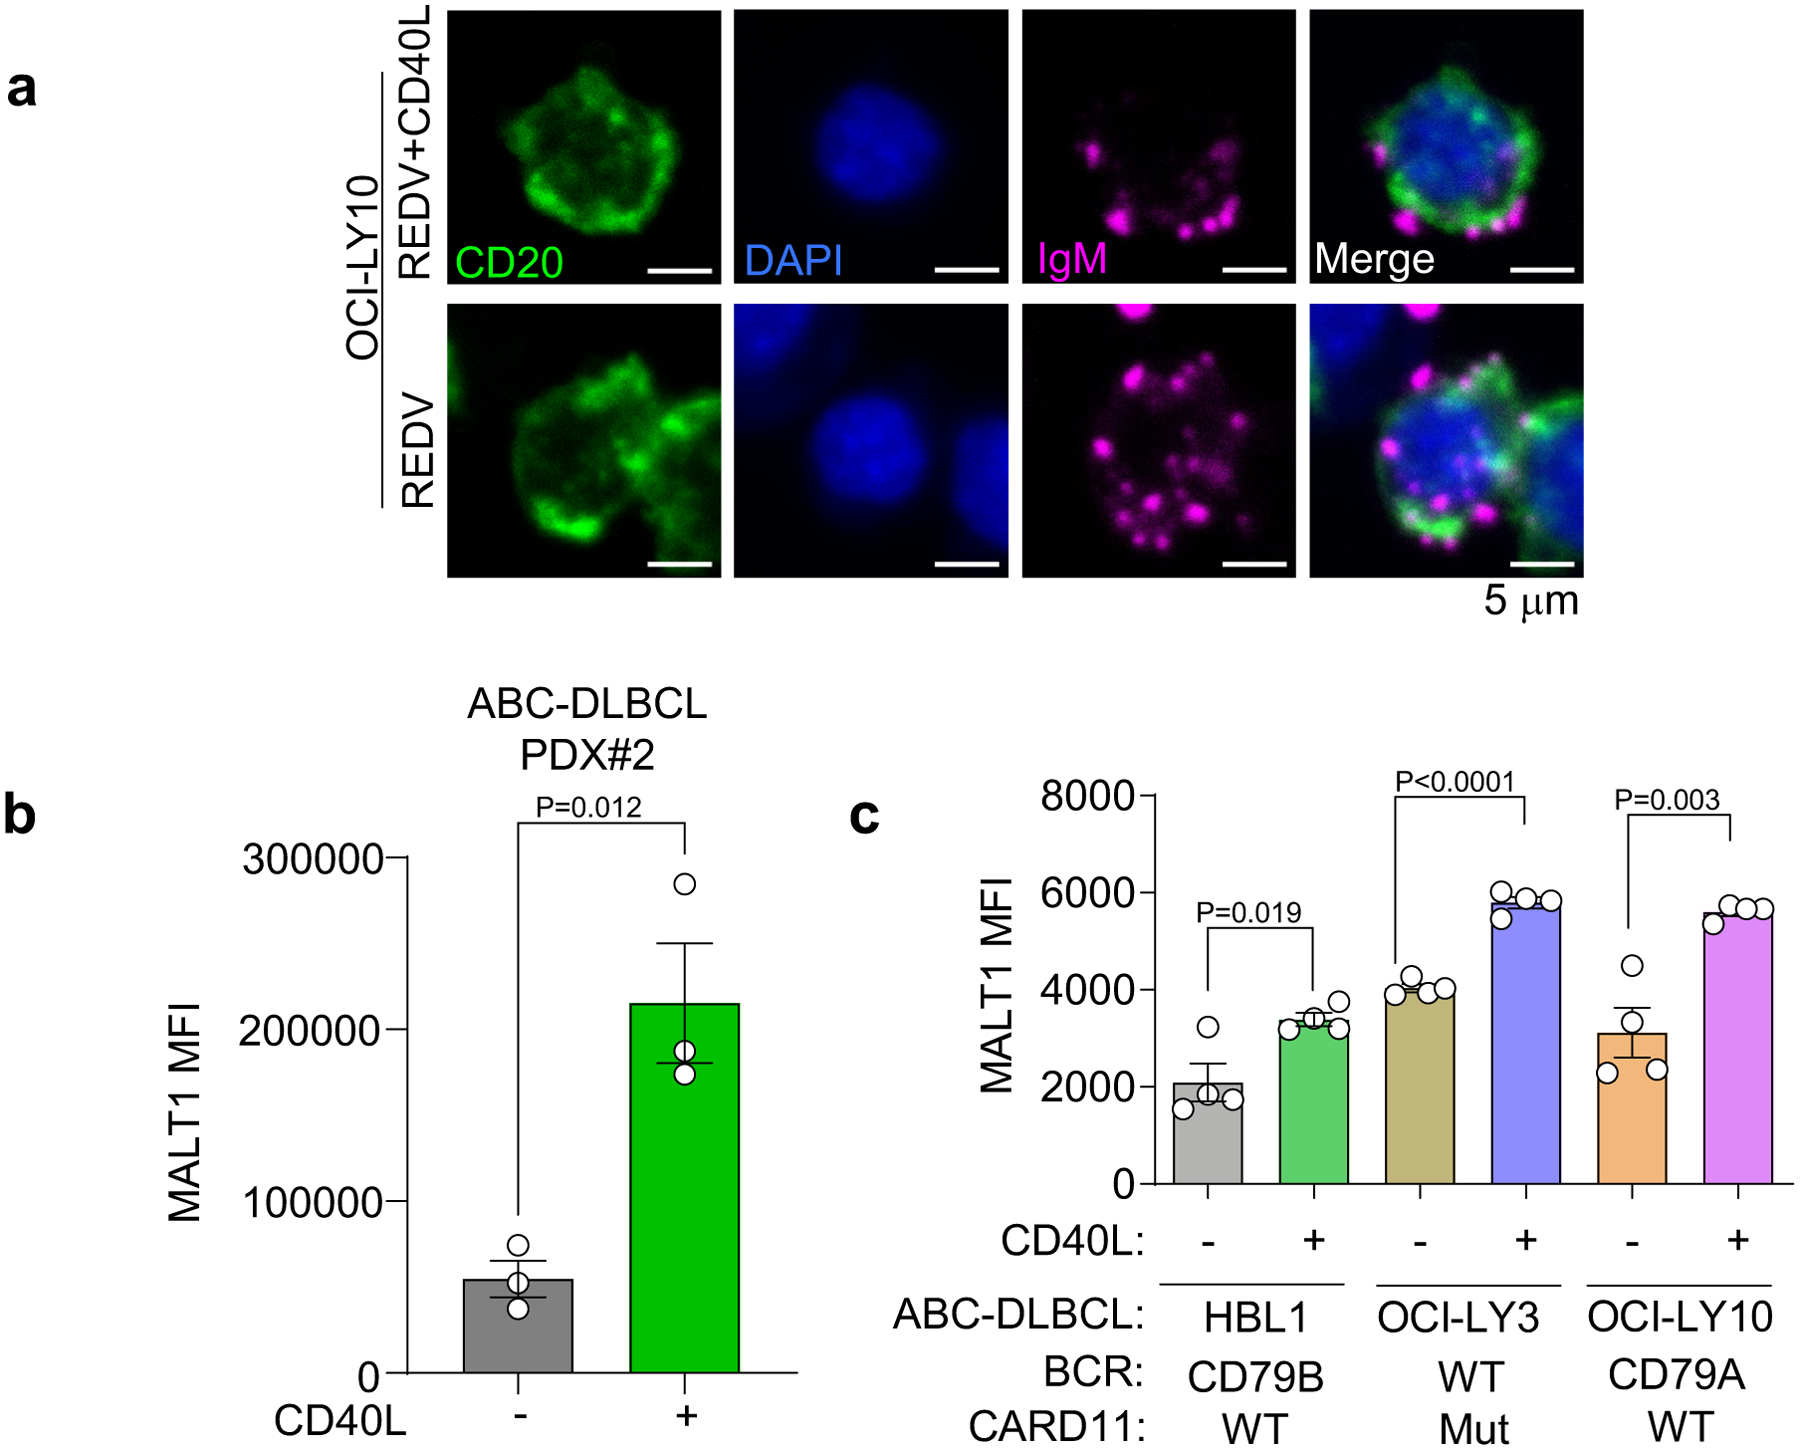
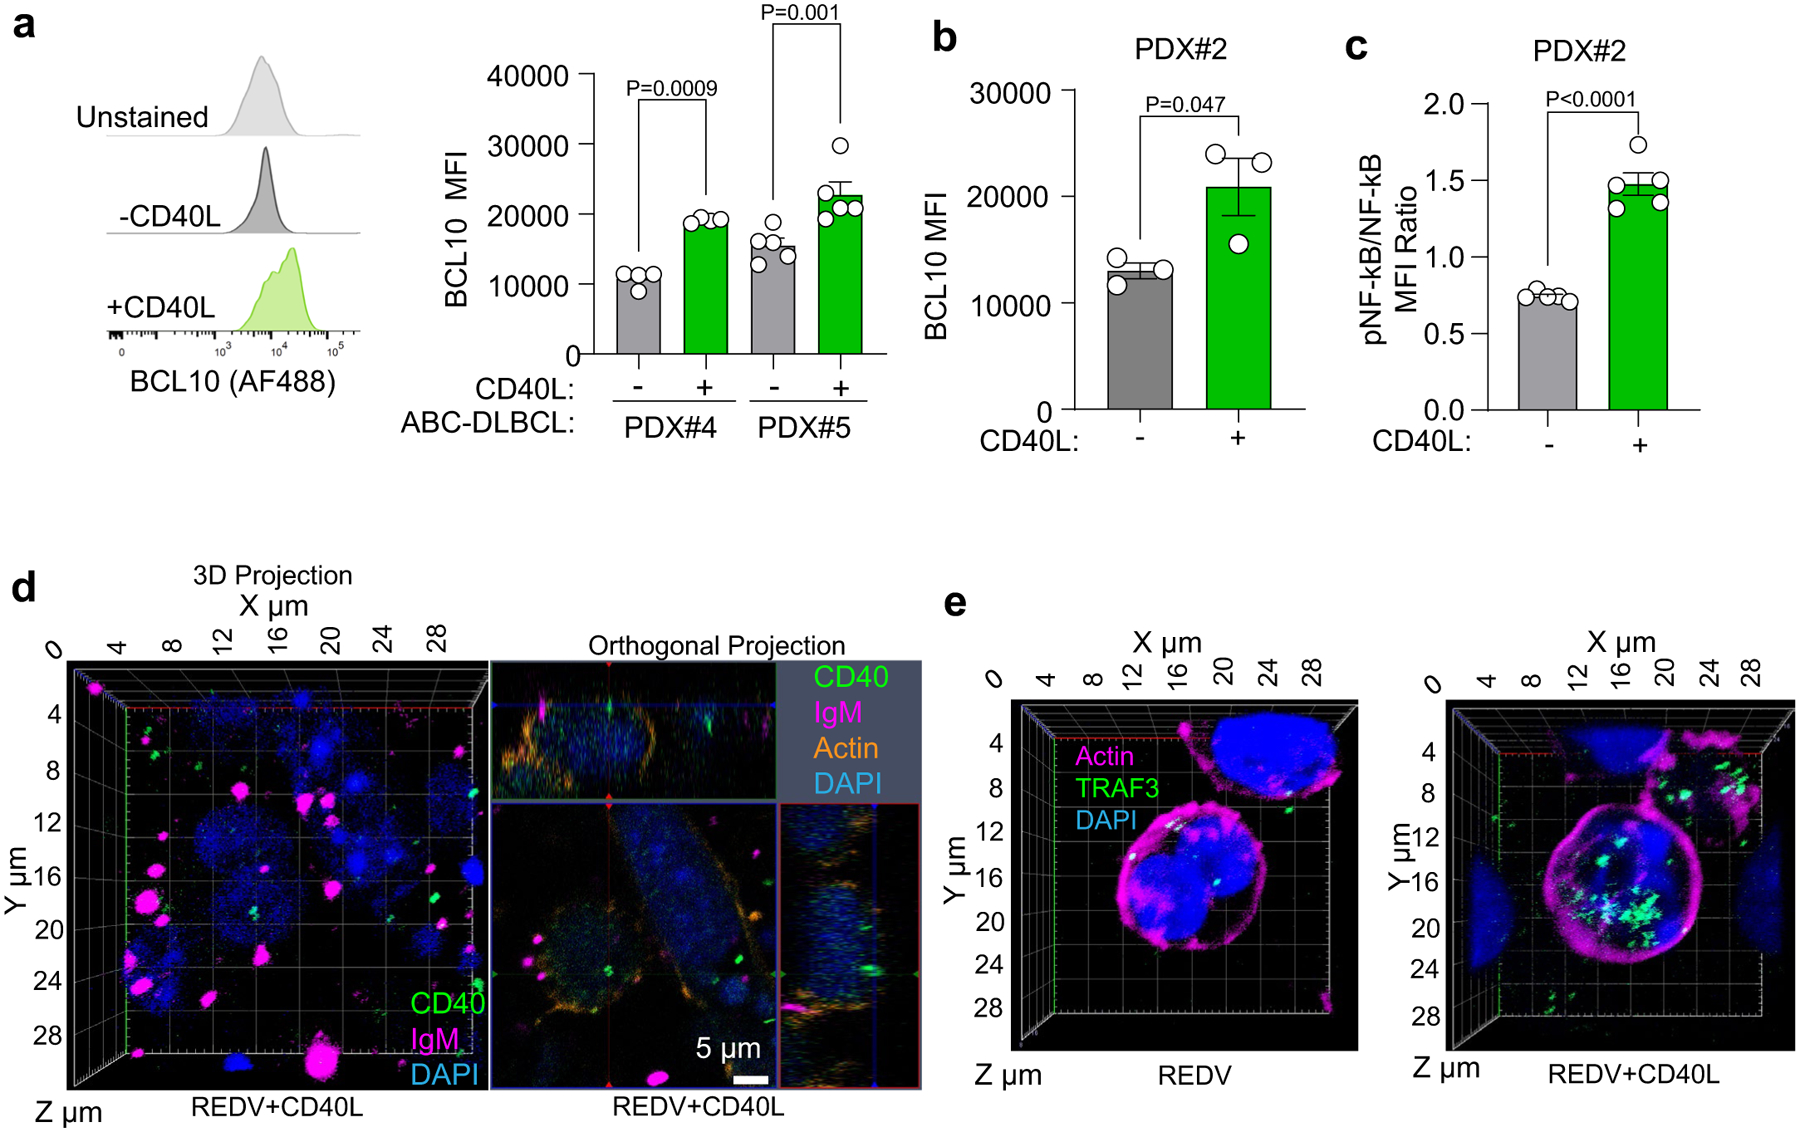
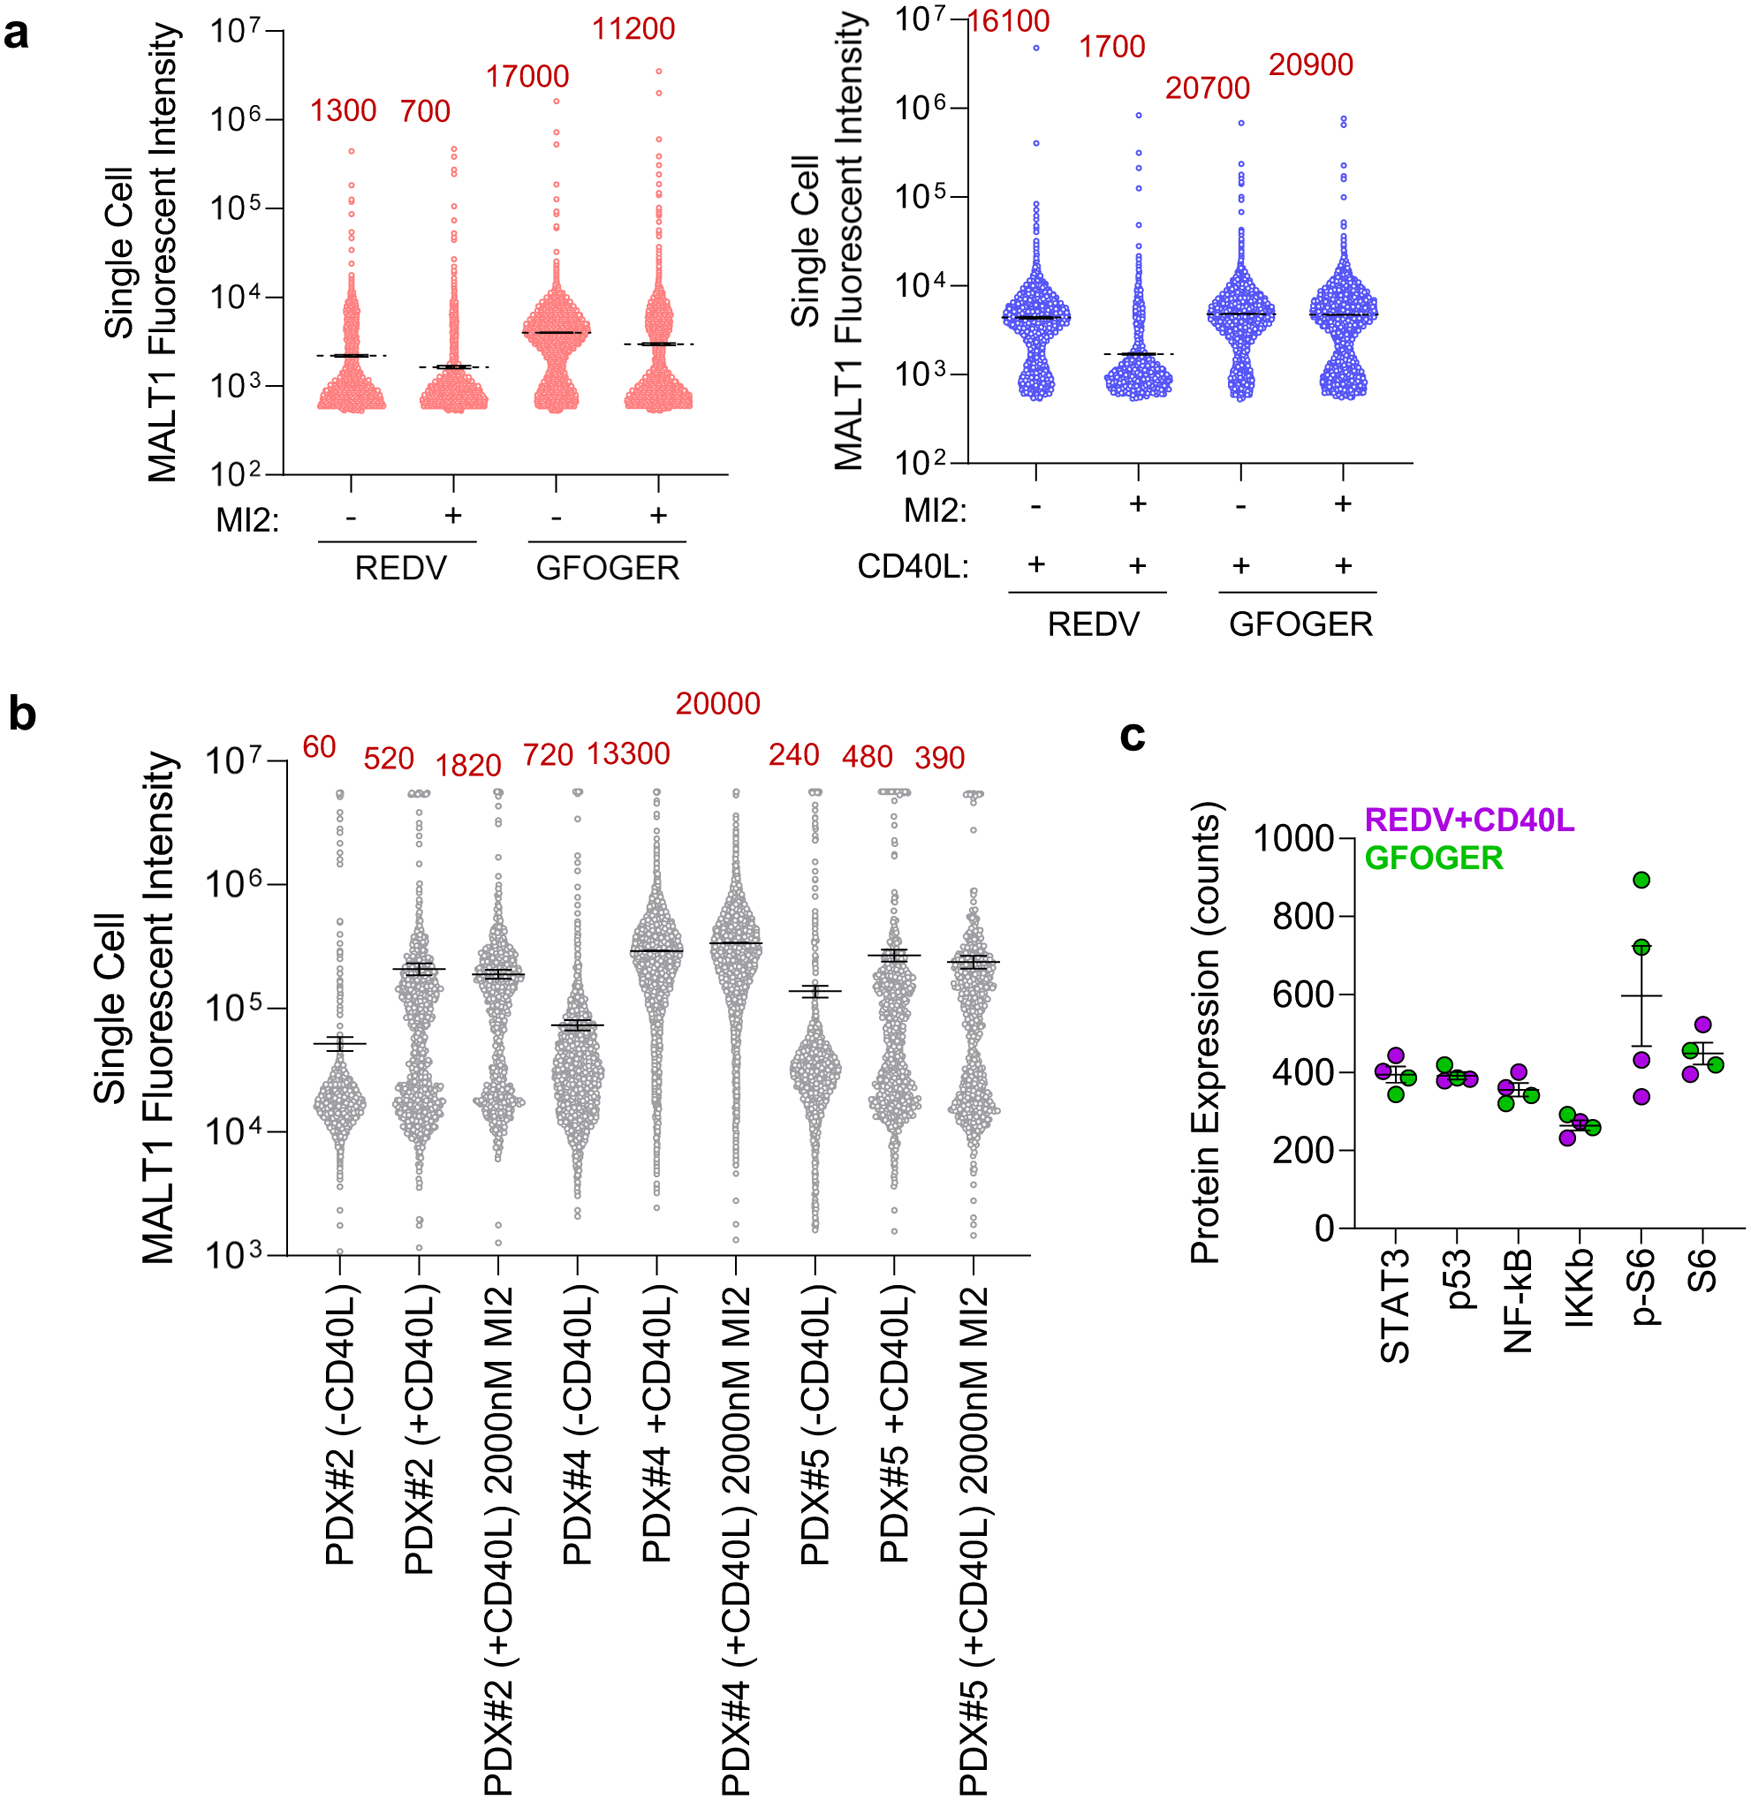
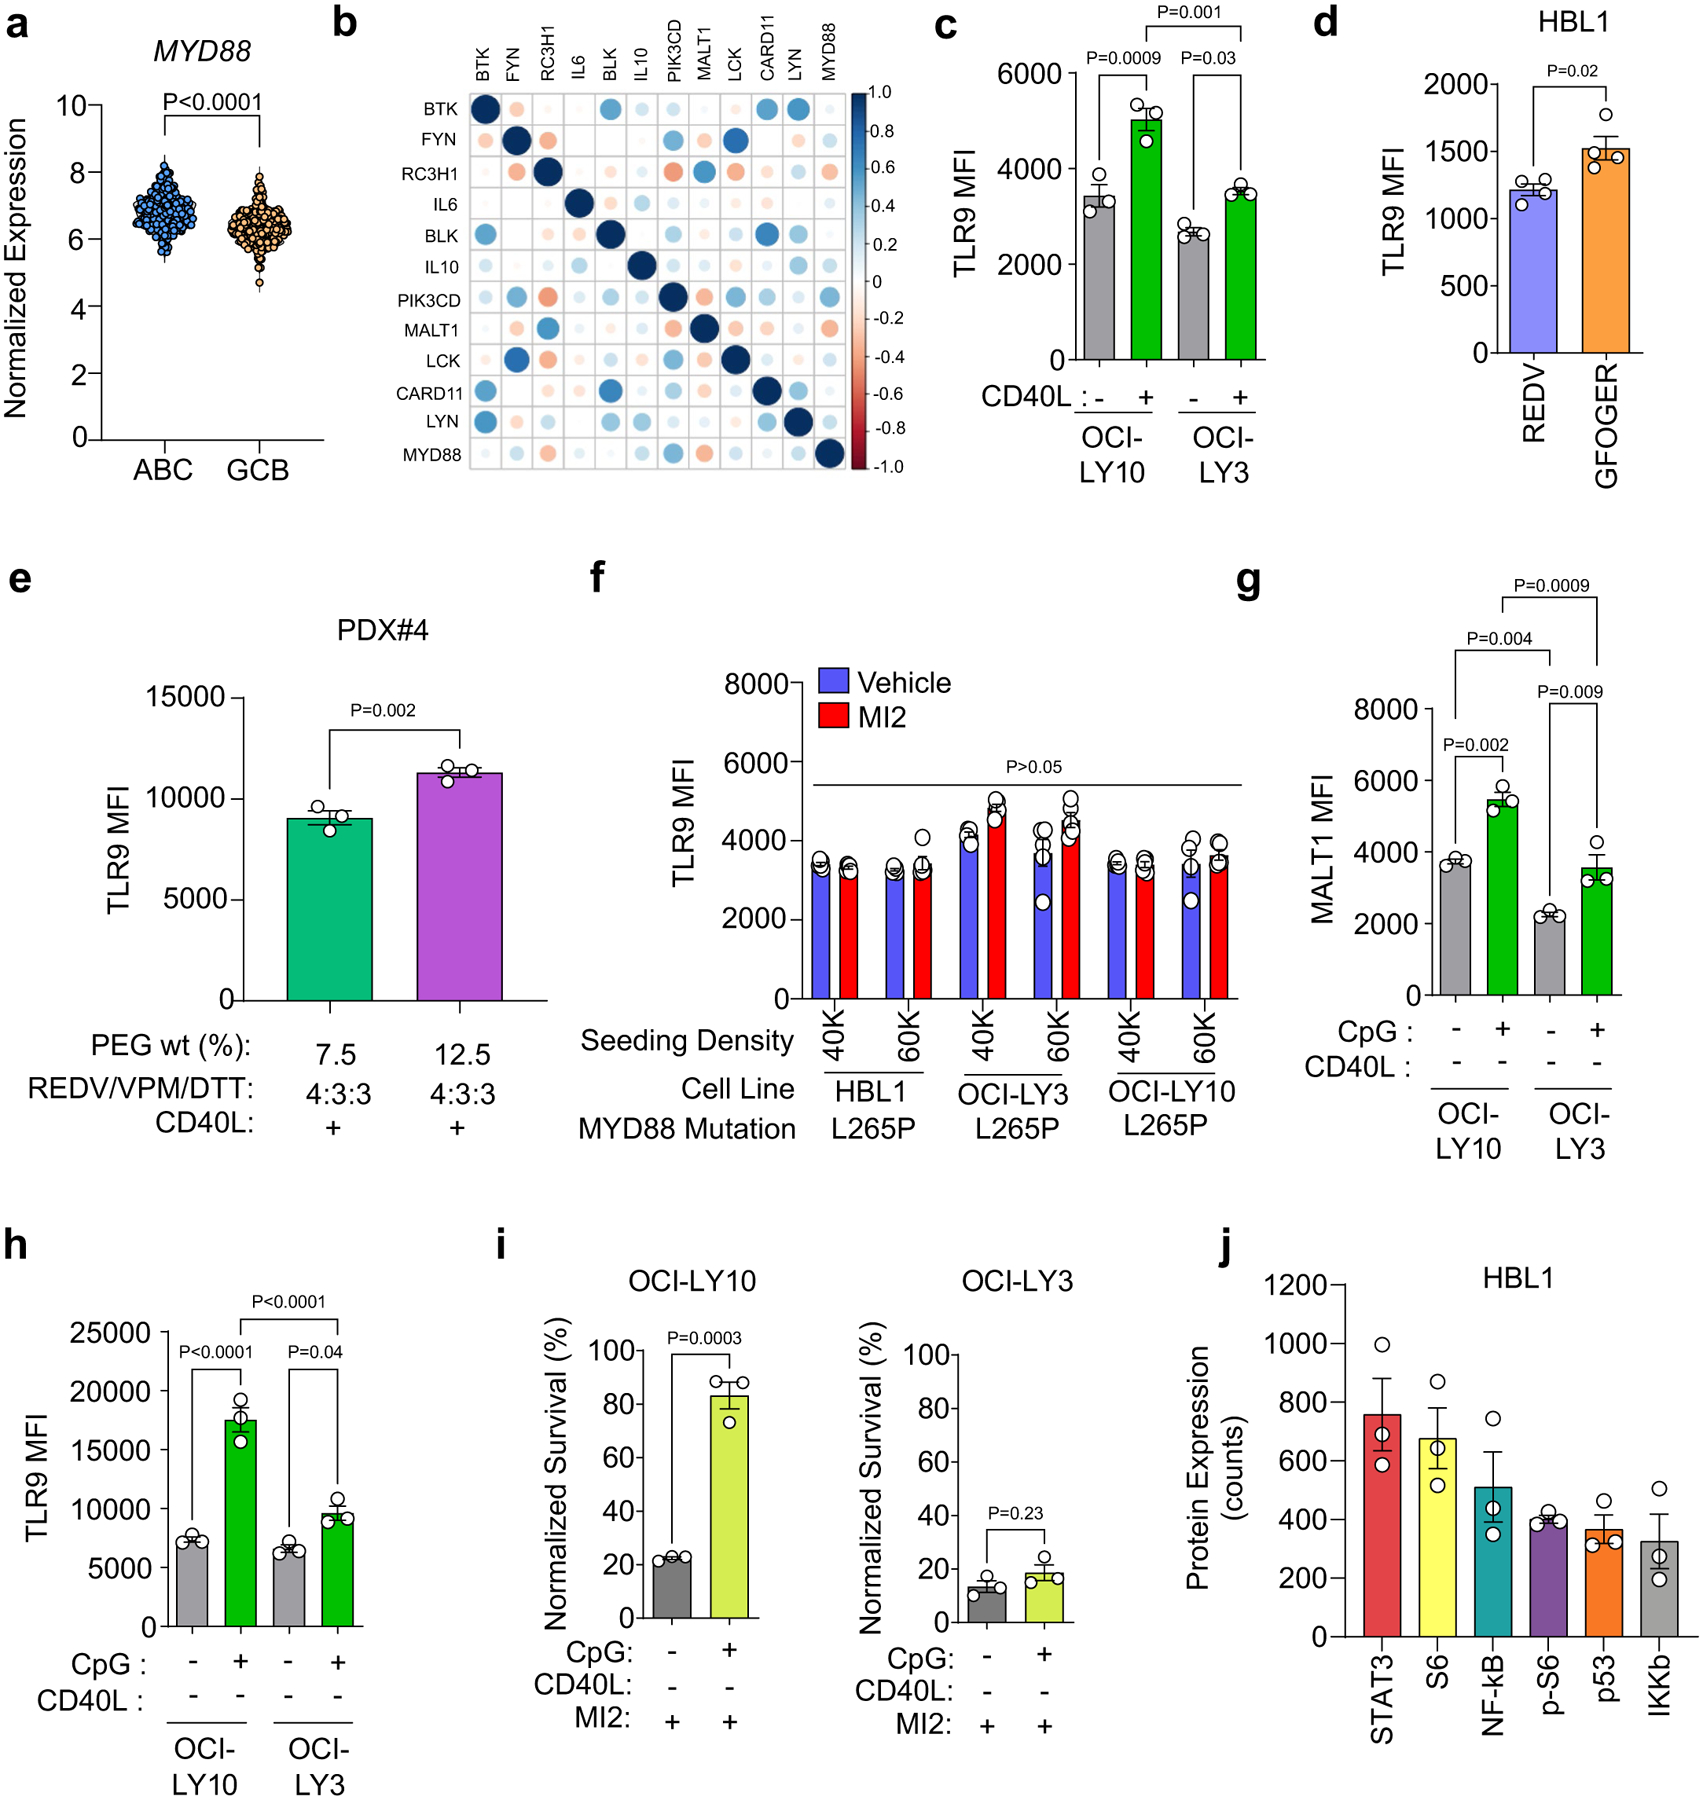
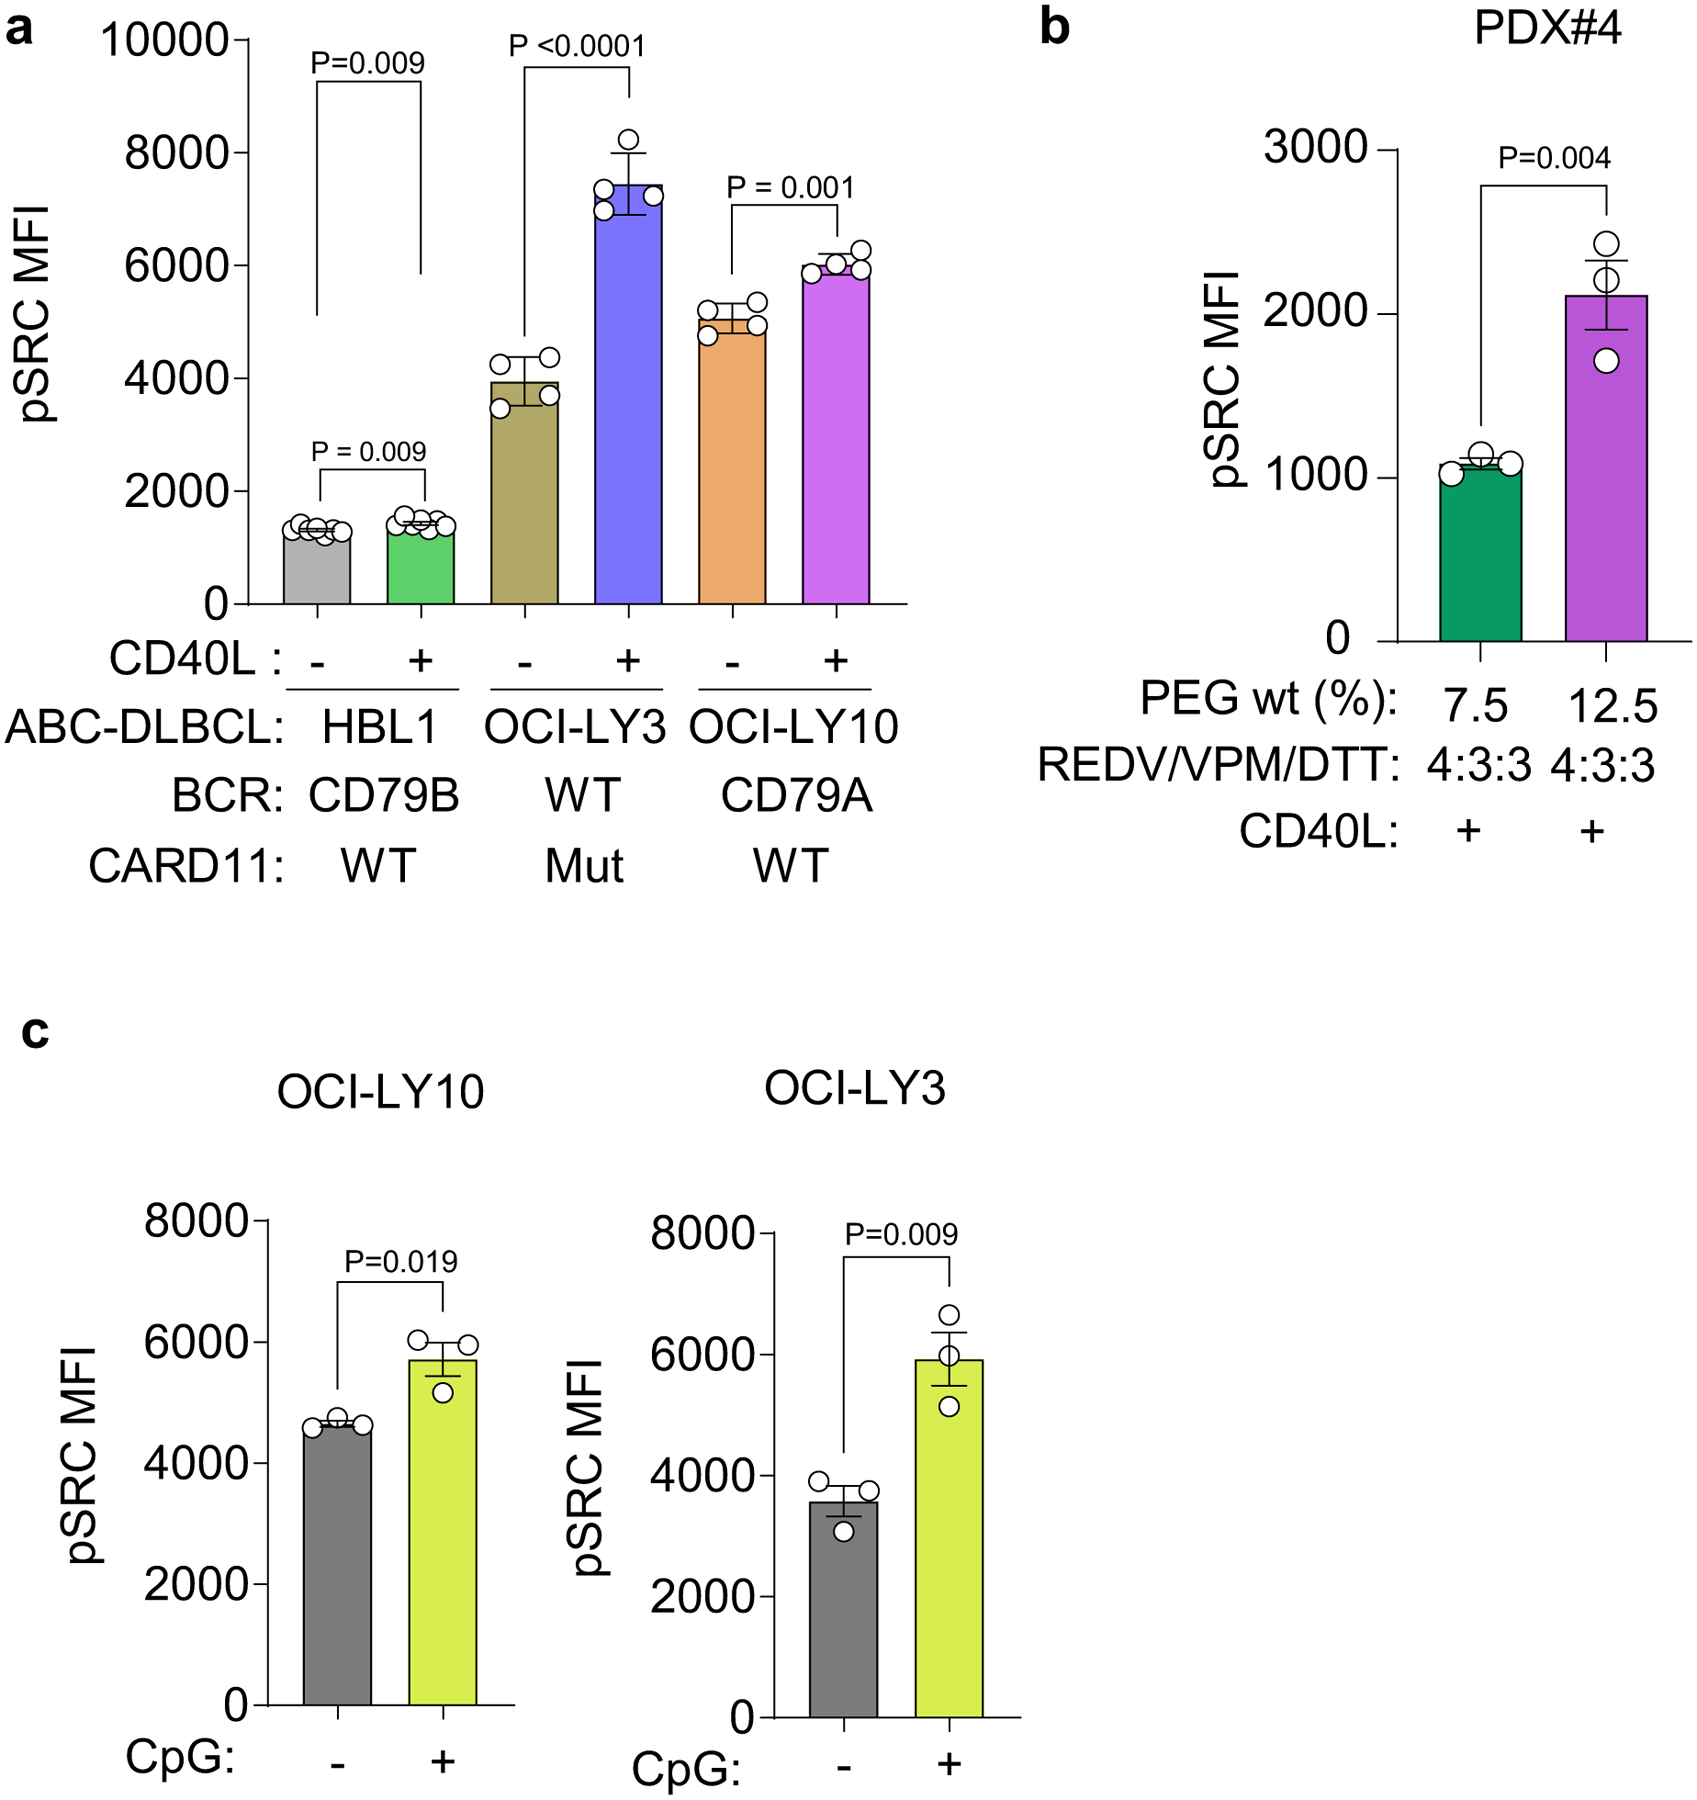
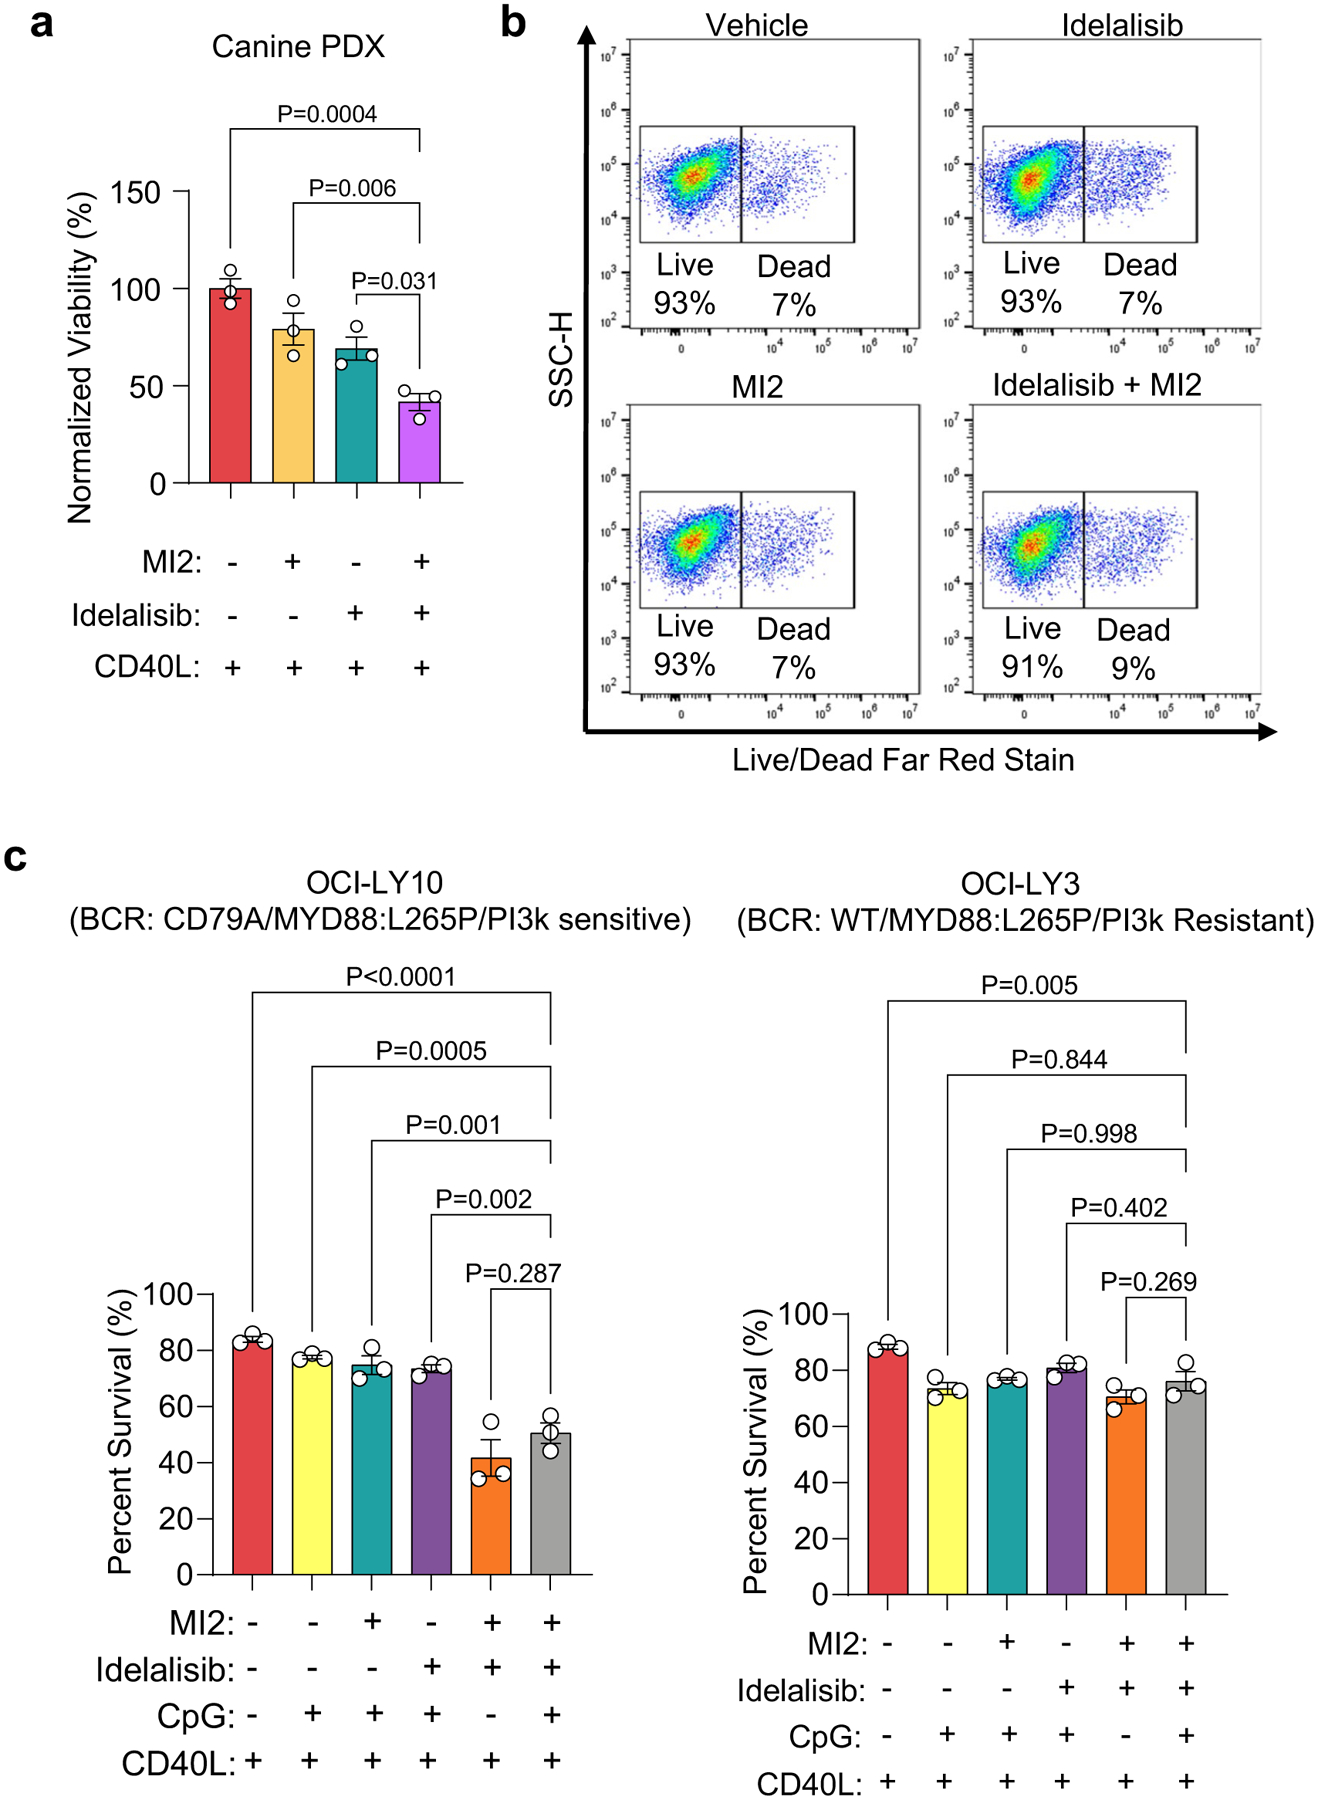
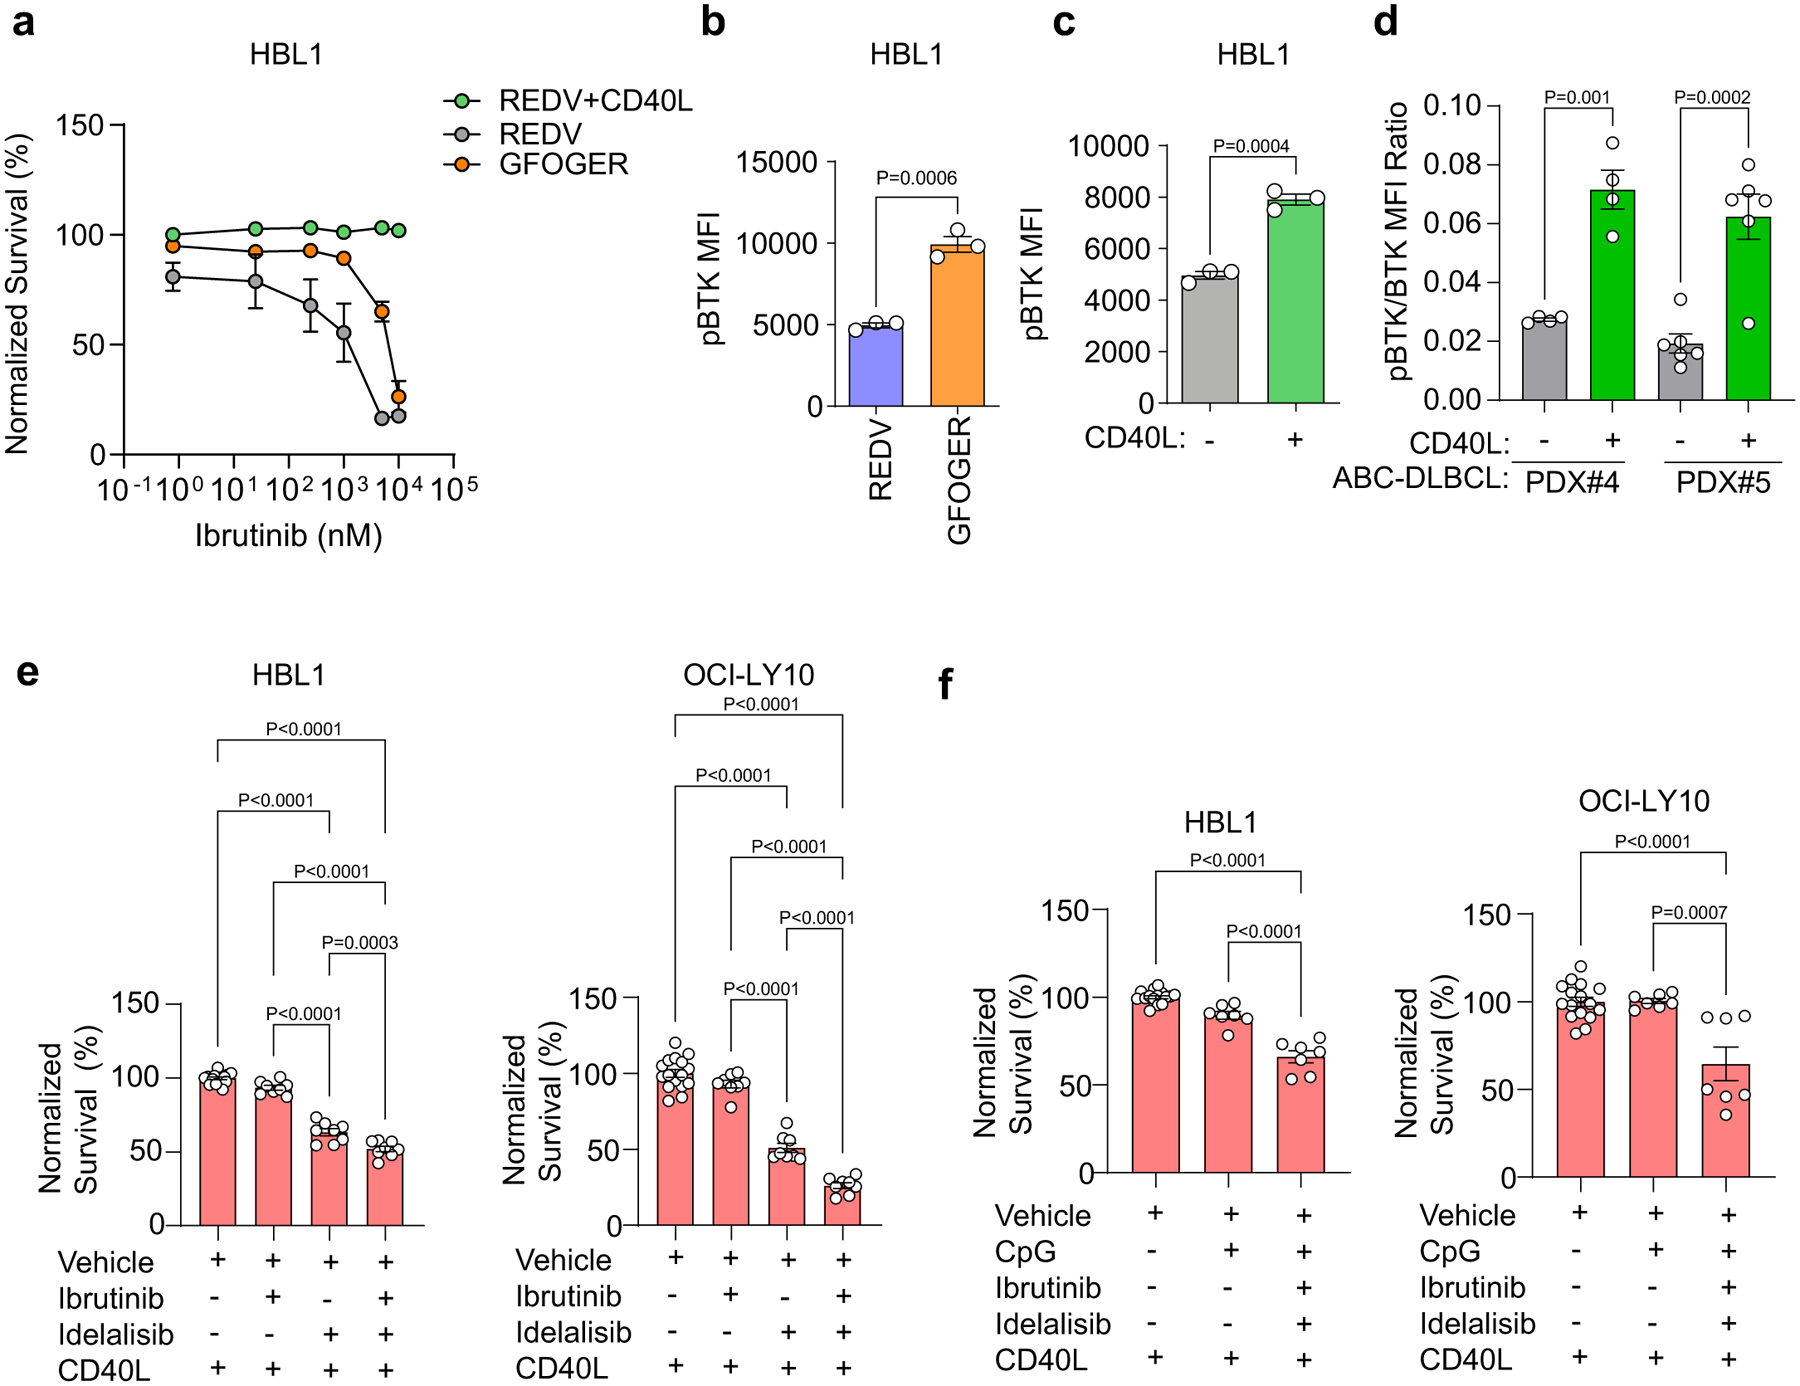
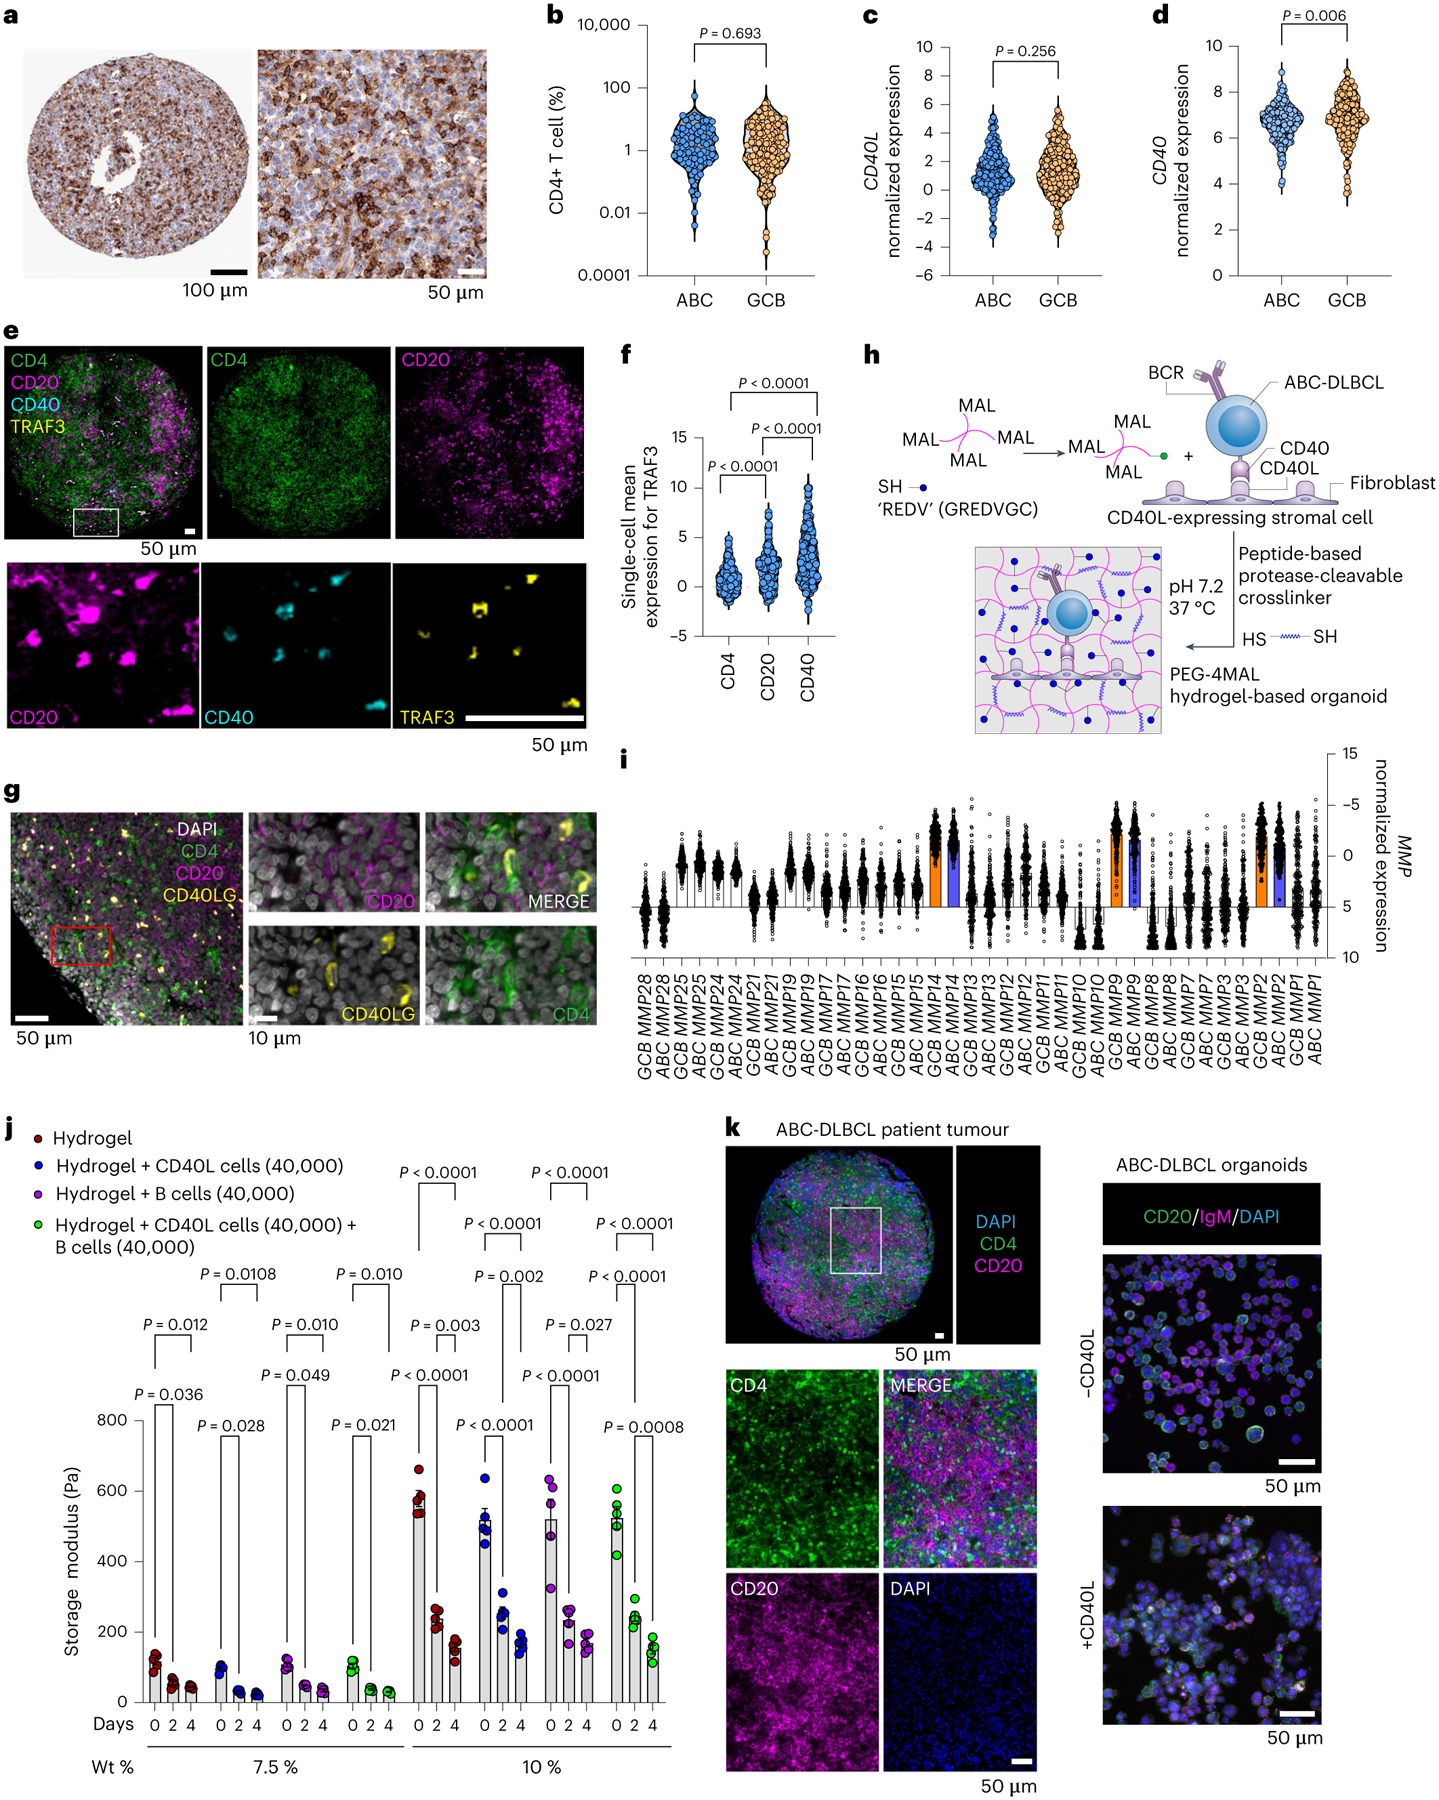
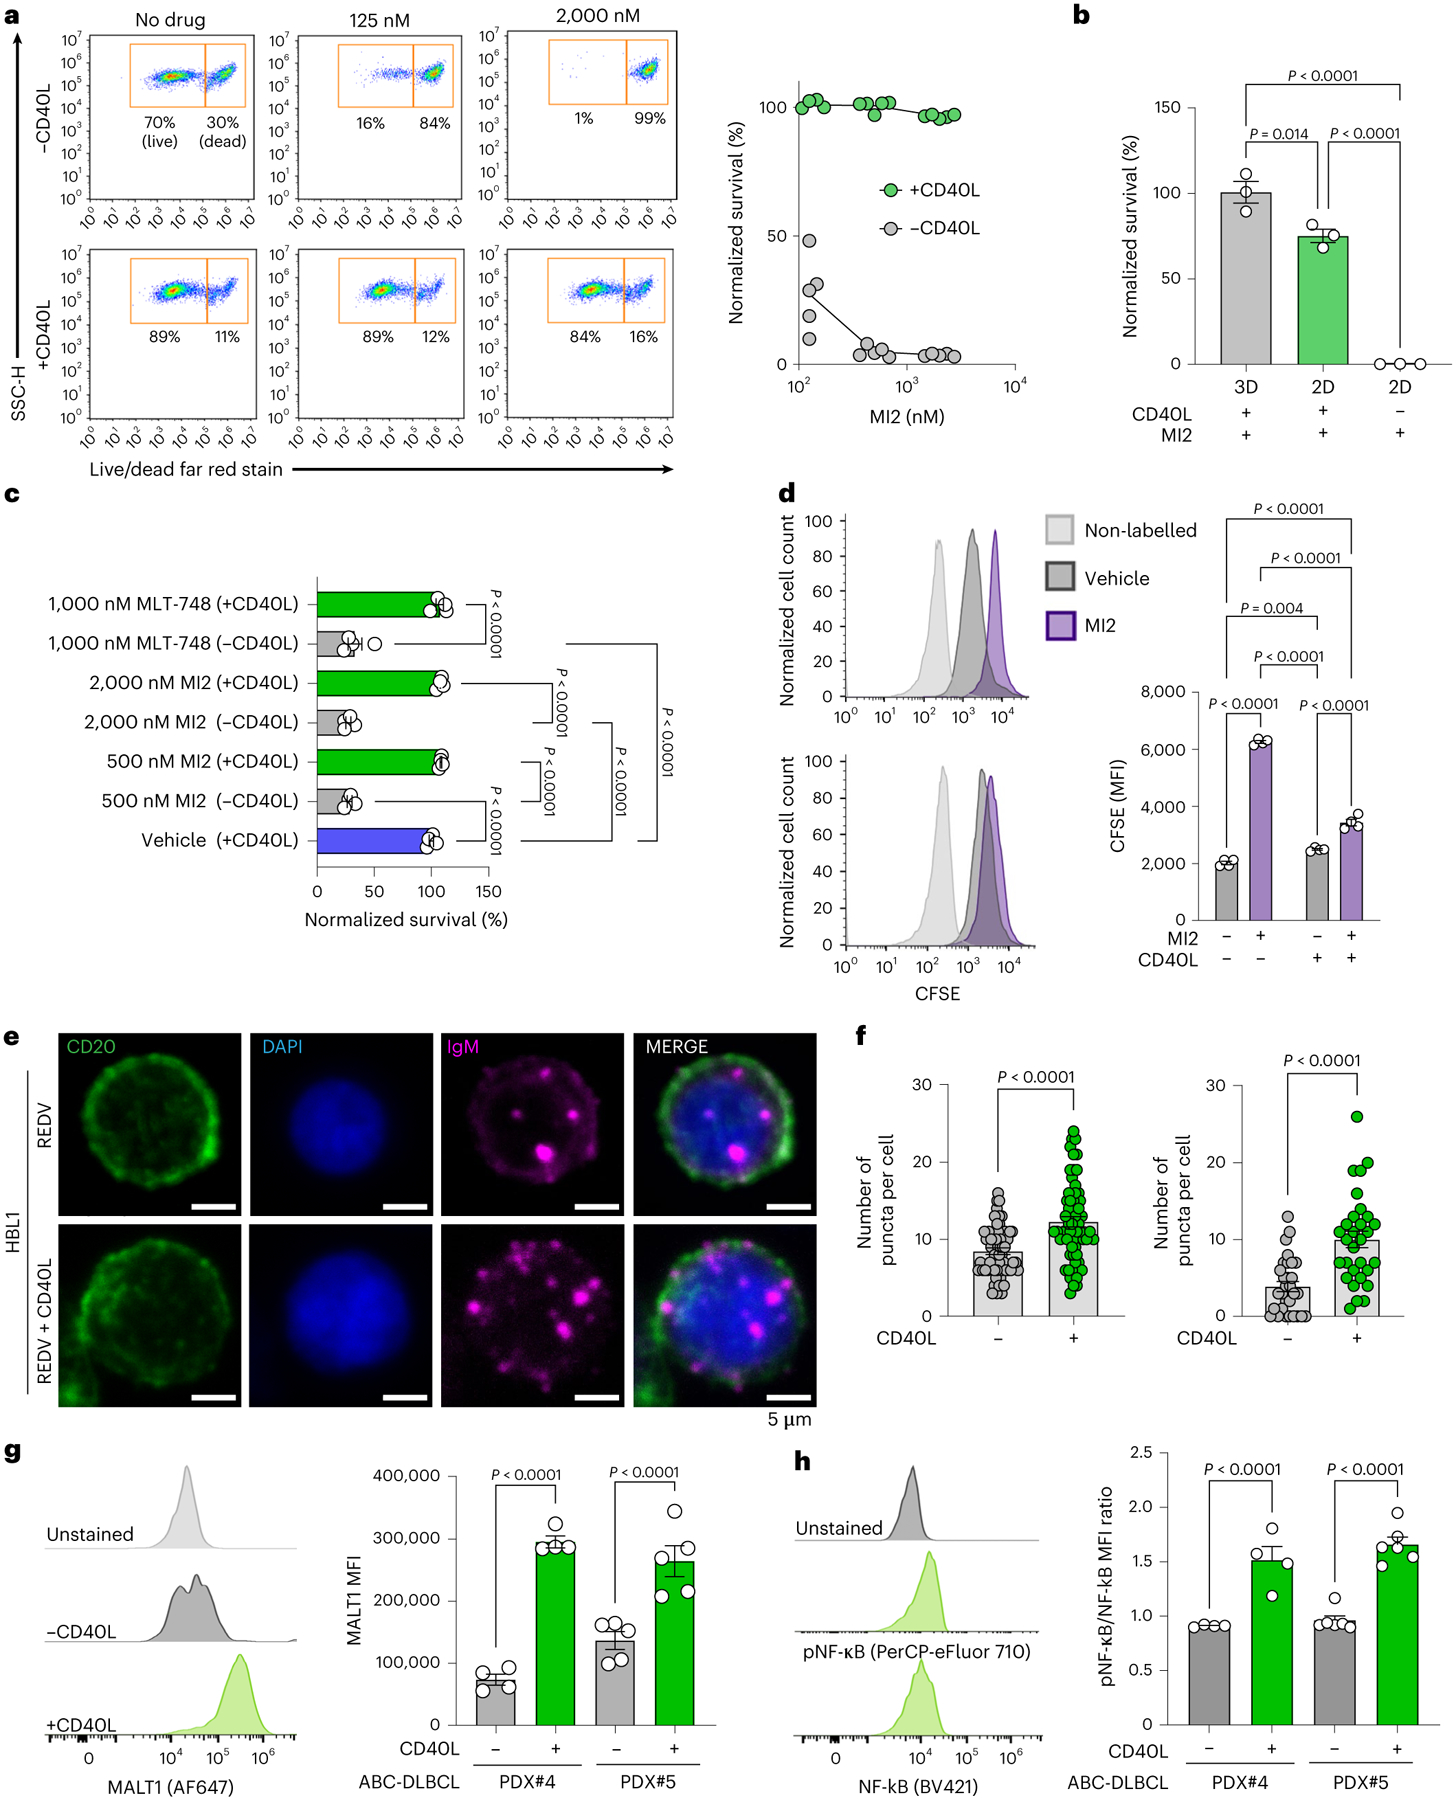
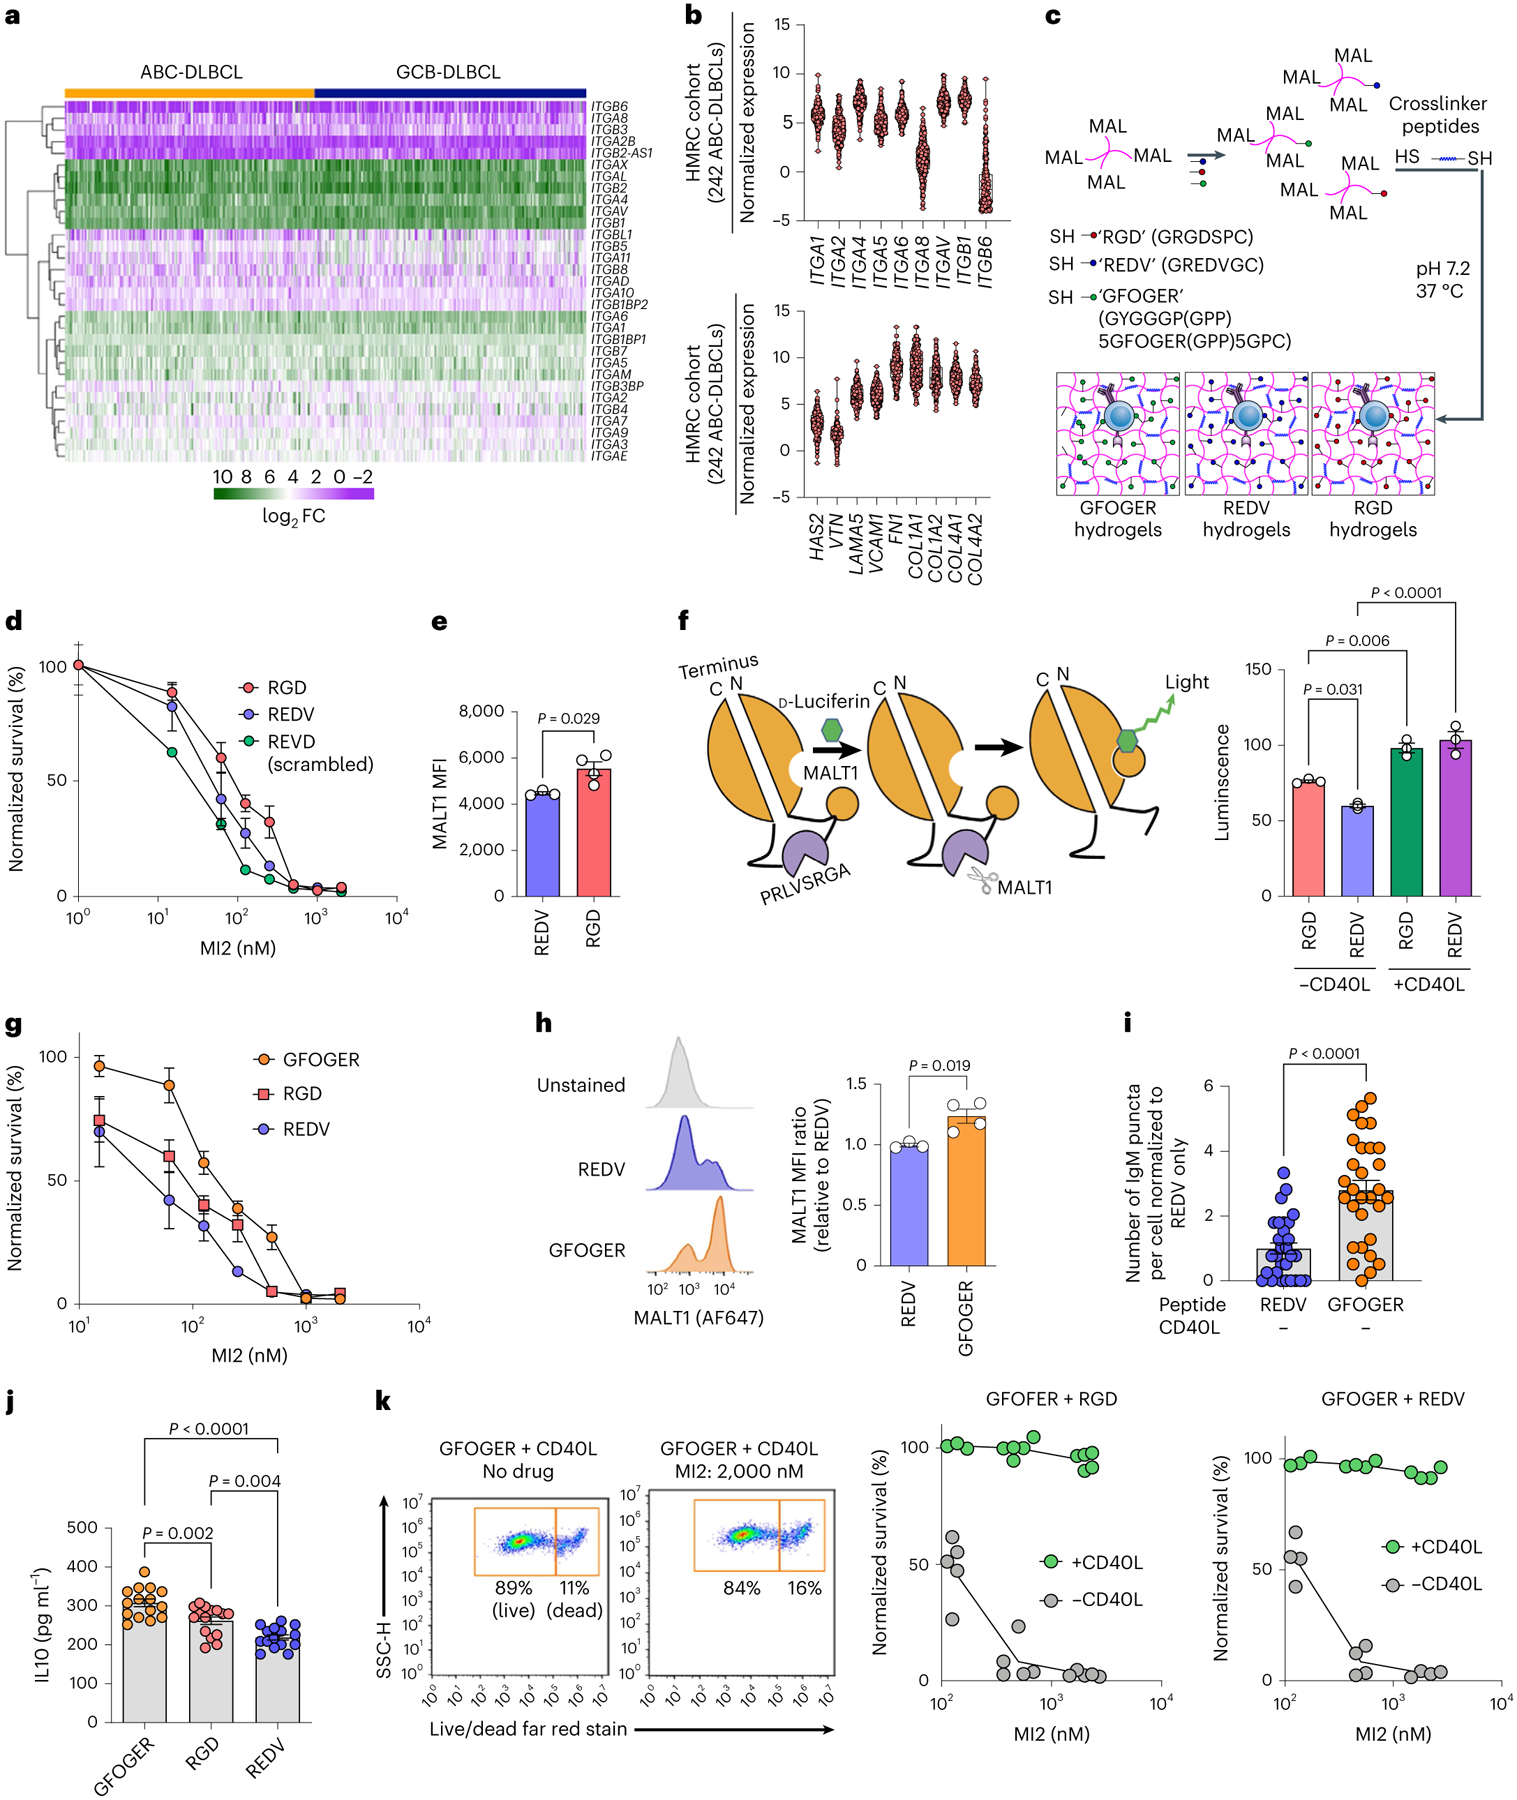
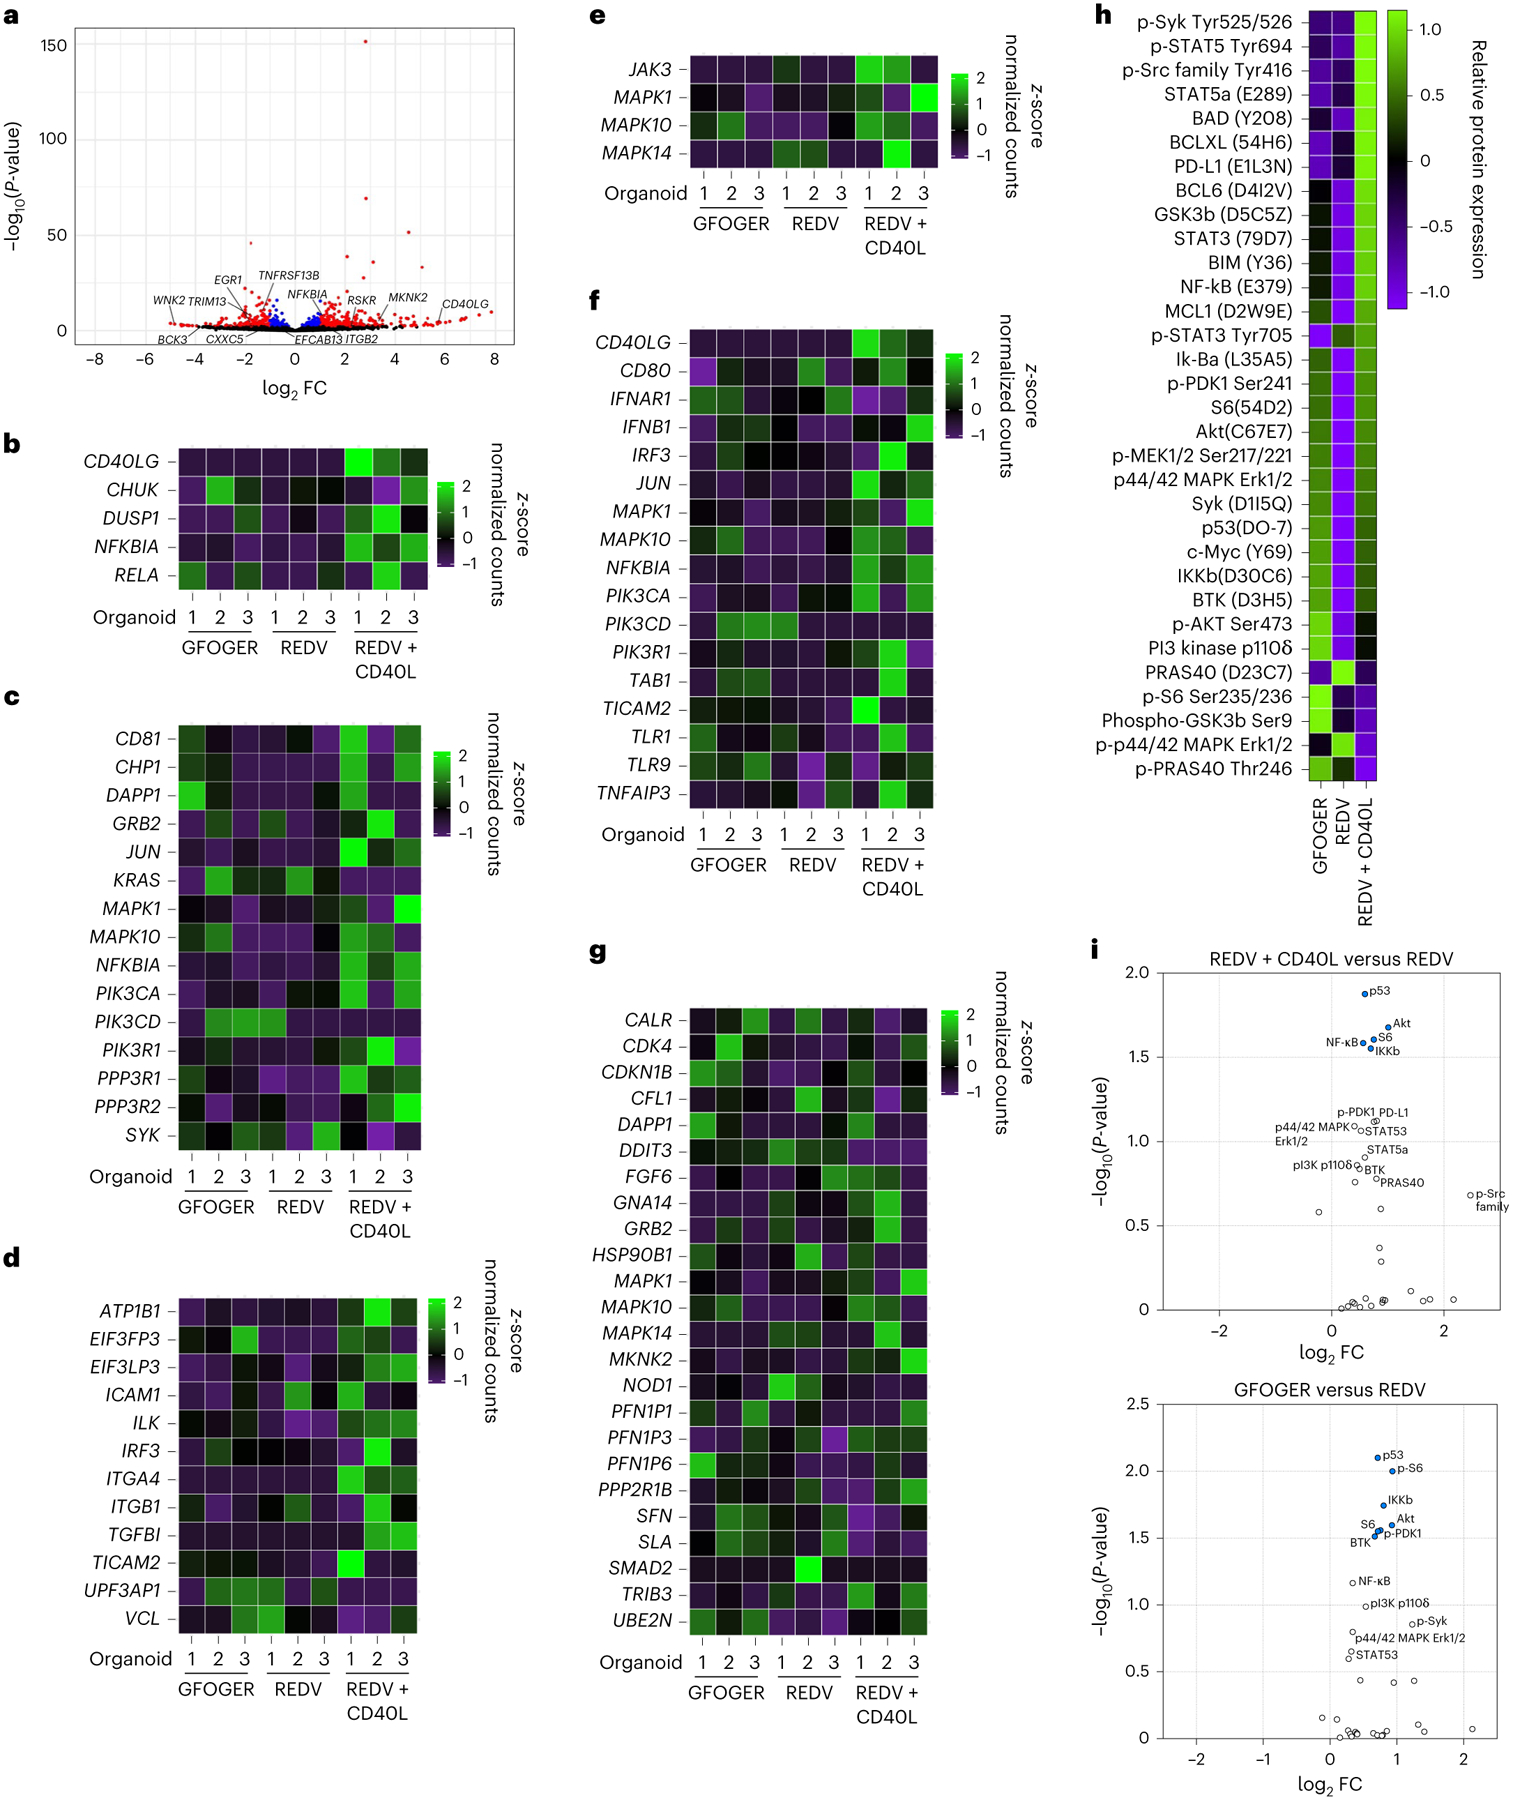
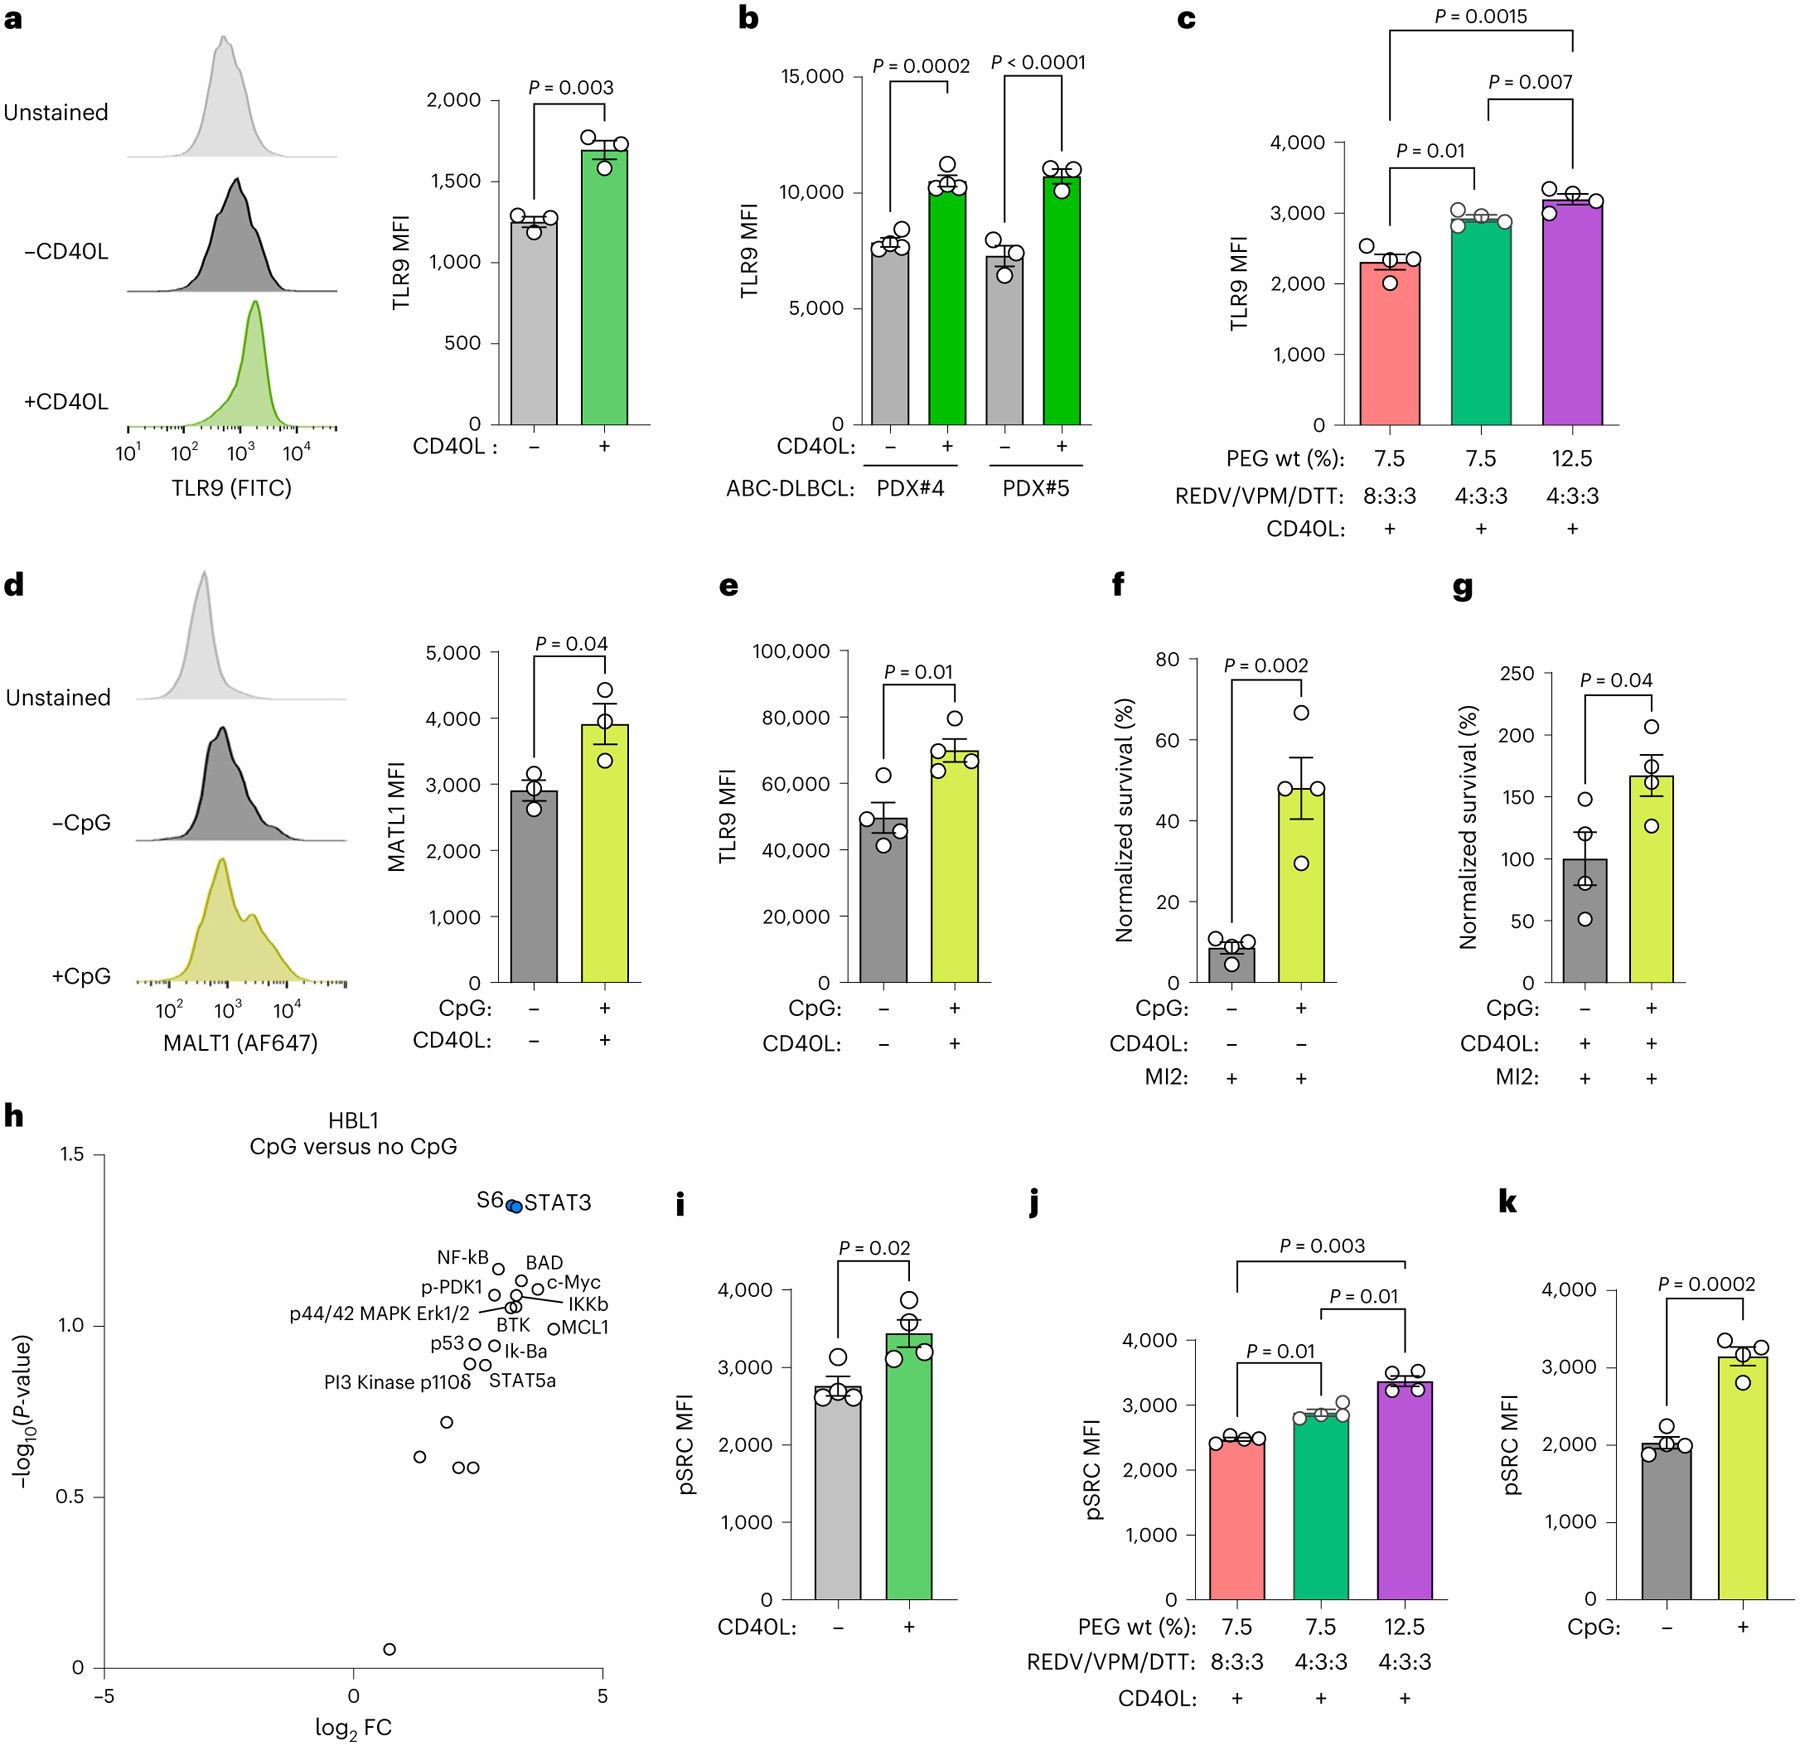
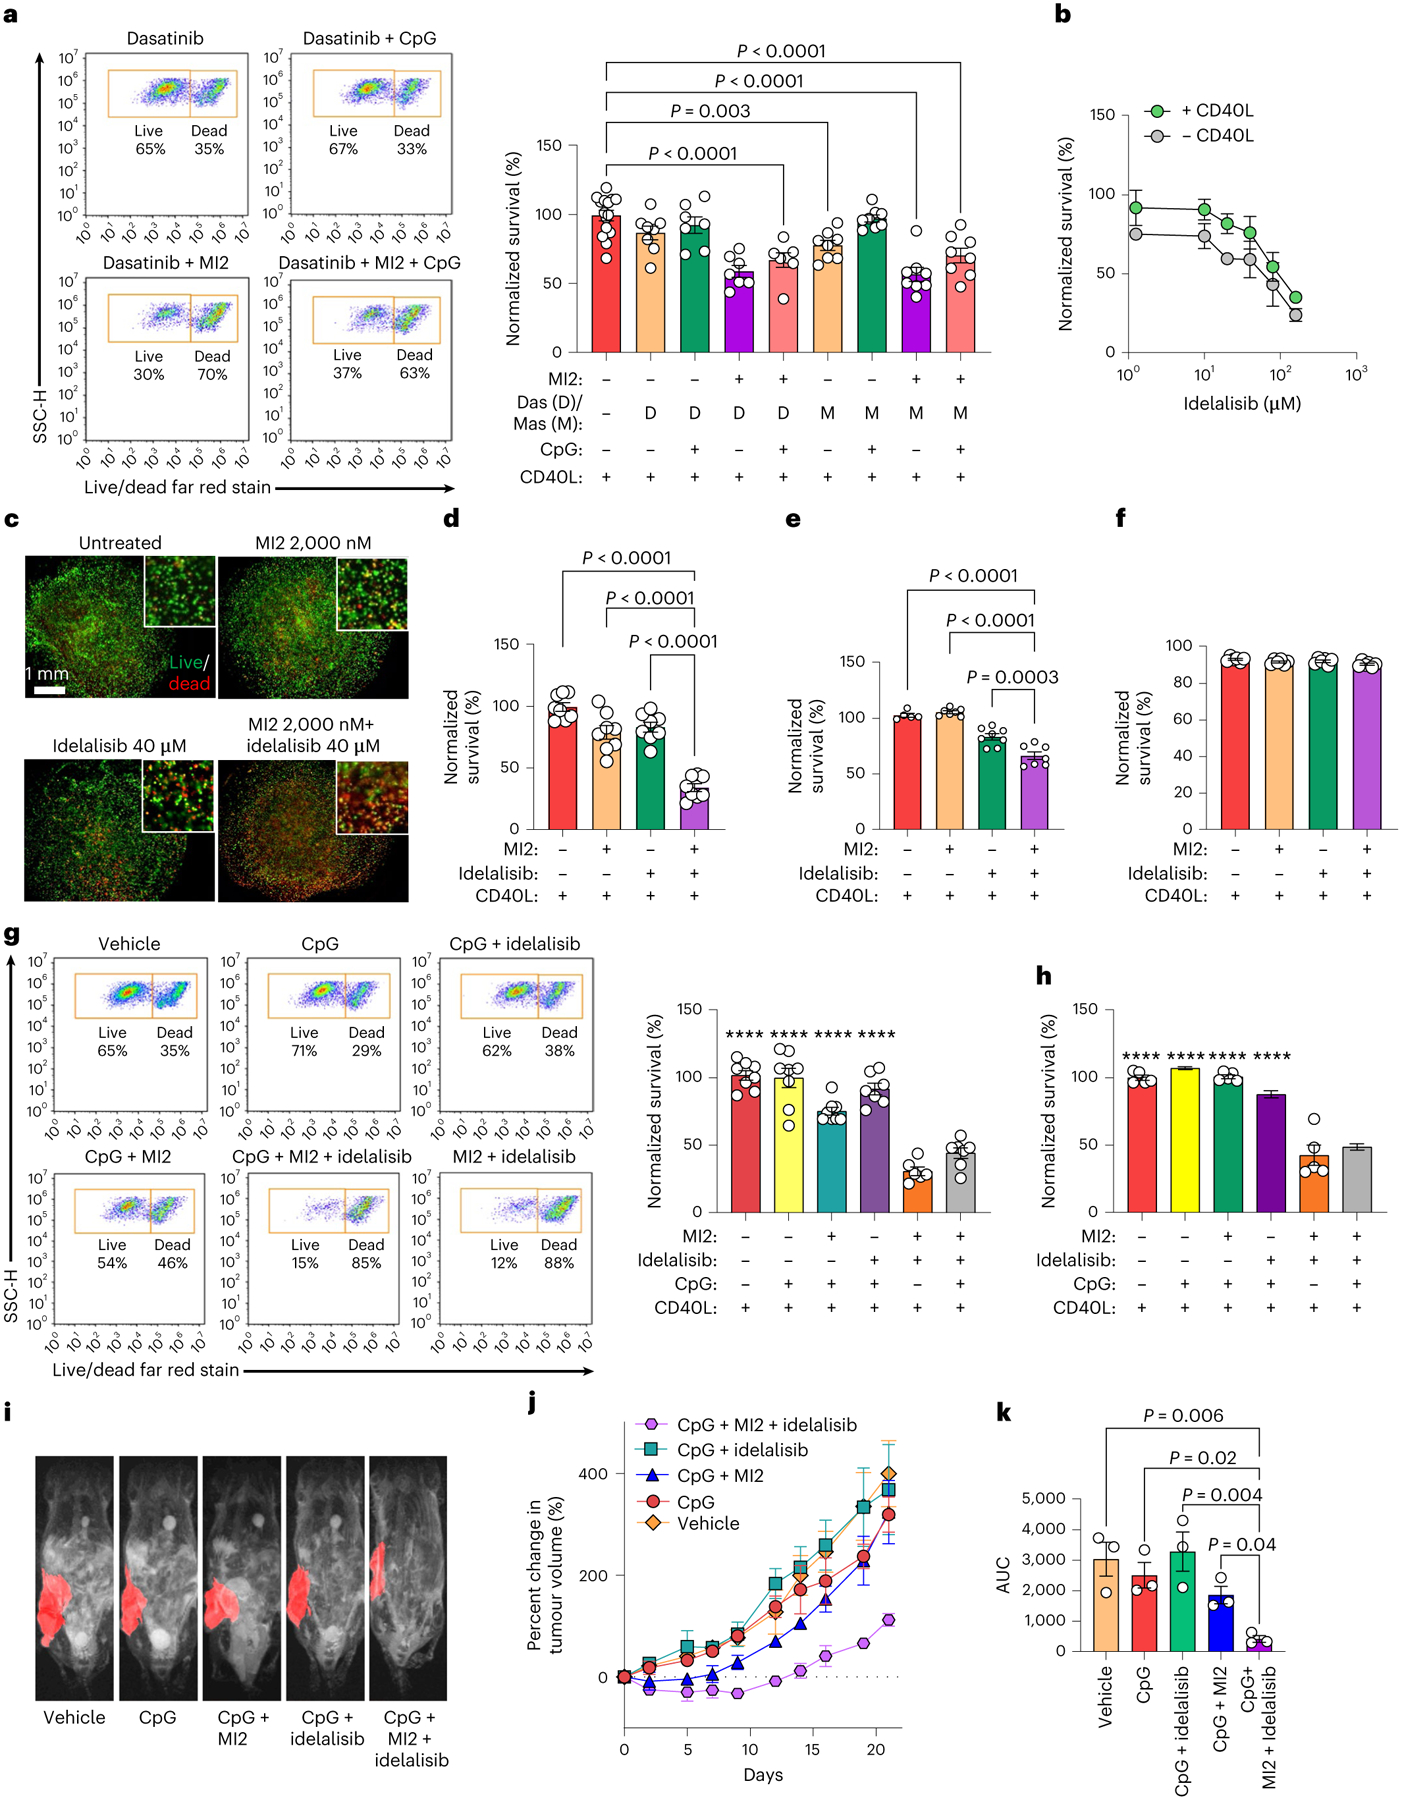
Activated B-cell-like diffuse large B-cell lymphomas (ABC-DLBCLs) are characterized by constitutive activation of nuclear factor κB driven by the B-cell receptor (BCR) and Toll-like receptor (TLR) pathways. However, BCR-pathway-targeted therapies have limited impact on DLBCLs. Here we used >1,100 DLBCL patient samples to determine immune and extracellular matrix cues in the lymphoid tumour microenvironment (Ly-TME) and built representative synthetic-hydrogel-based B-cell-lymphoma organoids accordingly. We demonstrate that Ly-TME cellular and biophysical factors amplify the BCR-MYD88-TLR9 multiprotein supercomplex and induce cooperative signalling pathways in ABC-DLBCL cells, which reduce the efficacy of compounds targeting the BCR pathway members Bruton tyrosine kinase and mucosa-associated lymphoid tissue lymphoma translocation protein 1 (MALT1). Combinatorial inhibition of multiple aberrant signalling pathways induced higher antitumour efficacy in lymphoid organoids and implanted ABC-DLBCL patient tumours in vivo. Our studies define the complex crosstalk between malignant ABC-DLBCL cells and Ly-TME, and provide rational combinatorial therapies that rescue Ly-TME-mediated attenuation of treatment response to MALT1 inhibitors.


Conflict of interest statement

A.S. received research support from 3M. A.M. receives research support from Janssen Pharmaceuticals and serves as a consultant to Epizyme and Constellation. L.F. is currently an employee of Janssen Research & Development, LLC. The other authors declare no competing interests.

Figures

Extended Data Fig. 1 |
Extended Data Fig. 1 |. Hydrogel functionality modulates the survival of B cell lymphomas.
Left: Flow cytometry gating. Right: Percent and count of live CD19 + WEHI B cell lymphoma cells cultured in hydrogels with PEG-4MAL, PEG-4VS, and PEG-4ACR functionalities after 48 h of culture. One-way ANOVA with Tukey’s multiple-comparison test (mean ± s.e.m., n = 5, where each dot represents a hydrogel).
Extended Data Fig. 2 |
Extended Data Fig. 2 |. Characterization of hydrogel-based organoid cultures.
a, Loss modulus of hydrogels with and without cells for different macromer densities. Two-way ANOVA with Tukey’s multiple-comparison test (mean ± s.e.m., n = 5). b, Expression of CD40L on mitomycin-treated CD40L-stromal cells over 4 days of hydrogel culture. Two-tailed unpaired t-test (mean ± s.e.m., n = 5). c, Percentage of Ki67 + HBL1 and OCI-LY10 grown for 7 days in REDV, REDV + CD40L, or REVD-functionalized organoids. One-way ANOVA with Tukey’s multiple-comparison test (mean ± s.e.m., n = 5). d-e, Long-term passaging. (d) Flow cytometry tracked viability at each passage (mean ± s.e.m., n = 4). (e) Left: pBTK histogram at passages 2, 3, 4, 5, and 10 gated for live cells. Right: pBTK MFI value at passages 2, 3, 4, 5, and 10. Organoids passaged after 96 h of culture. One-way ANOVA with Tukey’s multiple-comparison test (mean ± s.e.m., n = 4). Each dot in a–e represents a hydrogel-based organoid.
Extended Data Fig. 3 |
Extended Data Fig. 3 |. T cell signal attenuates the therapeutic response to MALT1 inhibition in human and canine ABC-DLBCLs.
a, Survival (normalized to vehicle-treated) of human ABC-DLBCL PDXs cultured in organoids with and without CD40L after 48-h culture, followed by 48-h treatment with 500 or 2000 nM MI2 treatment or 1000 nM MLT-748 MALT1 inhibitor compound. One-way ANOVA with Tukey’s multiple-comparison test (mean ± s.e.m., n = 4, PDX#4; n = 5, PDX#5, where each dot is a hydrogel-based organoid). b-c, Survival (normalized to vehicle-treated) human ABC-DLBCL PDX cells cultured in organoids with and without CD40L after 48-h culture, followed by 48-h treatment with MALT1 inhibitor MI2 at 500 nM (b) and 2000 nM (c) treatment. One-way ANOVA with Tukey’s multiple-comparison test (b) and two-tailed unpaired t-test (c), (mean ± s.e.m., n = 3 for (b), n = 5 for (c), where each dot is a hydrogel-based organoid). d, Survival (normalized to vehicle-treated) of HBL1 cells cultured in organoids with baseline stromal cell and CD40L-transduced stromal cell after 48-h culture, followed by 48-h treatment with 500 nM MI2 treatment. Two-tailed unpaired t-test (mean ± s.e.m., n = 7). e, Survival (normalized to vehicle-treated) of canine PDX cells cultured in organoids with and without CD40L-stromal cells after 48-h culture, followed by 48-h treatment with 2000 nM MI2 treatment. Two-tailed unpaired t-test (mean ± s.e.m., n = 5 for -CD40L and n = 6 for +CD40L).
Extended Data Fig. 4 |
Extended Data Fig. 4 |. Characterization of hydrogel-based organoids.
a, BCR (magenta) puncta expression at the single-cell level on CD20 (green) expressing OCI-LY10 in the presence or absence of CD40L-stromal cells, with DAPI (blue). Data representative of n = 5 hydrogels for each condition. b, Median fluorescent intensity (MFI) of MALT1 in human ABC-DLBCL PDX cells cultured in ±CD40L-stromal cell conditions for 96 h. Two-tailed unpaired t-test between two groups within a cell line (mean ± s.e.m., n = 3, where each dot is a hydrogel-based organoid). c, MFI of MALT1 in human ABC-DLBCL cell lines cultured in ±CD40L-stromal cell conditions for 96 h. Two-tailed unpaired t-test between two groups within a cell line (mean ± s.e.m., n = 4, where each dot is a hydrogel-based organoid).
Extended Data Fig. 5 |
Extended Data Fig. 5 |. Expression of BCR pathway proteins in ABC-DLBCL organoids.
a, Left: Representative flow cytometry histograms. Right: Median fluorescent intensity (MFI) of BCL10 in human PDX cells cultured in ±CD40L-stromal cell conditions for 96 h. Two-tailed unpaired t-test (mean ± s.e.m., n = 4 for PDX#4; n = 5 for PDX#5; where each dot is a hydrogel-based organoid). b, MFI of BCL10 in human ABC-DLBCL PDX cells cultured in ±CD40L-stromal cell conditions for 96 h. Two-tailed unpaired t-test between two groups within a cell line (mean ± s.e.m., n = 3, where each dot is a hydrogel-based organoid). c, Ratio of MFI of pNF-κB/NF-κB in human ABC-DLBCL PDX cells cultured in ±CD40L-stromal cell conditions for 96 h. Two-tailed unpaired t-test (mean ± s.e.m., n = 5 for PDX#2). d, CD40 (green) spatial localization relative to IgM BCR (magenta) puncta in HBL1 ABC-DLBCLs grown in REDV-functionalized hydrogels in the presence of CD40L-stromal cells. Left: 3D projection of IgM BCR, DAPI (blue), and CD40. Right: Orthogonal projection with IgM BCR, DAPI, and actin (orange). Data representative of n = 3 organoids. e, 3D projection of spatial expression of TRAF3 (green) in HBL1 ABC-DLBCLs grown in REDV-functionalized hydrogels in the presence or absence of CD40L-stromal cells, with DAPI (blue) and actin (magenta). Data representative of n = 3 organoids.
Extended Data Fig. 6 |
Extended Data Fig. 6 |. Single-cell MALT1 fluorescent intensity and protein count.
a, Distribution of fluorescent intensity of HBL1 cells from six separate organoids for MALT1 after 48 h of culture in indicated conditions and subsequent 48 h of MI2 treatment. Total number of cells is indicated in red. Organoids without (left) and with CD40L-stromal cells (right) were respectively treated with 250 nM and 2000 nM MI2. b, Distribution of fluorescent intensity of ABC-DLBCL PDXs from six separate organoids for MALT1 after 48 h of culture in indicated conditions and subsequent 48 h of MI2 treatment. Organoids without and with CD40L-stromal cells were respectively treated with 2000 nM MI2. c, Protein expression of the six highest expressed proteins, from NanoString analysis in Fig. 4, in cells cultured in GFOGER-functionalized organoids and REDV-functionalized organoids with CD40L-stromal cells. Results indicate mean ± s.e.m. of two replicates, with each replicate including at least 60 organoids.
Extended Data Fig. 7 |
Extended Data Fig. 7 |. CD40L, ECM, and hydrogel stiffness regulate TLR9 and pSRC expression in PDX organoids.
a, Gene expression of MYD88 in ABC-DLBCL (n = 242) and GCB-DLBCL (n = 264) patients from the HMRC cohort. Data were quantile normalized and log2 transformed. Two-tailed unpaired t-test. b, Pearson’s correlations for the genes of interest in the ABC-DLBCL (n = 242) samples. c, TLR9 median fluorescent intensity (MFI) for OCI-LY10 and OCI-LY3 cells cultured in ± CD40L-stromal cells conditions for 96 h. One-way ANOVA with Tukey’s multiple-comparison test (mean ± s.e.m., n = 3). d, TLR9 MFI for human ABC-DLBCL HBL1 cells cultured in REDV or GFOGER-functionalized organoids without CD40L-stromal cells for 96 h. Two-tailed unpaired t-test (mean ± s.e.m., n = 4). e, Effect of stiffness, modulated by indicated PEG-4MAL macromer densities (w/v%) at 4:3:3 REDV to VPM and DTT crosslinkers, on TLR9 in human PDX cells after 96-h culture Two-tailed unpaired t-test (mean ± s.e.m., n = 5) f, TLR9 MFI for human ABC-DLBCL cells cultured in REDV-presenting hydrogels for 96 h with different cell seeding density. In indicated groups (red), MI2 was added at 2000 nM for the last 48 h of culture. Two-tailed unpaired t-test for each cell line (mean ± s.e.m., n = 5). g-h, Effect of 1 μM CpG addition on MALT1 (g) and TLR9 (h) expression in cells cultured in REDV-functionalized hydrogel-based organoids for 96 h. One-way ANOVA with Tukey’s multiple-comparison test (mean ± s.e.m., n = 3). i, Survival (normalized to vehicle-treated) of OCI-LY10 and OCI-LY3 cells cultured in REDV-functionalized hydrogel-based organoids without and with 1 μM CpG for 96 h, including 48 h of 2000 nM MI2 treatment. Two-tailed unpaired t-test (mean ± s.e.m., n = 3). j, Protein expression of the six highest expressed proteins measured via NanoString nCounter SPRINT Profiler in HBL1 cells after 96-h culture in REDV-functionalized organoids with 1 μM CpG. mean ± s.e.m., n = 3 replicates each representing 60 organoids.
Extended Data Fig. 8 |
Extended Data Fig. 8 |. pSRC median fluorescent intensity for human ABC-DLBCL cell lines and PDX cells cultured in indicated conditions for 96 h.
a, pSRC median fluorescent intensity (MFI) in HBL1 (n = 7), OCI-LY3 (n = 4), and OCI-LY10 (n = 4) cell lines grown in REDV-functionalized hydrogel-based organoids with or without CD40L-expressing stromal cells. Two-tailed unpaired t-test (mean ± s.e.m.), where each dot is a hydrogel-based organoid. b, pSRC MFI in human ABC-DLBCL PDX cells grown in REDV-functionalized hydrogel-based organoids with CD40L-expressing stromal cells at different hydrogel polymer densities (stiffnesses). Two-tailed unpaired t-test (mean ± s.e.m., n = 3, where each dot is a hydrogel-based organoid). c, Effect of 1 μM CpG addition on pSRC MFI in OCI-LY3 and OCI-LY10 cells cultured for 96 h. Two-tailed unpaired t-test (mean ± s.e.m., n = 3, where each dot is a hydrogel-based organoid).
Extended Data Fig. 9 |
Extended Data Fig. 9 |. Combinatorial treatment with cooperative signalling pathway inhibitors rescues MALT1 inhibitors in organoids.
a, Survival (normalized to vehicle-treated) of canine PDX cells cultured with CD40L-stromal cells in REDV-functionalized organoids for 96 h, with 48 h of treatment with vehicle, 2000 nM MI2, 1 μM idelalisib, or both drugs. One-way ANOVA with Dunnett’s multiple-comparison test against the idelalisib+MI2 group (mean ± s.e.m., n = 5, where each dot is a hydrogel-based organoid). b, Representative flow cytometry gating depicting survival of GCB-DLBCL OCI-LY7 cells cultured with CD40L-stromal cells in REDV-functionalized organoids for 96 h, with 48 h of treatment with vehicle, 2000 nM MI2, idelalisib, or both MI2 and idelalisib. Cells were treated with 40 μM idelalisib. Representative of n = 6 hydrogel-based organoid). c, Survival (normalized to vehicle-treated) of OCI-LY10 cells and OCI-LY3 cells after 96-h culture in REDV-functionalized organoids with CD40L-stromal cells, where + /− indicate 48-h 2000 nM MI2 treatment, 48-h 40 μM idelalisib treatment, and/or 96-h 1 μM CpG treatment. One-way ANOVA with Dunnett’s multiple-comparison test with reference to combination MI2 and idelalisib treated culture (orange), (mean ± s.e.m., n = 3, where each dot is a hydrogel-based organoid).
Extended Data Fig. 10 |
Extended Data Fig. 10 |. Ly-TME attenuates BTK inhibitor response and combinatorial treatment with cooperative signalling pathway inhibitors rescues BTK inhibitor response.
a, Survival (normalized to vehicle-treated) of HBL1 cells cultured in indicated conditions after 48 h of culture and subsequent 48 h of treatment with increasing concentration of BTK inhibitor, ibrutinib. Results indicate the mean ± s.e.m. of six replicates. b, Median fluorescent intensity of pBTK in HBL1 cells cultured in either REDV-(blue) or GFOGER (orange)-functionalized organoids for 96 h. Two-tailed unpaired t-test (mean ± s.e.m., n = 3). c, Median fluorescent intensity of pBTK in HBL1 cells cultured in REDV-functionalized hydrogels-based organoids with or without CD40L expressing stromal cells, for 96 h. Two-tailed unpaired t-test (mean ± s.e.m., n = 3). d, Ratio of median fluorescent intensity (right) of pBTK/BTK in human PDX cells cultured in ±CD40L-stromal cell conditions for 96 h. Two-tailed unpaired t-test (mean ± s.e.m., n = 4 for PDX#4; n = 5 for PDX#5). e, Survival (normalized to vehicle-treated) for HBL1 (left) and OCI-LY10 (right) cells after 96-h culture in REDV-functionalized organoids with CD40L-stromal cells, treated for 48-h with 1000 nM BTK inhibitor ibrutinib and 40 μM PI3K inhibitor idelalisib. One-way ANOVA with Tukey’s multiple-comparison test (mean ± s.e.m., n = 8 treatment group, n = 16 vehicle group). f, Survival (normalized to vehicle-treated) for HBL1 (left) and OCI-LY10 (right) cells after 96-h culture in REDV-functionalized organoids with CD40L-stromal cells, treated for 48-h with 1000 nM ibrutinib and 40 μM idelalisib, and/or treated with 1 μM CpG for 96-h. One-way ANOVA with Tukey’s multiple-comparison test (mean ± s.e.m., n = 7 treatment group, n = 16 vehicle group).
Fig. 1 |
Fig. 1 |. CD4 T-cell abundance in ABC-DLBCLs and development of bioengineered lymphoma organoids.
a, Immunohistochemistry of CD4+ T cells (brown) in ABC-DLBCL patient tissue biopsy. b, Violin plot of CD4+ cell percentage in ABC-DLBCL (n = 96) and GCB-DLBCL (n = 163) patient tissue biopsies. Two-tailed unpaired t-test. c,d, Gene expression of CD40L (c) and CD40 (d) in ABC-DLBCL (n = 242) and GCB-DLBCL (n = 264) patients from the HMRC cohort. Data were quantile normalized and log2 transformed. Two-tailed unpaired t-test. e, Immunofluorescence of an ABC-DLBCL tumour biopsy for CD4 (green), CD20 (magenta), CD40 (cyan) and TRAF3 (yellow). Images are representative of n = 5 primary tumour biopsies. f, Violin plot of single-cell mean expression of CD4, CD20 and CD40 for TRAF3+ cells for n = 5 primary tumour biopsies from ABC-DLBCL patients. One-way ANOVA with Tukey’s multiple comparison test. g, Immunofluorescence of an ABC-DLBCL tumour biopsy for CD4 (green), CD20 (magenta), CD40L (yellow) and DAPI (white). Images represent n = 5 primary tumour biopsies from ABC-DLBCL patients. h, Schematic of PEG-4MAL-hydrogel-based organoids with protease-degradable crosslinkers (spring) functionalized with adhesive peptides (blue). Hydrogels encapsulated lymphoma cells (blue) and stromal cells (purple). i, Distribution of gene expression of MMPs in primary human ABC-DLBCL (n = 242) and GCB-DLBCL (n = 264) samples from the HMRC cohort. Data represent mean ± s.e.m. and colour-coded MMPs are upregulated, with ABC-DLBCL in blue and GCB-DLBCL in orange. j, Storage modulus of hydrogels for different polymer densities. Two-way ANOVA with Tukey’s multiple comparison test. Data represent mean ± s.e.m., n = 5, where each dot represents a hydrogel. k, Left: immunofluorescence of an ABC-DLBCL tumor biopsy for CD4 (green), CD20 (magenta) and DAPI (blue). Images represent n = 5 primary tumor biopsies from ABC-DLBCL patients. Right: confocal microscopy maximum intensity projection of PEG-4MAL-hydrogel-based organoids with ABC-DLBCL cell line HBL1 (CD20, green), BCR (IgM, magenta) and nucleus (DAPI, blue). Images are representative of n = 3 organoids.
Fig. 2 |
Fig. 2 |. T-cell signal amplifies BCR pathway and attenuates the therapeutic response to MALT1 inhibition in ABC-DLBCLs.
a, Left: flow cytometry gating of side scatter pulse height (SSC-H) versus live/dead. Right: survival (normalized to vehicle-treated) of ABC-DLBCL HBL1 cells cultured with or without CD40L-stromal cells after 48 h of culture and subsequent 48 h of treatment with increasing concentration of MALT1 inhibitor MI2 (n = 5). b, Survival (normalized to vehicle-treated) of human ABC-DLBCL HBL1 cells cultured in organoids or 2D with and without CD40L after 48 h culture, followed by 48 h treatment with 2,000 nM MALT1 inhibitor MI2. Two-tailed unpaired t-test (mean ± s.e.m., n = 3). c, Survival (normalized to vehicle-treated) of human ABC-DLBCL PDX#4 cultured in organoids with and without CD40L-expressing cells after 48 h culture, followed by 48 h treatment with 500 or 2,000 nM MI2 or 1,000 nM MLT-748. One-way ANOVA with Tukey’s multiple-comparison test (mean ± s.e.m., n = 4, PDX#4; n = 5, PDX#5). d, Proliferation after prelabelling cells with CFSE and subsequent 48 h culture, followed by 48 h treatment with 2,000 nM MI2. Left: flow cytometry histograms: HBL (top); HBL1 + CD40L (bottom). Right: quantification of CFSE for each culture condition. Two-tailed unpaired t-test (mean ± s.e.m., n = 4). MFI, median fluorescent intensity. e, BCR (magenta) puncta expression at the single-cell level on CD20 (green) expressing HBL1 in the presence or absence of CD40L-stromal cells, with DAPI (blue). Image representative of n = 5 hydrogels per condition. f, Number of BCR puncta per cell of ABC-DLBCL OCI-LY10 (left) and ABC-DLBCL HBL1 (right) cells cultured in ±CD40L-stromal cell conditions for 96 h. Two-tailed unpaired t-test (n = 5 hydrogels per cell line with 6 cells analysed per hydrogel for HBL1 and 12 cells analysed per hydrogel for OCI-LY10). g, Left: flow cytometry histograms. Right: MFI of MALT1 in human ABC-DLBCL PDX cells cultured in ±CD40L-stromal cell conditions for 96 h. Two-tailed unpaired t-test (mean ± s.e.m., n = 4 for PDX#4; n = 5 for PDX#5). h, Left: flow cytometry histograms. Right: ratio of MFI of pNF-κB/NF-κB in human ABC-DLBCL PDX cells cultured in ±CD40L-stromal cell conditions for 96 h. Two-tailed unpaired t-test (mean ± s.e.m., n = 4 for PDX#4; n = 5 for PDX#5). Each dot in ad, g and h represents a hydrogel-based organoid.
Fig. 3 |
Fig. 3 |. Integrin-binding ligands modulate MALT1 expression, activity and inhibition.
a,b, Heatmap (a) of integrin genes and violin plot (b) of integrin α and β subunits (top) and ECM (bottom) in human ABC-DLBCL (n = 242) and GCB-DLBCL (n = 264) patient tumours from the HMRC cohort. c, Schematic of PEG-4MAL-hydrogel-based organoids with protease-degradable crosslinkers functionalized with adhesive peptides RGD, REDV and GFOGER. d, Survival (normalized to vehicle-treated) of HBL1 cultured in either RGD (red) or REDV (blue) or scrambled REVD (green) peptide-functionalized hydrogels after 48 h of culture and subsequent 48 h of treatment with MALT1 inhibitor, MI2 (mean ± s.e.m., each dot is an average of n = 5 hydrogel-based organoids). e, MFI of MALT1 in HBL1 cells cultured in either RGD-functionalized (red) or REDV-functionalized (blue) hydrogel-based organoids for 96 h. Two-tailed unpaired t-test (mean ± s.e.m., n = 4). f, Left: schematic of MALT1-GloSensor reporter assay; right: MALT1 activity normalized to cell number after 96 h of culture in indicated conditions. One-way ANOVA with Tukey’s multiple-comparison test (mean ± s.e.m., n = 3). g, Survival (normalized to vehicle-treated) of HBL1 cells cultured in collagen-mimicking GFOGER-functionalized hydrogels compared with other peptides. The organoids were cultured for 48 h and underwent a subsequent 48 h of treatment with MI2 (means ± s.e.m., each dot is an average of n = 5 hydrogels). h, Representative flow cytometry histograms (left) and MFI of MALT1 (right) in HBL1 cells cultured under the indicated conditions for 96 h. Two-tailed unpaired t-test (mean ± s.e.m., n = 3 REDV; n = 4 GFOGER). i, Number of BCR puncta per cell (normalized to REDV-functionalized hydrogels) of HBL1 cells cultured in hydrogels. Two-tailed unpaired t-test (mean ± s.e.m., n = 5 hydrogels per cell line with six cells analysed from each hydrogel). j, IL10 secreted from HBL1 cells cultured under the indicated conditions for 96 h. One-way ANOVA with Tukey’s multiple-comparison test (mean ± s.e.m., n = 4). k, Gating schematic (left panels) and survival (normalized to vehicle-treated) (right panels) of HBL1 cells cultured in either GFOGER + RGD or GFOGER + REDV functionalized hydrogels (with or without CD40L-stromal cells) after 48 h of culture and a subsequent 48 h of MI2 treatment (mean ± s.e.m., n = 5 GFOGER + RGD and n = 4 GFOGER + REDV). Each dot in e, f, h and j represents a hydrogel-based organoid.
Fig. 4 |
Fig. 4 |. Microenvironment conditions that facilitate MALT1 inhibitor resistance enhance multiple signalling pathways.
a, Volcano plot of statistical significance versus FC for genes from cells cultured in REDV-functionalized organoids with or without CD40L-stromal cells. Differential expressions with P < 0.05 are highlighted in blue and those with P < 0.05 and |log2 FC > 1| are shown in red. Results displayed in the volcano plot were calculated using the R package DESeq2 v.1.36.0, with the function DESeq() and the Wald test. No corrections to P-values were performed. bg, Heatmaps displaying relative gene expression for various pathways CD40 (b), BCR (c), adhesion (d), STAT3 (e), TLR (f) and PI3k/AKT/mTOR (g), and measured by RNA sequencing, comparing HBL1 cells cultured in GFOGER-functionalized organoids, REDV-functionalized organoids or REDV-functionalized organoids with CD40L-stromal cells. Results indicate three replicates, with each replicate including cells pooled from ten hydrogel-based organoids. h, Heatmap displaying relative protein expression measured via NanoString nCounter SPRINT Profiler comparing HBL1 cells cultured in GFOGER-functionalized organoids, REDV-functionalized organoids or REDV-functionalized organoids with CD40L-stromal cells. Results indicate two replicates, with each replicate including at least 60 organoids. i, Volcano plot of statistical significance versus FC for proteins from cells cultured in REDV-functionalized organoids with CD40L-stromal cells (top) or GFOGER-functionalized organoids (bottom) in comparison to REDV-functionalized organoids without CD40L. Results indicate two replicates, with each replicate including at least 60 organoids. Statistical analysis involved NanoString’s Wald test, negative binomial generalized linear model, or log-linear model following the NanoString differential expression algorithm. Differentially expressed proteins with P < 0.05 are highlighted in blue.
Fig. 5 |
Fig. 5 |. CD40L, ECM and hydrogel stiffness regulate TLR9 and pSRC expression in PDX organoids.
a, Representative flow cytometry histograms (left) and TLR9 MFI (right) for HBL1 cells cultured in ±CD40L-stromal cells conditions for 96 h. Two-tailed unpaired t-test (mean ± s.e.m., n = 3). b, TLR9 MFI for human ABC-DLBCL PDX cells cultured in ±CD40L-stromal cells conditions for 96 h. Two-tailed unpaired t-test (mean ± s.e.m., n = 4 PDX#4; n = 3 PDX#5). c, Effect of stiffness, modulated by indicated PEG-4MAL weight percent and the ratio of REDV to VPM and DTT crosslinkers, on TLR9 median fluorescent intensity of human ABC-DLBCL PDX#2 cells after 96 h culture. One-way ANOVA with Tukey’s multiple-comparison test (mean ± s.e.m., n = 4). d, Effect of 1 μM CpG addition on MALT1 expression in HBL1 cells cultured in REDV-functionalized hydrogel-based organoids for 96 h. Two-tailed unpaired t-test (mean ± s.e.m., n = 3). e, Effect of 1 μM CpG addition on TLR9 expression in HBL1 cells cultured in REDV-functionalized hydrogel-based organoids for 96 h. Two-tailed unpaired t-test (mean ± s.e.m., n = 4). f,g, Survival (normalized to vehicle-treated) of HBL1 cells (f) and human ABC-DLBCL PDX#2 cells co-cultured with CD40L-stromal cells (g) in REDV-functionalized hydrogel-based organoids with and without 1 μM CpG for 96 h, including 48 h of 2,000 nM MI2 treatment. Two-tailed unpaired t-test (mean ± s.e.m., n = 4). h, Volcano plot of FC for proteins in HBL1 cells cultured with 1 μM CpG in REDV-functionalized organoids (n = 3 replicates, each representing 60 organoids). The statistical analysis involved was similar to that in Fig. 4i. Differentially expressed proteins with P < 0.05 is highlighted in blue. i, Effect of CD40-stromal cells on pSRC expression in HBL1 cells cultured for 96 h. Two-tailed unpaired t-test (mean ± s.e.m., n = 4). j, Effect of stiffness, modulated by indicated PEG-4MAL weight percent and the ratio of REDV to VPM and DTT crosslinkers, on pSRC expression of human ABC-DLBCL PDX#2 cells after 96 h culture. One-way ANOVA with Tukey’s multiple-comparison test (mean ± s.e.m., n = 4). k, Effect of CpG on pSRC expression in HBL1 cells cultured for 96 h. Two-tailed unpaired t-test (mean ± s.e.m., n = 4). Each dot in ag and ik represents hydrogel-based organoids.
Fig. 6 |
Fig. 6 |. Combinatorial treatment with cooperative signalling pathway inhibitors rescues MALT1 inhibitors in organoids and in vivo.
a, Survival (normalized to vehicle-treated) of HBL1 cells cultured with CD40L-stromal cells for 96 h, treated for 96 h with 1 μM CpG and 48 h with 2,000 nM MI2, 1,600 nM dasatinib (Das) and/or 5,000 nM masitinib (Mas). One-way ANOVA with Dunnett’s multiple-comparison test against vehicle (mean ± s.e.m., n = 7 for dasatinib + MI2, dasatinib + CpG and dasatinib + MI2 + CpG; n = 6 for other treatment groups; n = 15 for vehicle). b, Survival (normalized to vehicle-treated) of HBL1 cells after 48 h of culture in REDV-functionalized organoids and 48 h of treatment with idelalisib (mean ± s.e.m., n = 4). c, Fluorescent images depicting survival of human PDX cells cultured with CD40L-stromal cells for 48 h and subsequent 48 h of indicated treatment (live, calcein, green; dead, ethidium homodimer, red). Images representative of n = 5 organoids. df, Survival (normalized to vehicle-treated) of HBL1 cells (d), PDX#4 cells (e) and GCB-DLBCL OCI-LY7 cells (f) cultured with CD40L-stromal cells in REDV-functionalized organoids for 96 h, with 48 h of treatment with vehicle, 2,000 nM MI2, 40 μM idelalisib, or both drugs. One-way ANOVA with Dunnett’s multiple-comparison test against the idelalisib + MI2 group (mean ± s.e.m., PDX: n = 5 for vehicle, n = 7 for MI2, and n = 8 for remaining treatments; n = 8 for HBL1; n = 6 for OCI-LY7). g,h, Survival (normalized to vehicle-treated) for HBL1 cells (g) and human PDX#4 cells (h) cultured with CD40L-stromal cells after 96 h culture in REDV-functionalized organoids with CD40L-stromal cells, where ± indicate 48 h 2,000 nM MI2 treatment or 40 μM idelalisib treatment, and/or 96 h 1 μM CpG treatment. One-way ANOVA with Dunnett’s multiple-comparison test against idelalisib + MI2 group (mean ± s.e.m., ****P < 0.0001 against idelalisib + MI2 group, HBL1: n = 6 for idelalisib + MI2, n = 7 for idelalisib + CpG and idelalisib + CpG + MI2; n = 8 for remaining treatments; n = 5 for PDX). ik, MRI images depicting implanted human PDXs (i), the percentage change in PDX volumes (j) and the area under the curve (AUC) (k) for treatment groups. Mice were treated daily with 1 mg per kg (body weight) CpG intratumorally and 25 mg per kg (body weight) MI2 and/or 40 mg per kg (body weight) idelalisib intraperitoneally. Results indicate representative MRI or the mean ± s.e.m. of n = 3. One-way ANOVA with Holm–Šídák’s multiple-comparison test.

Comment in

  • A synthetic tumour microenvironment.
    Gaharwar AK, Singh I. Gaharwar AK, et al. Nat Mater. 2023 Apr;22(4):412-413. doi: 10.1038/s41563-023-01511-6. Nat Mater. 2023. PMID: 36928384 No abstract available.

References

    1. Phelan JD et al. A multiprotein supercomplex controlling oncogenic signalling in lymphoma. Nature 560, 387–391 (2018). - PMC - PubMed
    1. Chapuy B et al. Molecular subtypes of diffuse large B cell lymphoma are associated with distinct pathogenic mechanisms and outcomes. Nat. Med 24, 679–690 (2018). - PMC - PubMed
    1. Roschewski M, Staudt LM & Wilson WH Diffuse large B-cell lymphoma-treatment approaches in the molecular era. Nat. Rev. Clin. Oncol 11, 12–23 (2014). - PMC - PubMed
    1. Lenz G et al. Oncogenic CARD11 mutations in human diffuse large B cell lymphoma. Science 319, 1676–1679 (2008). - PubMed
    1. Fontan L et al. Identification of MALT1 feedback mechanisms enables rational design of potent antilymphoma regimens for ABC-DLBCL. Blood 137, 788–800 (2021). - PMC - PubMed

Publication types

MeSH terms

Substances