. 2023 Mar 16;6(1):275.
doi: 10.1038/s42003-023-04601-y.

Intermittent antibiotic treatment of bacterial biofilms favors the rapid evolution of resistance

Affiliations

Intermittent antibiotic treatment of bacterial biofilms favors the rapid evolution of resistance

Masaru Usui et al. Commun Biol. .

Abstract

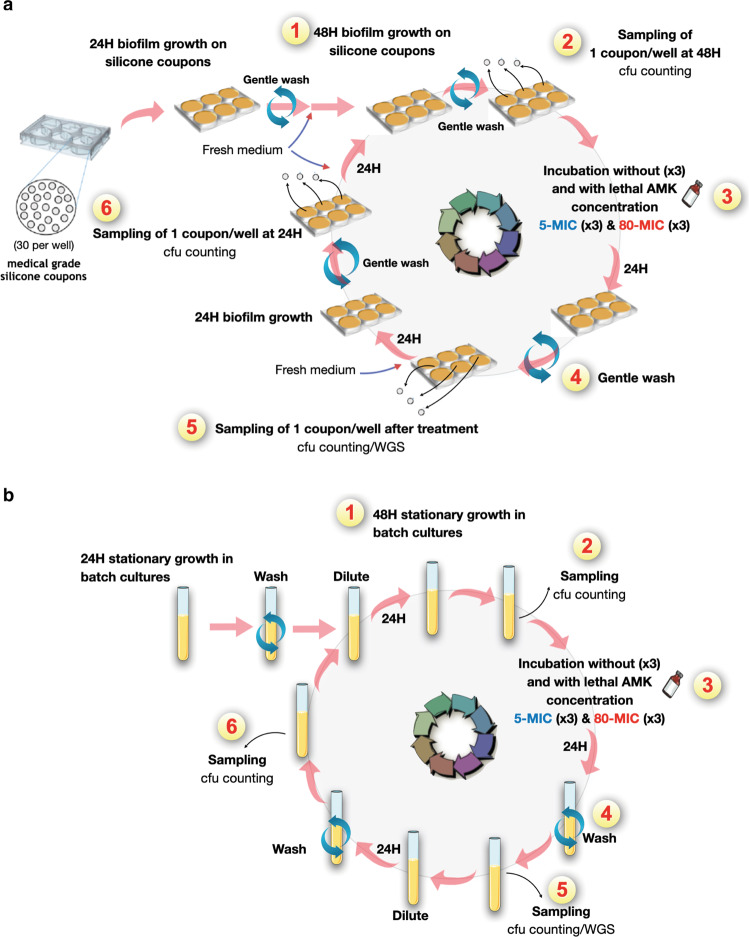
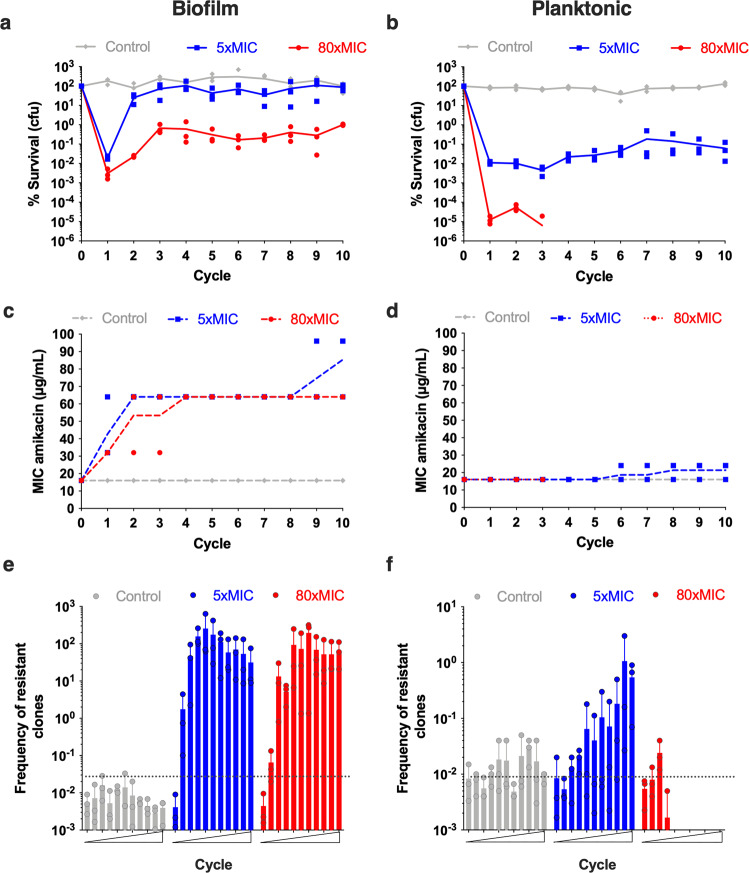
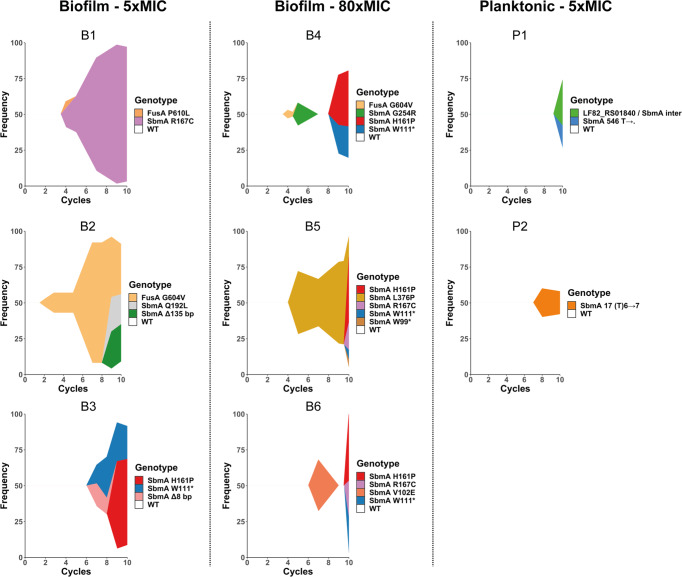
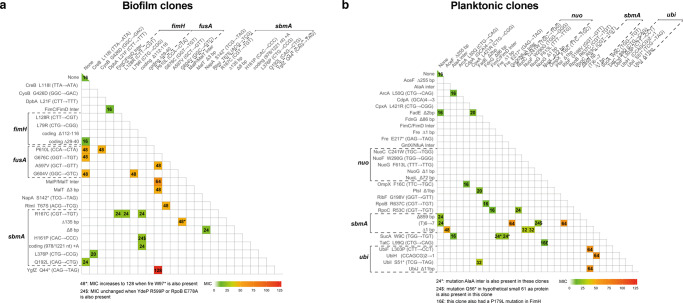
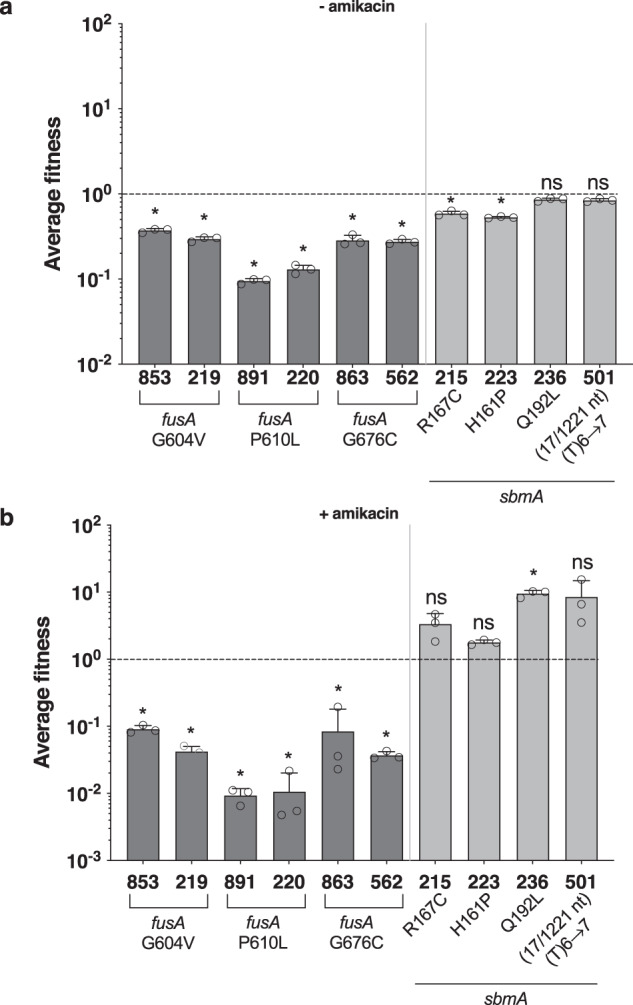
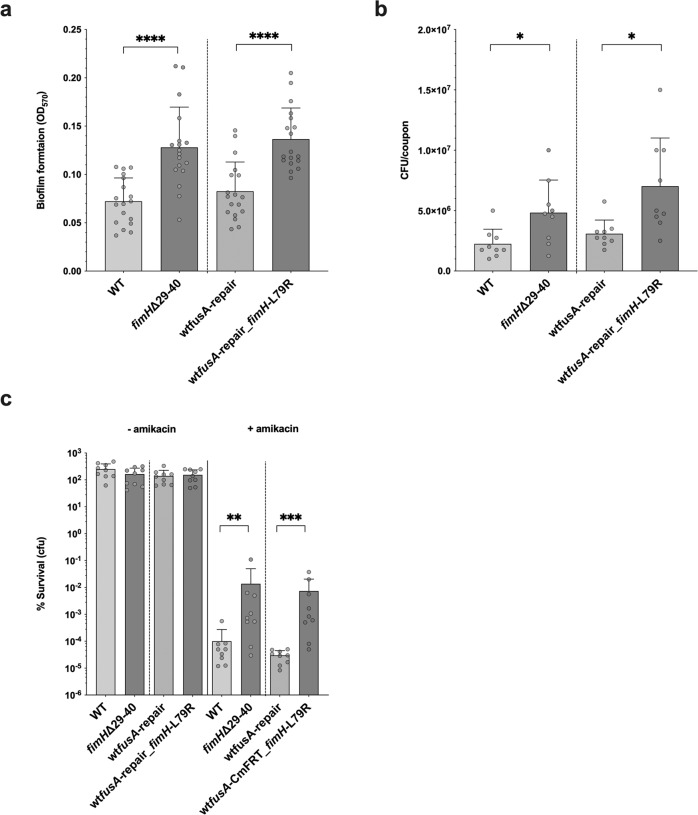
Bacterial antibiotic resistance is a global health concern of increasing importance and intensive study. Although biofilms are a common source of infections in clinical settings, little is known about the development of antibiotic resistance within biofilms. Here, we use experimental evolution to compare selection of resistance mutations in planktonic and biofilm Escherichia coli populations exposed to clinically relevant cycles of lethal treatment with the aminoglycoside amikacin. Consistently, mutations in sbmA, encoding an inner membrane peptide transporter, and fusA, encoding the essential elongation factor G, are rapidly selected in biofilms, but not in planktonic cells. This is due to a combination of enhanced mutation rate, increased adhesion capacity and protective biofilm-associated tolerance. These results show that the biofilm environment favors rapid evolution of resistance and provide new insights into the dynamic evolution of antibiotic resistance in biofilms.


Conflict of interest statement

The authors declare no competing interests.

Figures

Fig. 1
Fig. 1. Schematics of experimental evolution in biofilm and planktonic populations under intermittent amikacin exposure with lethal concentrations.
a In vitro biofilm-model on silicone coupons. (1) Biofilms formed by E. coli LF82 strain are grown for a total of 48 h at 37 °C on silicone coupons in a 6-well plate under static conditions (=cycle 0). (2) One coupon is sampled from each well after removing the exhausted medium and gentle wash of the wells twice with fresh LB medium. (3) Biofilms on silicone coupons are treated with or without amikacin (AMK) at 5- or 80-fold MICs for 24 h at 37 °C. (4) Each well is gently washed twice with fresh LB medium after removing the supernatant containing AMK. (5) One coupon is sampled from each well. Next, the survived biofilm cells are incubated in fresh LB medium for 24 h at 37 °C. (6) One coupon is collected after washing the wells. Then, biofilms are grown for another 24 h at 37 °C (=step 1). Steps 2–6 are defined as a series of cycles, and the experiment is performed for 10 cycles. The last cycle was stopped at step 5. Each coupon is collected in a microtube containing LB medium, and the microtubes are vortexed and sonicated to detach biofilm cells from silicone coupons. The bacterial number of collected sample was confirmed by performing CFU counts. Each collected sample is stored at −80 °C and characterized later. b In vitro planktonic growth. (1) After washing and diluting aliquots of the 24-h pre-incubated culture of LF82 strain, the aliquots are incubated in fresh LB medium into a test tube for another 24 h at 37 °C under shaking condition (=cycle 0). (2) Aliquots of the incubated culture are collected for further analyses. (3) The planktonic culture is treated with or without AMK at 5- or 80-fold MICs for 24 h at 37 °C under shaking condition. (4) Aliquots of treated planktonic cells are washed twice with fresh LB medium. (5) Some aliquots of the washed samples are collected. The bacterial number of collected sample was confirmed by performing CFU counts. Next, the remaining aliquots are diluted 100-fold in fresh LB medium and incubated for 24 h at 37 °C under shaking condition. Then, the 24 h incubated culture is washed twice with fresh LB medium. (6) Aliquots of washed samples are collected. Next, the remaining aliquots are diluted in fresh LB medium and incubated for another 24 h at 37 °C under shaking condition (=step 1). Similar to the biofilm experiment, steps 2–6 are defined as a series of cycles, and the planktonic evolution experiment is performed for 10 cycles. The last cycle was stopped at step 5. Each planktonic sample is stored at −80 °C and characterized later, as well as biofilm samples. See also the corresponding Methods section. Some icons of this figure were extracted from BioRender.
Fig. 2
Fig. 2. Evolution of E. coli survival under lethal antibiotic 24 h intermittent treatment of amikacin.
a, c, e Biofilms and b, d, f Planktonic. In a, b are represented the percentage of survival after each cycle of evolution at step 5 for biofilm and planktonic population compared to population before each cycle of treatment at step 2 (see Fig. 1). Percentages of survival were determined using CFU counting, (CFUstep5/CFUstep2) × 100. 100% (102%) survival corresponds to no death after treatment. Three independent evolutions were performed in parallel for each condition (no treatment = control, 5x AMK MIC, 80x AMK MIC). Lines represented correspond to the means of three measurements represented as individual dots (n = 3), and are represented on a log scale. In c, d the MIC to AMK was determined in triplicate (n = 3) for each population sampled at the end of each cycle using the agar dilution method. No variation of the MIC was observed between the triplicate. MICs are represented by lines corresponding to the mean of each MIC for the three independent evolutions for each condition (n = 3). In e, f each population sampled at the end of each cycle was plated once on LB plate with or without 1x AMK MIC (or 2xMIC and 4xMIC, see supplementary Fig. 4). Frequency of resistant clones was calculated as the CFU1xMIC/CFULB. Values represented correspond to the means and standard errors of the mean of three measurements (n = 3), and are represented on a log scale. Representation of the behaviour of individual population is given in supplementary Fig. 2. In a to f, control in grey corresponds to the evolution where no antibiotic was added during step 3.
Fig. 3
Fig. 3. End-point population sequencing reveals a lifestyle associated pattern of mutations after evolution under intermittent antibiotic treatment.
Mutations identified by whole-population genome sequencing of control and AMK treated (5xMIC and 80xMIC) biofilm and planktonic populations of E. coli. The three populations corresponding to the three evolved lineages per lifestyle and treatment were sequenced after 10 cycles of treatment. The average depth of sequencing was x150. Mutations at higher frequency than 5% are detected by Breseq analysis. Red shading indicates the total frequency of all mutations in each gene within a population at cycle 10 of the experimental evolution and the number in each box corresponds to the exact frequency detected. Population 4, 5, 6 from the planktonic lifestyle did not survive after 3 cycles and thus could not be sequenced at cycle 10 (they are shaded in grey). We therefore sequenced the population corresponding to the last cycle before their respective extinction, but no mutation was detected at frequency of 5% or higher, with the exception of one fixed mutation in population P5 (see supplementary Data 2 and 3).
Fig. 4
Fig. 4. Muller plots showing the dynamics of sbmA and fusA allele frequencies during the evolution of biofilm and planktonic populations subjected to intermittent amikacin treatment.
An independent muller plot showing the dynamic of sbmA and fusA alleles frequencies over cycles of evolution is shown for each population. Every mutation is displayed with a unique colour through all plots. Due to the limit of detection, only mutations with frequency above 5% frequency are shown. Information regarding sbmA and fusA have been extracted from whole-population sequencing presented in supplementary Data 3.
Fig. 5
Fig. 5. Association of non-synonymous mutations in sequenced evolved clones and their corresponding MICs to amikacin.
Non-synonymous mutations identified by whole genome sequencing in clones of E. coli coming from AMK intermittently treated biofilm (a) and planktonic (b) populations. MICs are expressed in µg/mL. MIC of the ancestor strain is 16 µg/mL and is shown in the first top left cell. In a and b the first column actually corresponds to clones that had a unique mutation in the indicated genes. The presented information is extracted from clone sequencing data presented in supplementary Data 4.
Fig. 6
Fig. 6. Relative fitness costs of evolved clones containing fusA and sbmA mutations.
Each evolved clone tagged with mars was competed with wildtype tagged with GFP at a 1/1 ratio in the absence (a) and presence (b) of 5x AMK MIC. In order to match the evolution protocol, in (a) wt/mutants LB overnight cultures were mixed, diluted to OD 0.02 and grown in LB for 24 h before flow cytometer analysis. In b wt/mutants LB overnight cultures were mixed, diluted to OD 2, treated for 24 h by 5x AMK MIC, washed, diluted 1/100 and regrow in LB for 24 h before flow cytometer analysis. The fitness index of the comparison of wildtype tagged with mars to wildtype tagged with GFP is taken as 1 (dotted line). Detailed information on the different analysed clones can be found in supplementary Data 4. It should be noted that clones 853, 863 and 891 differ, respectively, from the ancestral strain by a single G604V, G676C and P610L fusA mutation, and clones 236 and 501 differ, respectively, from the ancestral strain by a single Q192L and (17/1221 nt) (T)6 → 7 sbmA mutation, and are otherwise isogenic. The data corresponded to n = 3 biological replicates for each clone and are represented as the mean ± SD. Statistics correspond to unpaired two-tailed t-test with Welch’s correction comparing each condition to wildtype/wildtype fitness. ns, no significance; *p < 0.05; **p < 0.01; ***p < 0.001.
Fig. 7
Fig. 7. fimH mutants display higher capacity to form biofilms and enhanced tolerance towards a lethal concentration of amikacin.
a, b Biofilm amounts (a) and colony forming units (b) of fimH mutants formed on silicone coupons for 24 h. c The survival rate of biofilm cells of fimH mutants on silicone coupons after the treatment with 80xMIC of AMK. It was calculated by using the formula 100x(CFUAFTER/CFUBEFORE), where CFUBEFORE corresponds to CFU/coupon before treatment and CFUAFTER to CFU/coupon after treatment. The data corresponded to n = 18 biological replicates for a, and n = 9 for b and c. Data are represented as the mean ± SD. Statistics correspond to unpaired two tailed t-test with Welch’s correction comparing each fimH mutant to its corresponding wt isogenic strain. *p < 0.05; **p < 0.01; ***p < 0.001, ****p < 0.0001. In c, statistics were performed on log-transformed % survival. fimH ∆29-40 in frame deletion is present in clone 239 that differs from the ancestral strain by this single mutation. We showed previously that the exact same fimH ∆29-40 deletion enhanced biofilm formation in E. coli K12 (see supplementary Data 4). The clone with the mutation fimH L79R was created after de-construction of the fusA G604V mutation from the clone 219 where we replaced the fusA G604V allele by a wt version of fusA (wtfusA-repair) (see Methods). This clone also codes for a synonymous mutation I255I in the gene LF82_RS22000.

References

    1. Andersson DI, Hughes D. Selection and transmission of antibiotic-resistant bacteria. Microbiol. Spectr. 2017;5:MTBP-0013–MTBP-2016. doi: 10.1128/microbiolspec.MTBP-0013-2016. - DOI - PMC - PubMed
    1. Murray CJL, et al. Global burden of bacterial antimicrobial resistance in 2019: a systematic analysis. Lancet. 2022;399:629–655. doi: 10.1016/S0140-6736(21)02724-0. - DOI - PMC - PubMed
    1. Jansen G, Barbosa C, Schulenburg H. Experimental evolution as an efficient tool to dissect adaptive paths to antibiotic resistance. Drug Resist. Updat. 2013;16:96–107. doi: 10.1016/j.drup.2014.02.002. - DOI - PubMed
    1. Fridman O, Goldberg A, Ronin I, Shoresh N, Balaban NQ. Optimization of lag time underlies antibiotic tolerance in evolved bacterial populations. Nature. 2014;513:418–421. doi: 10.1038/nature13469. - DOI - PubMed
    1. Khare A, Tavazoie S. Extreme antibiotic persistence via heterogeneity-generating mutations targeting translation. mSystems. 2020;5:e00847–00819. doi: 10.1128/mSystems.00847-19. - DOI - PMC - PubMed

Publication types

MeSH terms