. 2023 May;24(5):827-840.
doi: 10.1038/s41590-023-01468-3. Epub 2023 Mar 16.

MafB-restricted local monocyte proliferation precedes lung interstitial macrophage differentiation

Affiliations

MafB-restricted local monocyte proliferation precedes lung interstitial macrophage differentiation

Domien Vanneste et al. Nat Immunol. 2023 May.

Abstract

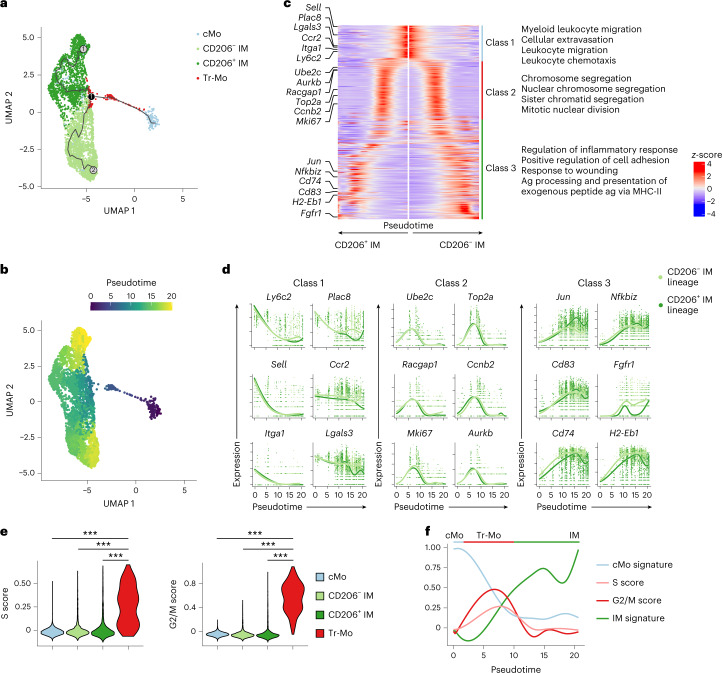
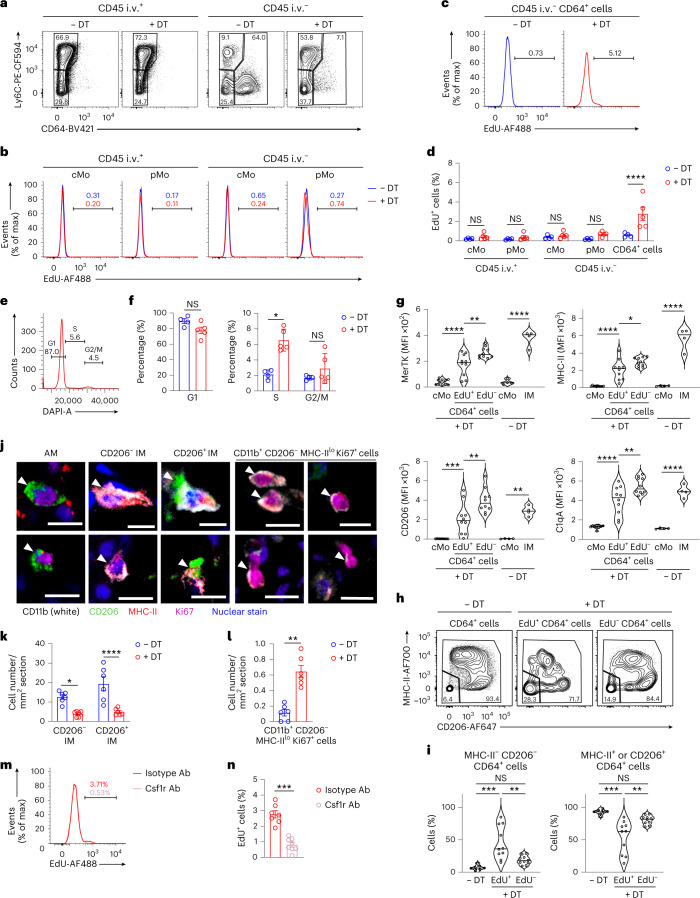
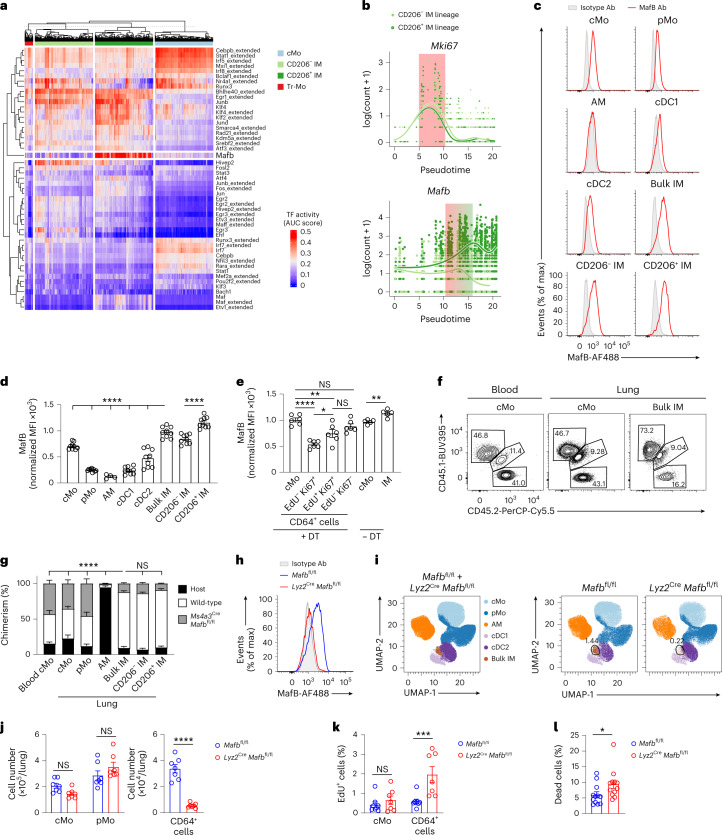
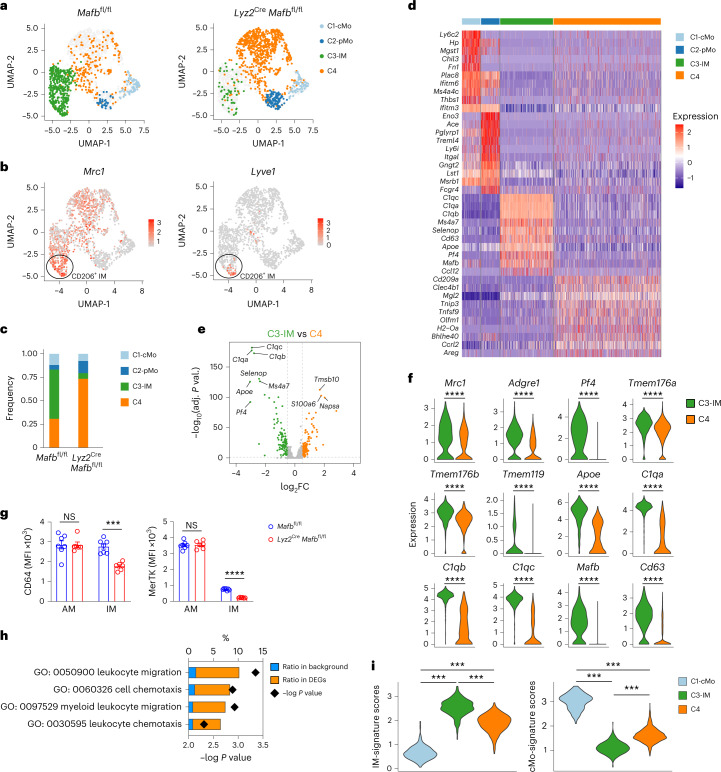
Resident tissue macrophages (RTMs) are differentiated immune cells that populate distinct niches and exert important tissue-supportive functions. RTM maintenance is thought to rely either on differentiation from monocytes or on RTM self-renewal. Here, we used a mouse model of inducible lung interstitial macrophage (IM) niche depletion and refilling to investigate the development of IMs in vivo. Using time-course single-cell RNA-sequencing analyses, bone marrow chimeras and gene targeting, we found that engrafted Ly6C+ classical monocytes proliferated locally in a Csf1 receptor-dependent manner before differentiating into IMs. The transition from monocyte proliferation toward IM subset specification was controlled by the transcription factor MafB, while c-Maf specifically regulated the identity of the CD206+ IM subset. Our data provide evidence that, in the mononuclear phagocyte system, the ability to proliferate is not merely restricted to myeloid progenitor cells and mature RTMs but is also a tightly regulated capability of monocytes developing into RTMs in vivo.


Conflict of interest statement

The authors declare no competing interests.

Figures

Fig. 1
Fig. 1. Lung interstitial macrophage subsets can be defined as Cx3cr1hiTmem119hi cells.
a, Heat map showing gene activity in the indicated myeloid cell populations, inferred from microarray data uploaded on the Gene Expression Commons platform. Alv, alveolar; CNS, central nervous system; Int, interstitial; LN, lymph node; Mo, monocyte; Mac, macrophage; PC, peritoneal cavity; SI, small intestine; SLNs, skin-draining lymph nodes; SP, spleen. b, Gene activities of Cx3cr1 and Tmem119 in the indicated myeloid cell populations, as in a. The arrow indicates lung IMs. c, Representative flow cytometry gating strategy showing CD45+F4/80+CD11c+ AMs, AM-excluded CD45+SSCloCD11b+F4/80+Ly6C+CD64 cMo, AM-excluded CD45+SSCloCD11b+F4/80+Ly6CCD64 pMo, AM-excluded CD45+SSCloCD11b+F4/80+CD64+ bulk IMs further divided into CD206+ IMs and CD206 IMs in lungs of wild-type mice at steady state. d,e, Representative flow cytometry histograms (d) and normalized MFI (e) of GFP expression in lung cMo, pMo, AMs and IMs, as in c, and in CD45+CD11c+MHC-II+CD26+CD64CD172aXCR1+ type 1 conventional DCs (cDC1) and CD45+CD11c+MHC-II+CD26+CD64CD172a+MAR1 (cDC2) from Cx3cr1GFP/+ and Cx3cr1+/+ mice. f,g, Representative histograms (f) and normalized MFI (g) of intracellular Cre protein in lung myeloid cells, as in d and e, from Tmem119Cre/+ and Tmem119+/+ mice. Data show the mean ± s.e.m. and individual values (b, e and g: n = 3 replicates, 3 mice and 3 mice, respectively). P values were calculated using a one-way analysis of variance (ANOVA) with Tukey’s post hoc test and compared bulk IMs with cMo, pMo, AMs, cDC1 and cDC2 (e and g). **P < 0.01; ****P < 0.0001. MFI, mean fluorescence intensity. Source data
Fig. 2
Fig. 2. Efficiency and specificity of diphtheria toxin-induced interstitial macrophage depletion in IMDTR mice.
a, Representative merged UMAP plots of lung single live CD45+CD11b+ or CD11c+ mononuclear cells analyzed by flow cytometry 24 h after 50 ng DT i.p. injection or no treatment in IMDTR mice (merged data from four mice per group). Cell clusters (left) and heat map plots depicting the expression of Ly6C, CD11c, CD11b, F4/80, CD64 and CD206 (right). b, Representative UMAP plot, as in a, showing cells from either untreated IMDTR mice or DT-treated IMDTR mice. c, Representative contour plot of Ly6C and CD64 expression within lung single live AM-excluded CD45+SSCloCD11b+F4/80+ cells from untreated and DT-treated IMDTR mice, as in a. d, Absolute numbers of the indicated lung myeloid cell populations quantified by flow cytometry in IMDTR mice, at 24 h after i.p. injection with DT in doses ranging from 0.1 to 500 ng. Horizontal dotted lines represent the average number of cells in untreated IMDTR mice. e,f, Absolute numbers of lung CD45+CD11c+MHC-II+CD26+CD64CD172aXCR1+ cDC1, CD45+CD11c+MHC-II+CD26+CD64CD172a+MAR1 cDC2, CD45+CD11c+MHC-II+CD26+CD64CD172a+MAR1+ DCs (MAR1+ DC) and CD45+CD11c+MHC-II+CD26CD64+CD172a+ macrophages (CD64+ Mac) (e) and lung CD45+CD11b+Ly6G+ neutrophils (Neu) and CD45+CD11b+SiglecF+ eosinophils (Eos) (f) quantified by flow cytometry 24 h after 50 ng DT i.p. injection or no treatment in IMDTR mice. g,h, Numbers of BM LinLy6A/E+CD117+ LSK, LinCD16/32CD117+CD135+CD34+CD115 common myeloid progenitors (CMP), LinCD16/32CD117+CD135+CD34+CD115+ monocyte-DC progenitors (MDP), LinCD16/32+CD117+CD135CD34+CD115Ly6C granulocyte-monocyte progenitors (GMP), LinCD16/32+CD117+CD135CD34+CD115Ly6C+ granulocyte progenitors (GP), LinCD16/32+CD117+CD135CD34+CD115+Ly6C+ monocyte progenitors (cMoP), LinCD16/32+CD117CD115+Ly6C+ monocytes (Ly6C+ BMMo), LinCD16/32CD117CD135+CD115+CD34Ly6C common DC progenitors (CDP) (g), blood CD45+CD3CD19Ly6GSiglecFCD115+ Ly6C+ cMo or Ly6C pMo, CD45+Ly6GSiglecFLy6CCD115+CD11b+ F4/80hi large (LPM) or F4/80lo small peritoneal macrophages (SPM), liver CD45+CD31F4/80+CD11bintCD64+ Kupffer cells (KC), spleen LinF4/80+CD11b red pulp macrophages (RPM), small intestinal (SI) and colon (C) CD45+Ly6CCD11b+F4/80+CD64+ lamina propria macrophages (LPM) and FSCloCD45intF4/80+CD11b+CD64+Ly6C microglia (h), as in e. Data show the mean ± s.e.m. and are pooled from 2–4 independent experiments (dh: n = 6–15, 10, 8–10, 7, 8–10 mice per group, respectively). P values were calculated using a two-way ANOVA with Tukey’s post hoc test. *P < 0.05; **P < 0.01; ***P < 0.001; ****P < 0.0001; NS, not significant. Source data
Fig. 3
Fig. 3. A vacant interstitial macrophage niche is repopulated by Ccr2-dependent classical monocyte differentiating into interstitial macrophages.
a, Representative plots of Ly6C and CD64 expression within lung AM-excluded CD45+F4/80+SSCloCD11b+ cells at days 0, 0.5, 1, 2, 3, 7 and 14 after 50 ng DT i.p. in IMDTR mice. b, Time course of absolute numbers of cMo, pMo, AMs, bulk IMs, CD206 IMs and CD206+ IMs quantified by flow cytometry in IMDTR and littermate controls, as in a. Data show the mean (centerline) ± s.e.m. (colored area) and are pooled from ≥2 independent experiments (n = 8–10 mice per time point). c, Amount of Ccl2 in the lung and serum of IMDTR and littermate controls at 0, 12, 24 and 48 h after DT i.p. injection. d,e, Representative CD45.1 and CD45.2 contour plots (d) and bar graphs showing the percentage of CD45.1 donor and CD45.2 host chimerism (e) in the indicated cell populations from lethally irradiated thorax-protected CD45.2 IMDTR mice reconstituted with CD45.1 wild-type BM donor cells, injected or not with 50 ng DT i.p. 4 weeks later and evaluated at day 7 after DT. f,g, Representative CD45.1 and CD45.2 contour plots (f) and bar graphs showing the percentage of Ccr2+/+ donor, Ccr2−/− donor and host chimerism (g) in the indicated cell populations from lethally irradiated, thorax-protected CD45.1/CD45.2 IMDTR mice transplanted with a 1:1 mix of CD45.2 Ccr2−/− and CD45.1 Ccr2+/+ BM cells, injected with 50 ng DT i.p. 4 weeks later and evaluated at day 7 after DT. h, Representative contour plot of Ly6C and CD64 expression within lung single live AM-excluded CD45+F4/80+SSCloCD11b+ cells in CD45.1/CD45.2 IMDTR mice treated with 50 ng DT i.p., transferred with CD45.1 BM wild-type cMo i.v. 24 h after DT and evaluated at days 2 and 14 after DT. Plots are representative of 5 mice, each of them giving similar results. Data show the mean ± s.e.m. and are pooled from two independent experiments (c, e and g: n = 4–8, 4–8 and 6 mice per group, respectively). P values were calculated by likelihood ratio tests (b), two-way ANOVA with Tukey’s post hoc tests (c,e) or one-way ANOVA with Sidak’s post hoc tests (g). *P < 0.05; **P < 0.01; ***P < 0.001; ****P < 0.0001. Source data
Fig. 4
Fig. 4. Time-course scRNA-seq analyses of interstitial macrophage niche refilling reveal discrete transitioning cells.
a, Three-dimensional UMAP plot depicting the transcriptional identity of sorted lung CD45+SSCloCD11b+F4/80+CD64 monocytes and CD45+SSCloCD11b+F4/80+CD64+ IMs merged from IMDTR mice injected with DT i.p. at 0, 12, 24, 48 and 96 h before the analysis (n = 5 pooled mice per time point). b, UMAP plots from the five separate time points after DT, as in a. Inset indicates the number of cells analyzed (a and b). c, Histogram showing the frequency of each cluster at each time point after DT. d, Heat map depicting the single-cell expression of the ten most upregulated genes within each cluster. e, Dot plots show average expression of the indicated genes and the percentage of cells expressing the genes within each cluster. f, Prevalent pattern of RNA velocities substantiated by arrows and visualized on the same UMAP plot as shown in a. The square on the right shows a higher magnification of the area in the left square.
Fig. 5
Fig. 5. Trajectory analyses of interstitial macrophage development identify transient proliferating monocytes.
a, Two-dimensional UMAP plot depicting the transcriptional identity and cell trajectories of lung cMo, Tr-Mo, CD206 IMs and CD206+ IMs, as in Fig. 4a, evaluated by Monocle analysis. b, Two-dimensional UMAP plot depicting the pseudotime trajectory values of lung cMo, Tr-Mo, CD206 IMs and CD206+ IMs, as in a. c, Heat map plot depicting the DEGs along pseudotime evaluated by tradeSeq in the common trajectory starting from cMo (middle) and ending in CD206 IM and CD206+ IM subsets. DEGs are divided into three classes, and examples of genes and the main biological responses enriched in each class are represented on the left and right, respectively. d, Gene expression of the indicated genes along pseudotime evaluated by tradeSeq in both trajectories leading either to CD206 IM or CD206+ IM subsets. e, S and G2/M cell cycle scores of single cells within cMo, Tr-Mo, CD206 IMs and CD206+ IMs, as depicted by violin plots (height: score; width: abundance of cells). f, cMo and IM signatures, and S and G2/M scores depicted along pseudotime, as in b. P values were calculated by one-way ANOVA with Tukey’s post hoc tests (e). ***P < 0.001.
Fig. 6
Fig. 6. Transitioning monocytes can proliferate via Csf1r-dependent mechanisms.
a, Representative plots of Ly6C and CD64 expression within lung CD45 i.v.+ and CD45 i.v. AM-excluded CD45+F4/80+SSCloCD11b+ cells from EdU-pulsed IMDTR mice treated or not with 50 ng DT i.p. 2 d before. b, Representative histograms of EdU levels in lung cMo and pMo, as in a. c, Representative histograms of EdU levels in lung CD64+ cells, as in a. d, Bar graphs showing the percentage of EdU+ cells in lung cMo and pMo, and in lung CD64+ cells, as in a. e, Representative histograms of DAPI signal in lung CD64+ cells, as in a. f, Bar graph showing the percentage of lung extravascular CD64+ cells in G1, S and G2/M phases, as in e. g, Expression of the indicated markers in lung cMo, EdU+CD64+ cells and EdUCD64+ cells from EdU-pulsed IMDTR mice at day 2 after DT and in lung cMo and IMs from untreated IMDTR mice, as depicted by violin plots (height: MFI; width: abundance of cells). h, Representative plots of MHC-II and CD206 expression within lung CD64+ cells from untreated IMDTR mice and EdU/EdU+CD64+ cells from DT-treated EdU-pulsed IMDTR mice, as in g. i, Percentage of MHC-II CD206 cells and MHC-II+ or CD206+ cells within lung CD64+ cells from untreated IMDTR mice and EdU/EdU+ CD64+ cells from DT-treated EdU-pulsed IMDTR mice, as in h, as depicted by violin plots (height: percentage; width: abundance of cells). j, Representative images of AMs, CD206 IMs, CD206+ IMs and CD11b+CD206MHC-IIloKi67hi cells, identified by confocal microscopy on lung sections from untreated and DT-treated IMDTR mice, at day 2 after DT. k,l, Number of CD206 IMs and CD206+ IMs (k) and CD11b+CD206MHC-IIloKi67hi cells (l) per mm2, as in j. m, Representative histograms of EdU levels in lung CD64+ cells from DT-treated IMDTR mice, as in a, and treated i.v. with Csf1r antibodies (Ab) or isotype control 6 and 28 h after DT. n, Bar graph showing the percentage of EdU+ cells in lung CD64+ cells, as in m. Data show the mean ± s.e.m. and are pooled from two independent experiments (d, f, g, i, k, l and n: n = 4–5, 4–5, 4–10, 7–10, 6, 6 and 7–8 mice per group, respectively). P values were calculated using a two-way ANOVA with Sidak’s post hoc tests (b and k), a two-tailed Mann–Whitney test (e, l and n) or one-way ANOVA with Tukey’s post hoc tests (g and i). *P < 0.05; **P < 0.01; ***P < 0.001; ****P < 0.0001. Scale bar, 10 µm. Source data
Fig. 7
Fig. 7. MafB restricts proliferation and mediates interstitial macrophage development.
a, Heat map depicting predicted transcription factor (TF) activities across lung myeloid cells analyzed by scRNA-seq, as in Fig. 4a, as assessed by SCENIC. b, Expression of Mki67 and Mafb along pseudotime evaluated by tradeSeq in both CD206 IM or CD206+ IM trajectories, as in Fig. 5d. c,d, Representative histograms (c) and bar graphs showing normalized MFI (d) of MafB expression in the indicated lung myeloid cell populations from wild-type mice. e, Bar graphs showing expression of MafB in lung cMo and IMs from untreated IMDTR mice, and in lung cMo, EdUKi67+, EdU+Ki67+ or EdUKi67 CD64+ cells from EdU-pulsed IMDTR mice at day 2 after DT. f,g, Representative CD45.1 and CD45.2 plots (f) and bar graphs showing the percentage of wild-type donor, Ms4a3CreMafbfl/fl donor and host chimerism (g) in the indicated cell populations from lethally irradiated, thorax-protected CD45.1/CD45.2 IMDTR mice transplanted with a 1:1 mix of CD45.2 Ms4a3CreMafbfl/fl and CD45.1 wild-type BM cells, injected with 50 ng DT i.p. 4 weeks later and evaluated at day 7 after DT. h, Efficiency of Mafb depletion within lung CD64+ cells from Lyz2CreMafbfl/fl mice evaluated by MafB intracellular staining. Data are representative of five mice, each of them giving similar results. i, Representative UMAP plots of lung CD45+CD11b+ or CD11c+ mononuclear cells analyzed by flow cytometry in Lyz2CreMafbfl/fl and Mafbfl/fl littermate controls (merged data from four mice per group). jl, Absolute numbers of lung cMo, pMo and CD64+ cells (j), bar graphs showing the percentage of EdU+ cells within cMo and CD64+ cells (k) and bar graph showing the percentage of dead cells within CD64+ cells (l) from Lyz2CreMafbfl/fl and Mafbfl/fl mice. Data show the mean ± s.e.m. and are pooled from 2–3 independent experiments (d, e, g, j, k and m: n = 9, 5–6, 4–7, 7, 7–8 and 12 mice per group, respectively). P values were calculated using a one-way ANOVA with Tukey’s post hoc tests (d, e and g), a two-way ANOVA with Sidak’s post hoc tests (j and k) or a two-tailed Mann–Whitney test (m). In d, P values compare bulk IM versus every other population, or CD206+ IM versus CD206 IM. In g, P values compare the percentage of donor CD45.1 wild-type chimerism. *P < 0.05; **P < 0.01; ***P < 0.001; ****P < 0.0001. AUC, area under the curve. Source data
Fig. 8
Fig. 8. Interstitial macrophage identity is severely impaired in myeloid-restricted Mafb-deficient mice.
a, UMAP plots depicting the transcriptional identity of lung CD45+SSCloCD11b+F4/80+ CD64 monocytes and CD64+ cells from Lyz2CreMafbfl/fl mice and littermate controls (n = 5 pooled mice per group). b, UMAP feature plots representing single-cell expression of Mrc1 and Lyve1 in lung myeloid cells merged from Lyz2CreMafbfl/fl mice and littermate controls, as in a. c, Histogram showing frequency of each cluster in Lyz2CreMafbfl/fl mice and littermate controls. d, Heat map depicting the single-cell expression of the ten most upregulated genes within each cluster. e, Volcano plot depicting DEGs between C3 and C4 clusters. Transcripts significantly upregulated in C3 and C4 are colored in green and orange, respectively (log2 fold change ± 0.5 and adjusted P value < 0.05). f, Expression of the indicated genes within C3 and C4 clusters, as depicted by violin plots (height: expression; width: abundance of cells). g, Surface expression of CD64 and MerTK in lung AMs and CD64+ cells, evaluated by flow cytometry in Lyz2CreMafbfl/fl and littermate controls. h, GO enrichment analysis performed on the upregulated genes in C4 as compared to C3. i, IM and cMo signature scores within C1, C3 and C4 clusters, as depicted by violin plots (height: scores; width: abundance of cells). Data show the mean ± s.e.m. and are pooled from two independent experiments (g; n = 6–7 mice per group). P values were calculated using a Wilcoxon rank sum test (e and f), a two-way ANOVA with Sidak’s post hoc test (g), a two-tailed Mann–Whitney U test with Benjamini–Hochberg false discovery rate correction (h), or a one-way ANOVA with Tukey’s post hoc test (i). ***P < 0.001; ****P < 0.0001. Source data
Extended Data Fig. 1
Extended Data Fig. 1. Flow cytometry gating strategies to delineate lung DCs, BM progenitors, blood immune cells and RTM.
Flow cytometry gating strategy used to delineate lung CD45+CD11c+MHC-II+CD26+CD64CD172aXCR1+ type 1 conventional DC (cDC1), CD45+CD11c+MHC-II+CD26+CD64CD172a+MAR1 type 2 conventional DC (cDC2), CD45+CD11c+MHC-II+CD26+CD64CD172a+MAR1+ DCs (MAR1+ DC) and CD45+CD11c+MHC-II+CD26CD64+CD172a+ macrophages (CD64+ Mac) (a), BM LinLy6A/E+CD117+ LSK (b), LinCD16/32CD117+CD135+CD34+CD115 common myeloid progenitors (CMP), LinCD16/32CD117+CD135+CD34+CD115+ monocyte-DC progenitors (MDP), LinCD16/32+CD117+CD135CD34+CD115Ly6C granulocyte-monocyte progenitors (GMP), LinCD16/32+CD117+CD135CD34+CD115Ly6C+ granulocyte progenitors (GP), LinCD16/32+CD117+CD135CD34+CD115+Ly6C+ monocyte progenitors (cMoP), Lin-CD16/32+CD117CD115+Ly6C+ monocytes (Ly6C+ BMMo), LinCD16/32CD117CD135+CD115+CD34Ly6C common DC progenitors (CDP) (c), blood CD45+CD3+CD19 T cells, CD45+CD3CD19+ B cells, CD45+CD3CD19Ly6GSiglecFCD115+ Ly6C+ cMo or Ly6C pMo, CD45+CD3CD19Ly6G+CD11b+ neutrophils (Neu), CD45+CD3CD19CD11b+SiglecF+ eosinophils (Eos) (d), CD45+Ly6GSiglecFLy6CCD115+CD11b+ F4/80hi large (LPM) or F4/80lo small peritoneal macrophages (SPM) (e), liver CD45+CD31F4/80+CD11bintCD64+ Kupffer cells (KC) (f), spleen LinF4/80+CD11b red pulp macrophages (RPM) (g), small intestinal CD45+Ly6CCD11b+F4/80+CD64+ lamina propria macrophages (SI LPM) (h) and colon CD45+Ly6CCD11b+F4/80+CD64+ lamina propria macrophages (C LPM) (i). Mac, macrophage.
Extended Data Fig. 2
Extended Data Fig. 2. Assessment of intracellular Cre protein expression in BM progenitors, blood leukocytes and RTM.
a-c, Representative histograms of Cre intracellular expression in BM progenitors, as in Extended Data Fig. 1b,c (a), in blood leukocytes, as in Extended Data Fig. 1d (b), and in small and large peritoneal macrophages (SPM and LPM, respectively), Kupffer cells (KC), red pulp splenic macrophages (RPM), small intestinal (SI) and colon (C) lamina propria macrophages (LPM), as in Extended Data Fig. 1e-i (c) from Tmem119+/+ (blue) and Tmem119Cre/+ (red) mice. d, Flow cytometry gating strategy to show brain FSCloCD45intF4/80+CD11b+CD64+Ly6C microglia. e, Representative histograms of Cre intracellular protein expression in microglia from Tmem119+/+ (blue) and Tmem119Cre/+ (red) mice. f-h, Bar graphs showing normalized Cre expression in the indicated cell populations from the BM (f) and the blood (g), and in tissue RTM (h). Data show mean ± SEM (n = 4 mice per group). In h, P values compare microglia vs. every other population and were calculated using a one-way analysis of variance (ANOVA) with Tukey’s post hoc tests. Raw data and P values are provided as a source data file. ****, P < 0.0001. CDP, common plasmacytoid and dendritic cell progenitor; cMoP, common monocyte progenitor; CMP, common myeloid progenitor; GMP, granulocyte-monocyte progenitor; GP, granulocyte progenitor; LSK, lineage(Lin)Sca-1+cKit+ multipotent progenitor; MDP, monocyte-dendritic cell progenitor. Source data
Extended Data Fig. 3
Extended Data Fig. 3. Assessment of YFP labeling in Tmem119CreRosa26LSL-EYFP mice and of microglia depletion in IMDTR mice.
a, Flow cytometry gating strategy to show Lineage(Lin)Sca-1+c-Kit+ (LSK) multipotent progenitors, LinSca-1c-Kitint/hi myeloid lineage-committed progenitors (MyP) and LinSca-1intc-Kitint common lymphoid progenitors (CLP). b-c, Representative histograms of YFP expression (b) and bar graphs showing % of YFP+ cells (c) in BM LSK, MyP and CLP (c) from Tmem119+/+Rosa26LSL-EYFP (blue) and Tmem119Cre/+Rosa26 LSL-EYFP (red) mice. d-e, Representative histograms of YFP expression (d) and bar graphs showing % of YFP+ cells (e) in blood CD45+CD3+CD19 T cells, CD45+CD3CD19+ B cells, CD45+CD3CD19Ly6GSiglecFCD115+ Ly6C+ cMo or Ly6C pMo, CD45+CD3CD19Ly6G+CD11b+ neutrophils (Neu), CD45+CD3CD19CD11b+SiglecF+ eosinophils (Eos) from Tmem119+/+Rosa26LSL-EYFP (blue) and Tmem119Cre/+Rosa26 LSL-EYFP (red) mice. f-g, Representative histograms of YFP expression (f) and bar graphs showing % of YFP+ cells (g) in lung cMo, pMo, cDC1, cDC2, AMs, IMs and CD45 structural cells from Tmem119+/+Rosa26LSL-EYFP (blue) and Tmem119Cre/+Rosa26 LSL-EYFP (red) mice. h-i, Representative histograms of YFP expression (h) and bar graphs showing % of YFP+ cells (i) in small and large peritoneal macrophages (SPM and LPM, respectively), Kupffer cells (KC), red pulp splenic macrophages (RPM), small intestinal (SI) and colon (C) lamina propria macrophages (LPM) and microglia from Tmem119+/+Rosa26LSL-EYFP (blue) and Tmem119Cre/+Rosa26 LSL-EYFP (red) mice. j, Numbers of microglia quantified by flow cytometry in IMDTR and littermate control mice injected i.p. with 50 or 500 ng DT and evaluated 24 or 72 h post-DT injection. Data show mean ± SEM and are pooled from 2 independent experiments (c,e,g,i,j) (c,e,g,i: Tmem119+/+Rosa26LSL-EYFP; Tmem119Cre/+Rosa26 LSL-EYFP: n = 4;6 mice per group, respectively; j: n = 3-4 mice per group). P values were calculated using a two-way (c,e,g,i) or a one-way (j) analysis of variance (ANOVA) with Tukey’s post hoc test. In g, P values compare IMs vs. every other population. Raw data and P values are provided as a source data file. *, P < 0.05; ****, P < 0.0001. ns, not significant. Source data
Extended Data Fig. 4
Extended Data Fig. 4. IM niche refilling is independent of Nr4a1 and repopulated IMs are largely similar to native IMs 14 days post-DT in IMDTR mice.
a, Bar graphs showing % of Nr4a1+/+ donor, Nr4a1−/− donor and host chimerism in the indicated cell populations from lethally-irradiated, thorax-protected CD45.1/CD45.2 IMDTR mice transplanted with a 1:1 mix of CD45.2 Nr4a1−/− and CD45.1 Nr4a1+/+ BM cells, injected with 50 ng DT i.p. 4 weeks later and evaluated at day 7 post-DT. b, Principal Component (PC) analysis plot with % indicating the variability explained by each PC component, obtained by bulk RNA-seq analysis of lung cMo, AMs, CD206 IMs and CD206+ IMs from untreated IMDTR mice, and of lung CD206 IMs and CD206+ IMs from DT-treated IMDTR mice at day 14 post-DT (n = 3 pooled mice per replicate, 3 replicates per condition). c, Volcano plots depicting the DEG between native and repopulated CD206 IMs (left) and native and repopulated CD206+ IMs (right). Transcripts significantly upregulated in native and repopulated IM subsets are colored in blue and red, respectively (log2 fold-change ± 1 and adjusted P value < 10−2). d, Bar graph showing lung IM numbers assessed by flow cytometry in IMDTR mice treated or not with DT i.p. at day 0 and 14, and analyzed 24 h after the last DT treatment (day 15). Data show mean ± SEM and are pooled from 2 independent experiments (a,d) (a,d: n = 4,7-8 mice per group, respectively). P values were calculated using a one-way ANOVA with Tukey’s post-hoc tests, and compare donor CD45.1 Nr4a1+/+ chimerism between cell populations in a. Raw data and P values are provided as a source data file. **, P < 0.01; ****, P < 0.0001. ns, not significant. Source data
Extended Data Fig. 5
Extended Data Fig. 5. Identification of non-classical CD16.2+ monocytes in scRNA-seq data of monocyte-to-IM trajectory.
UMAP feature plot depicting the transcriptional identity of sorted lung CD45+SSCloCD11b+F4/80+CD64 monocytes and CD45+SSCloCD11b+F4/80+CD64+ IMs merged from IMDTR mice injected with DT i.p. at 0, 12, 24, 48 and 96 hours before the analysis (n = 5 pooled mice per time point), according to their CD16.2+ monocyte (Mo) signature score (a) and to the expression of the indicated genes (b-e). f, Two-dimensional UMAP plot, as in a, identifying CD16.2+ monocytes.
Extended Data Fig. 6
Extended Data Fig. 6. Tr-Mo are BM-derived cells in transition between cMo and IMs and whose proliferation is inhibited by Csf1r antagonists.
a, Expression of the indicated markers in lung cMo, EdU+CD64+ and EdUCD64+ cells from EdU-pulsed IMDTR mice at day 2 post-DT. Values obtained from individual mice are connected with a dashed line. b, Bar graph showing the % of EdU+ cells in CD45.1 donor and CD45.2 host cells from lung cMo and CD64+ cells from lethally irradiated, thorax-protected CD45.2 IMDTR mice reconstituted with CD45.1 BM wild-type cells, injected i.p. with DT and evaluated 2 days post-DT and 4 hours after EdU i.p. treatment by flow cytometry. c, Representative pictures of CD11bCD206hiMHC-IIKi67+ AMs, CD11b+CD206loMHC-IIhi IMs (CD206 IM), CD11b+CD206hiMHC-IIlo/int IMs (CD206 IM) and CD11b+CD206MHC-IIloKi67hi cells, identified by confocal microscopy on lung sections from untreated and DT-treated IMDTR mice, at day 2 post-DT. d, Representative histograms of EdU levels in lung extravascular CD64+ cells from DT-treated IMDTR mice that were treated with DT i.p. 3 days before, with the Csf1r antagonist PLX-3397 or with vehicle i.p. 1 and 2 days before, and with EdU i.p. 8 h before. e, Bar graph showing the % of EdU+ cells in lung extravascular CD64+ cells, as in d. Data are pooled from 2-3 independent experiments and show individual values (a) (n = 8 mice), or mean ± SEM (b,e) (b,e: n = 10,5-8 mice per group). P values were calculated using a two-way ANOVA with Tukey’s post hoc tests (b) or a two-tailed Student’s t test (e). Raw data and P values are provided as a source data file. **, P < 0.01; ****, P < 0.0001; ns, not significant. Scale bar: 10 µm. Source data
Extended Data Fig. 7
Extended Data Fig. 7. Lung CD64+ cells from Lyz2CreMafbfl/fl mice exhibit a higher proliferative potential as compared to those from littermate controls.
a, Representative histograms of Ki67 stainings within lung lung extravascular CD45+SSCloCD11b+F4/80+CD64 int/hi cells (CD64+ cells) from Lyz2CreMafbfl/fl and littermate controls. Insets indicate the % of Ki67+ cells within CD64+ cells. b, Bar graph showing the % of Ki67+ cells within lung CD64+ cells. Data show mean ± SEM and are pooled from 2 independent experiments (b) (n = 7 mice per group). P values were calculated using an unpaired two-tailed Mann-Whitney test. Raw data and P values are provided as a source data file. ***, P < 0.001. Source data
Extended Data Fig. 8
Extended Data Fig. 8. C-Maf specifically controls the identity of the CD206+ IM subset.
a, Heatmap plot depicting the DEG along pseudotime evaluated by tradeSeq in the subset-specific trajectories starting from cMo (middle) and ending in CD206 IM and CD206+ IM subsets. b, Gene expression of the indicated genes along pseudotime evaluated by tradeSeq in both trajectories leading either to CD206 IM or CD206+ IM subsets. c, Representative histograms of c-Maf protein expression in the indicated lung myeloid cell populations from wild-type mice. d, Bar graphs showing normalized MFI of c-Maf expression, as in c. P values compare bulk IMs vs. every other population, or CD206+ IMs vs. CD206 IMs. e, Efficiency of Maf depletion within lung IMs from Lyz2CreMaffl/fl mice evaluated by c-Maf protein intracellular staining. Data are representative of 5 mice, each of them giving similar results. f, Absolute numbers of lung cMo, pMo and IMs quantified by flow cytometry in Lyz2CreMaffl/fl and Maffl/fl mice. g, UMAP plot depicting the transcriptional identity of lung CD45+SSCloCD11b+F4/80+ CD64 monocytes and CD64+ cells from Lyz2CreMaffl/fl mice and littermate controls (n = 5 pooled mice per group). h, Histogram showing frequency of each cluster in Lyz2CreMaffl/fl and Maffl/fl mice. i, Volcano plot depicting the DEG between lung IMs (C3) from Lyz2CreMaffl/fl and Maffl/fl mice. Transcripts significantly upregulated in IMs from Maffl/fl and Lyz2CreMaffl/fl mice are colored in red and blue, respectively (log2 fold-change ± 0.5 and adjusted P value < 0.05). j, Surface expression of MerTK and CD206 in lung AMs and IMs, quantified by flow cytometry in Lyz2CreMaffl/fl and Maffl/fl mice. (d,f,j) Data show mean ± SEM and are pooled from 3 independent experiments (n = 9 mice per group) (d) or 2 independent experiments (n = 4-5 mice per group) (f,j). P values were calculated using a one-way ANOVA with Tukey’s post-hoc test (for bulk IMs) or a two-tailed Mann-Whitney test (for IM subsets), or a two- way ANOVA with Tukey’s post-hoc test (f,j). Raw data and P values are provided as a source data file. *, P < 0.05; ****, P < 0.0001; ns, not significant. Ab, antibody. Source data

Comment in

Similar articles

Cited by

References

    1. van Furth R, Cohn ZA. The origin and kinetics of mononuclear phagocytes. J. Exp. Med. 1968;128:415–435. doi: 10.1084/jem.128.3.415. - DOI - PMC - PubMed
    1. Ginhoux F, et al. Fate mapping analysis reveals that adult microglia derive from primitive macrophages. Science. 2010;330:841–845. doi: 10.1126/science.1194637. - DOI - PMC - PubMed
    1. Gomez Perdiguero E, et al. Tissue-resident macrophages originate from yolk-sac-derived erythro-myeloid progenitors. Nature. 2015;518:547–551. doi: 10.1038/nature13989. - DOI - PMC - PubMed
    1. Hashimoto D, et al. Tissue-resident macrophages self-maintain locally throughout adult life with minimal contribution from circulating monocytes. Immunity. 2013;38:792–804. doi: 10.1016/j.immuni.2013.04.004. - DOI - PMC - PubMed
    1. Yona S, et al. Fate mapping reveals origins and dynamics of monocytes and tissue macrophages under homeostasis. Immunity. 2013;38:79–91. doi: 10.1016/j.immuni.2012.12.001. - DOI - PMC - PubMed

Publication types

Substances