. 2023 Apr;24(4):714-728.
doi: 10.1038/s41590-023-01454-9. Epub 2023 Mar 16.

Novel mouse models based on intersectional genetics to identify and characterize plasmacytoid dendritic cells

Affiliations

Novel mouse models based on intersectional genetics to identify and characterize plasmacytoid dendritic cells

Michael Valente et al. Nat Immunol. 2023 Apr.

Abstract

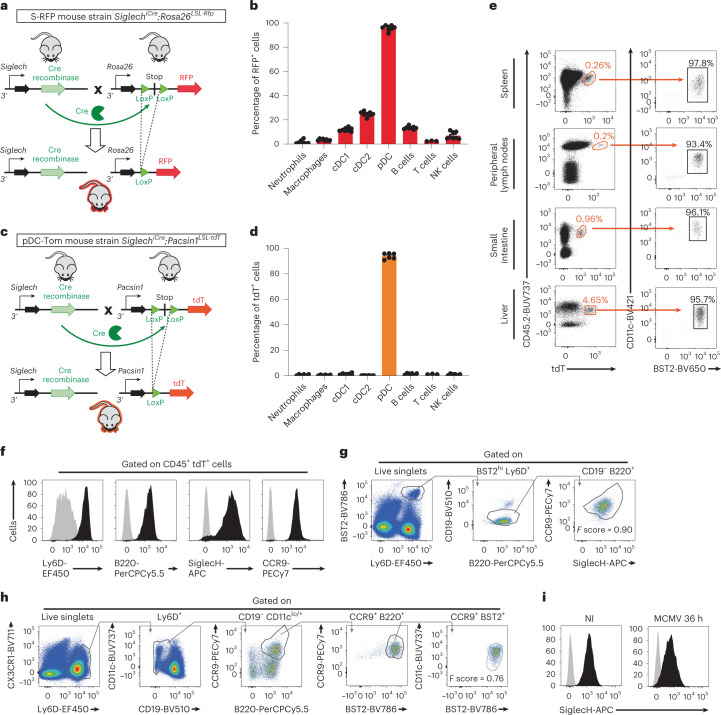
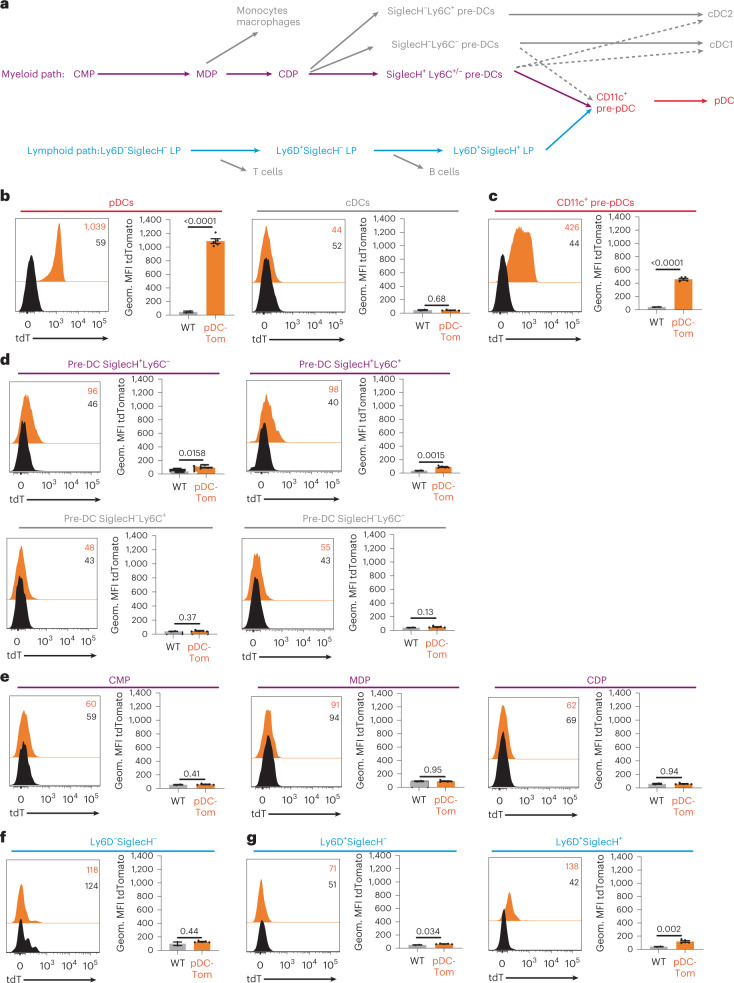
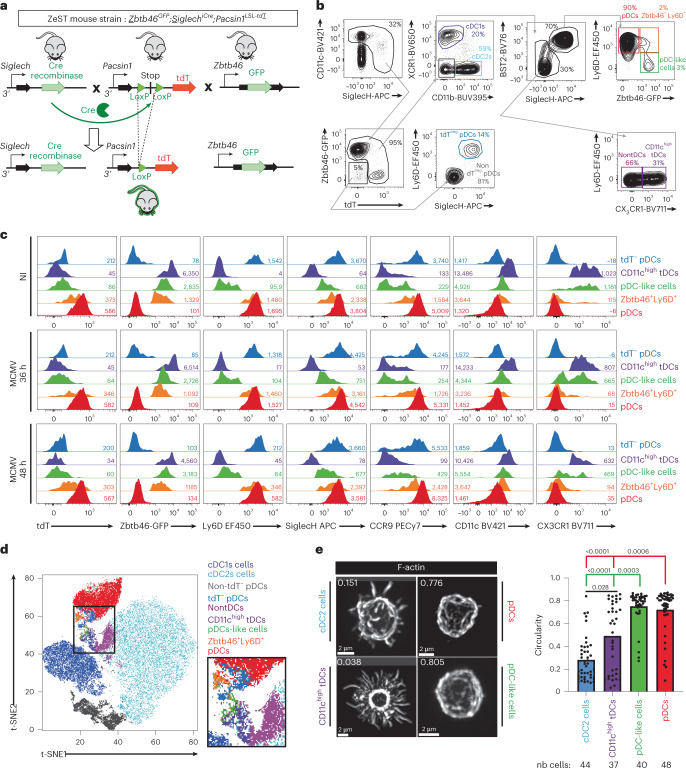
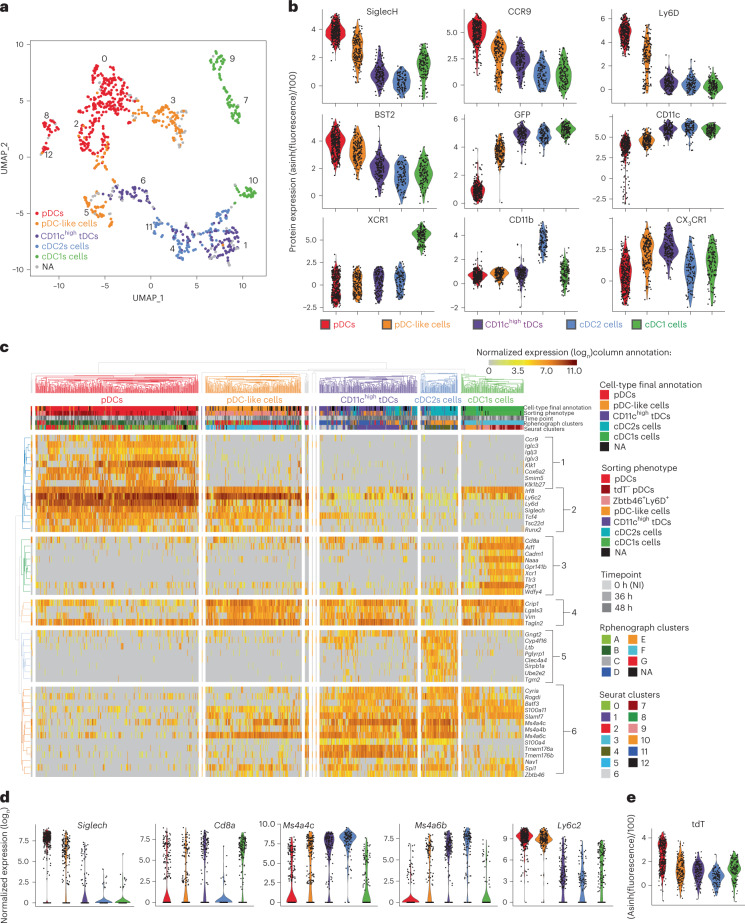
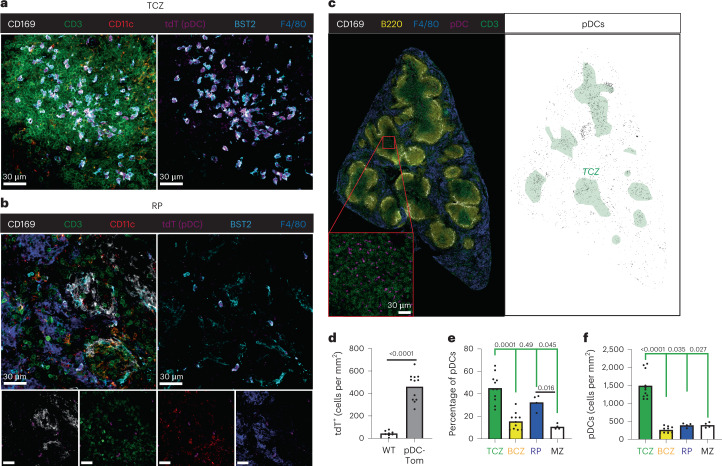
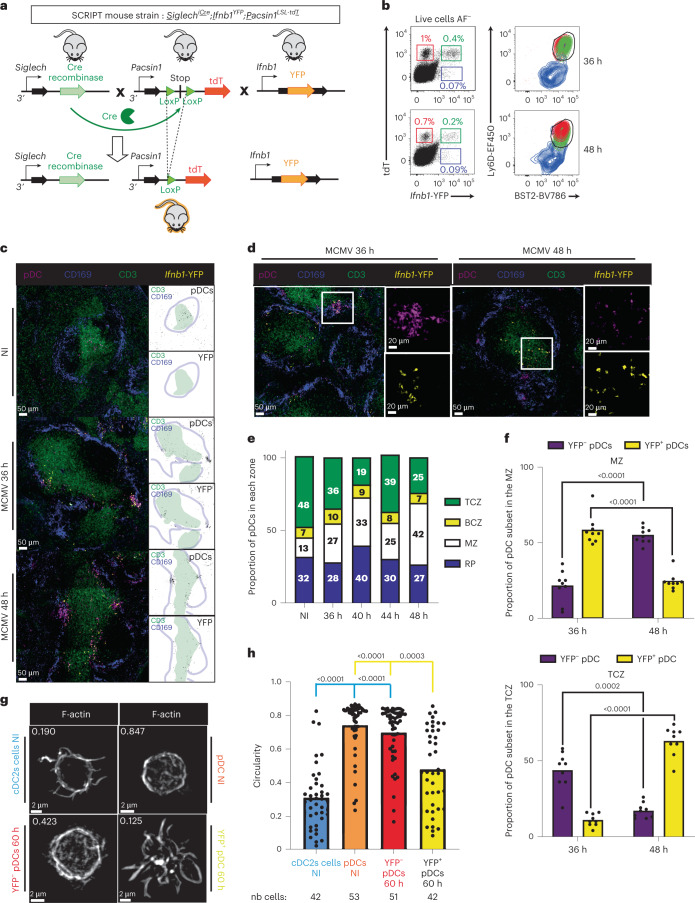
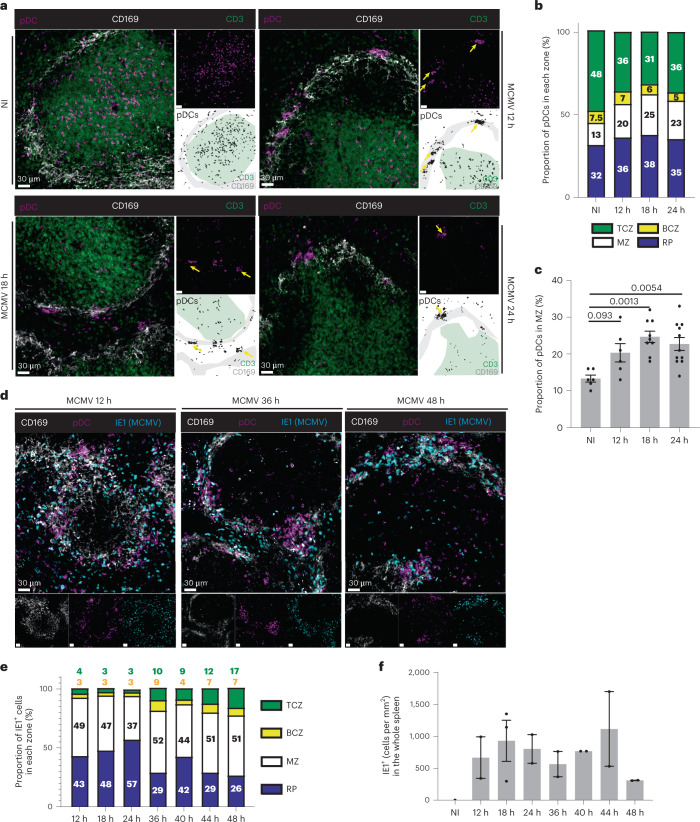
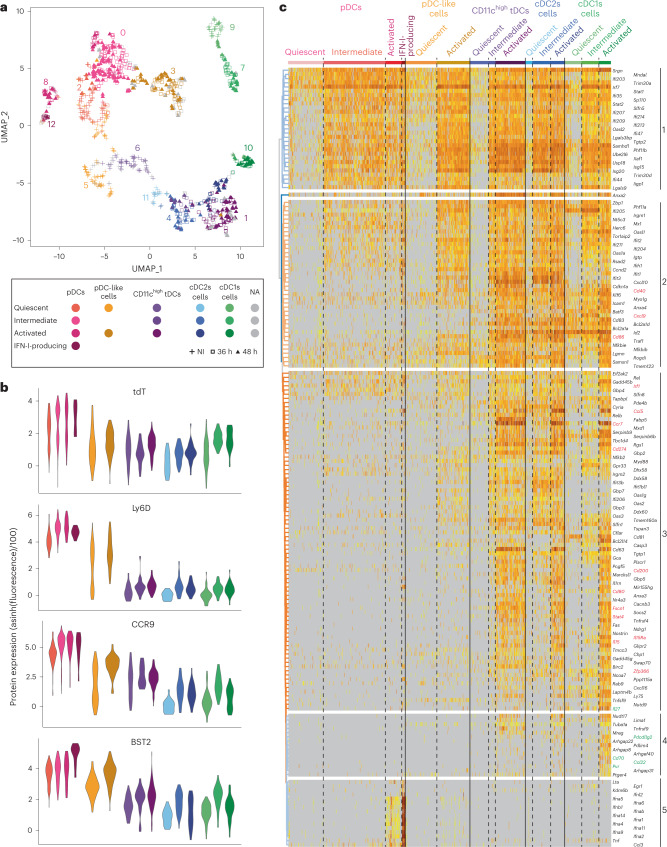
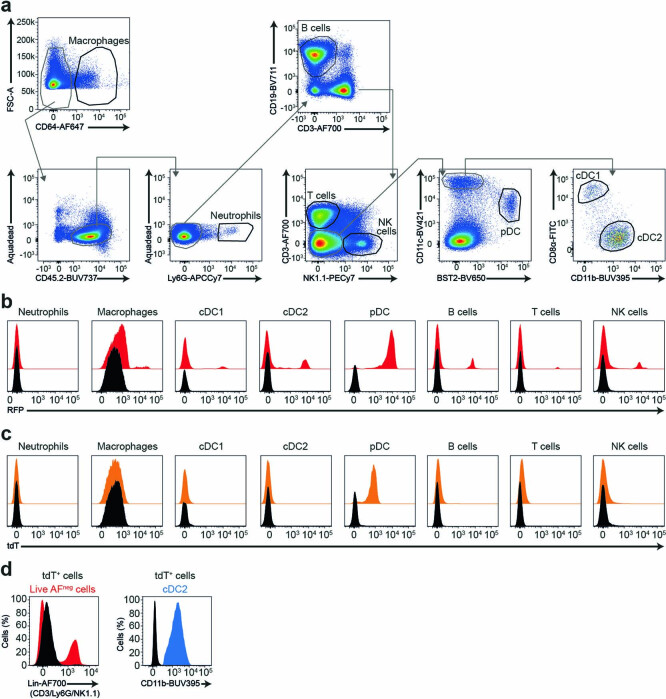
Plasmacytoid dendritic cells (pDCs) are the main source of type I interferon (IFN-I) during viral infections. Their other functions are debated, due to a lack of tools to identify and target them in vivo without affecting pDC-like cells and transitional DCs (tDCs), which harbor overlapping phenotypes and transcriptomes but a higher efficacy for T cell activation. In the present report, we present a reporter mouse, pDC-Tom, designed through intersectional genetics based on unique Siglech and Pacsin1 coexpression in pDCs. The pDC-Tom mice specifically tagged pDCs and, on breeding with Zbtb46GFP mice, enabled transcriptomic profiling of all splenic DC types, unraveling diverging activation of pDC-like cells versus tDCs during a viral infection. The pDC-Tom mice also revealed initially similar but later divergent microanatomical relocation of splenic IFN+ versus IFN- pDCs during infection. The mouse models and specific gene modules we report here will be useful to delineate the physiological functions of pDCs versus other DC types.


Conflict of interest statement

The authors declare no competing interests.

Figures

Fig. 1
Fig. 1. The pDC-Tom mice allow specific and unambiguous identification of pDCs in different organs.
a, Scheme illustrating the strategy followed to generate S-RFP mice. LoxP is the sequence recognized by Cre recombinase. ‘Stop’ corresponds to a transcriptional stop sequence. b, Splenocytes isolated from S-RFP mice were stained with fluorescently labeled antibodies to identify the indicated myeloid and lymphoid cell populations and analyzed for RFP expression by flow cytometry. The data shown (mean ± s.e.m.) are pooled from two independent experiments (n = 8). c, Scheme illustrating the strategy followed to generate pDC-Tom mice. d, Splenocytes isolated from pDC-Tom mice stained as in b to analyze tdT expression by flow cytometry. The data shown (mean ± s.e.m.) are pooled from two independent experiments (n = 6). e, Single-cell suspensions of indicated organs isolated from pDC-Tom mice stained with indicated fluorescent antibodies and analyzed by flow cytometry. f, Splenocytes from e analyzed for the expression of indicated markers on CD45+tdT+ cells. Gray histograms correspond to negative controls (fluorescence − 1). Black histograms correspond to the signal obtained on staining with the indicated antibody. For e and f, the data shown are from one mouse representing seven animals for the spleen and five animals for the peripheral lymph nodes (LNs), liver and small intestine. g,h, The HyperFinder plugin of the FlowJo software was applied to define an unsupervised gating strategy to identify pDCs from uninfected (g) or 36-h MCMV-infected (h) pDC-Tom mice. i, SiglecH expression (black histograms) shown on the pDCs as defined by the automated gating strategies computed for uninfected animals (g) or 36-h MCMV-infected mice (h). The negative controls (fluorescence − 1) are shown as gray histograms. Source data
Fig. 2
Fig. 2. Expression of tdT is detectable in late bone marrow precursors selectively committed to the pDC lineage.
a, Scheme of the previously proposed ontogenic paths for pDC differentiation along the myeloid (top, magenta) or lymphoid (bottom, cyan) lineages. Cells of these lineages diverging from the pDC main differentiation path are shown in gray. CD11c+ pre-pDCs and terminally differentiated pDCs, which are common to both paths, are shown in red. bg, Bone marrow cells isolated from pDC-Tom animals, stained with fluorescently labeled antibodies and analyzed by flow cytometry. The expression of tdT (orange histograms) was evaluated in bone marrow pDCs and cDCs (b), CD11c+ pre-pDCs (c) and different progenitors along the myeloid (d, pre-DC and e, early progenitors) or lymphoid (f, Ly6D progenitors, and g, Ly6D+ progenitors) ontogenic paths. C57BL/6 mice were used as negative controls (black histograms). WT, wild-type. The fluorescence histograms shown (left) are from one mouse representing five pDC-Tom animals from two independent experiments. The bar graphs (right) correspond to the results of all five animals, with data shown as mean ± s.e.m. Statistical analysis was by two-sided, unpaired Student’s t-test: *P < 0.05, **P < 0.01, ***P < 0.001, ****P < 0.0001. Geom., Geometric. Source data
Fig. 3
Fig. 3. ZeST mice allow unambiguous discrimination of pDCs from tDCs and pDC-like cells.
a, Strategy for generation of ZeST mice. b,c, Splenocytes from ZeST mice stained with fluorescently labeled antibodies and analyzed by flow cytometry. b, Gating strategy followed to identify cDC1s, cDC2s, CD11chigh tDCs, pDC-like cells, pDCs, Zbtb46+Ly6D+ cells and tdT pDCs. The first dot plot showing CD11c versus SiglecH expression was gated on singlets, live (LiveDead), nonautofluorescent, Lineage(CD19,CD3,Ly6G,NK1.1) cells. c, Expression of indicated fluorescent proteins or cell-surface markers on each of the cell populations gated as in b, from splenocyte suspensions from uninfected versus 36-h or 48-h MCMV-infected pDC-Tom mice. d, Projection of the cell types identified in b, according to the color key shown on the upper right of the panel, on the t-SNE space calculated for all cells expressing high levels of CD11c or positive for SiglecH. The data shown are from one ZeST mouse representing at least ten uninfected animals for bd and for seven MCMV-infected animals at 36 h p.i. or eight MCMV-infected animals at 48 h p.i. for c. e, Quantitative and unbiased assessment of the cellular morphology of cDC2s, tDCs, pDC-like cells and pDCs sorted from the spleen of uninfected ZeST mice according to the gating strategy shown in b. One representative confocal microscopy image of each DC type is shown on the left. The distribution of the circularity indices for individual cells across DC types is shown as dots on the right, with the overlaid color bars showing the mean circularity indices of each DC type. The data shown are from two independent experiments, each performed with one mouse, with 37–44 individual cells analyzed for each DC type, as shown below the graph. nb cells, number of indiviudal cells analyzed. The Kruskal–Wallis test was used for the statistical analysis: *P < 0.05, **P < 0.01, ***P < 0.001, ****P < 0.0001. Source data
Fig. 4
Fig. 4. ScRNA-seq confirmed proper identification of pDCs, pDC-like cells and tDCs in ZeST mice.
a, UMAP dimensionality reduction for DC types isolated from the spleens of eight ZeST mice (three uninfected, three MCMV infected for 36 h and two infected for 48 h; Extended Data Fig. 7a). Cells were index sorted into the five DC types studied (Fig. 3b) and used for scRNA-seq. As indicated by the color code, 851 individual cells were reassigned by deduction to a DC-type identity (cDC1s, cDC2s, pDCs, pDC-like cells or CD11chigh tDCs), based on combined analysis of their phenotypic and transcriptomic characteristics, as assessed, respectively, by Rphenograph clustering (Extended Data Fig. 7c) and Seurat clustering (numbers on the UMAP; Extended Data Fig. 7b), with confirmation via a single-cell enrichment analysis for DC-type-specific signatures generated from prior analysis of the cells from uninfected mice only (Extended Data Figs. 6 and 7); 100 cells were left nonannotated (NA). b, Violin plots showing expression of phenotypic markers across DC types. c, Heatmap showing messenger RNA expression levels of selected genes (rows) with hierarchical clustering using Euclidean distance, across all 951 cells (columns) annotated for (1) cell type final annotation as shown in a, (2) sorting phenotype, (3) time point after MCMV infection, (4) belonging to Rphenograph clusters and (5) belonging to Seurat clusters. Six gene groups are shown: (1) genes specifically expressed at high levels in pDCs, (2) genes with shared selective expression in pDCs and pDC-like cells, (3) cDC1-specific genes, (4) genes previously reported to be expressed at higher levels in pDC-like cells over pDCs, (5) cDC2-specific genes and (6) genes expressed selectively at higher levels in CD11chigh tDCs and cDC2 or cDC1 or pDC-like cells. d, Violin plots showing mRNA expression levels of selected genes across DC types. e, Violin plots showing tdT expression across DC types.
Fig. 5
Fig. 5. The pDC-Tom mice allow studying pDC microanatomical location in the spleen.
ac, Spleen cryosections, 20 μm, from steady-state pDC-Tom mice stained with anti-tdT (magenta), anti-CD169 (white), anti-CD3 (green) and anti-F4/80 (blue) antibodies, combined with anti-CD11c (red) and anti-BST-2 (cyan) antibodies (a, TCZ and b, RP) or an anti-B220 (yellow) antibody (c). Representative images of four sections from two animals are shown, for the TCZ (a), the RP (b) and the whole section (c), with the left panel corresponding to the raw signal and the right panel to the pDC mask used for quantification (black) relative to the location of the TCZ (green area, based on anti-CD3 staining). d, The number of tdT+ cells mm−2 of the whole spleen sections was quantified in pDC-Tom mice, in comparison to wild-type animals as background controls. The data shown are from eight whole sections from two C57BL/6 mice and 12 whole sections from three pDC-Tom mice. e,f, Microanatomical distribution of pDCs across the different areas of the spleen, namely the TCZ (CD3-rich region), BCZ (B220-rich region), RP (F4/80-rich area) and MZ (defined as the space between the CD169 staining and the F4/80 staining). e, Fraction of the pDC population present in each microanatomical area (calculated as the ratio between the pDC counts in the area and the total pDC counts in the whole section). f, The pDC density (cells mm−2) in each microanatomical area. The data shown are from 11 sections from three mice for TCZ and BCZ, and four sections from three mice for MZ and RP. The height of the colored boxes shows the mean value for each microanatomical area. One-way analysis of variance (ANOVA) was used for the statistical analysis, *P < 0.05, **P < 0.01, ***P < 0.001, ****P < 0.0001. Source data
Fig. 6
Fig. 6. Diverging intrasplenic migration patterns and morphological changes between the pDCs producing and those not producing IFN-I during MCMV infection.
a, Strategy for generating SCRIPT mice. b, Characterization by flow cytometry of Ifnb1-expressing splenocytes from SCRIPT mice at 36 h and 48 h after MCMV infection. Within live nonautofluorescent (AF) cells, pDCs were identified as producing IFN-I (YFP+tdT+, green boxes and contour plot) or not producing (YFPtdT+, red); other IFN-I producing cells were identified as tdTYFP+ (violet); their expression of Ly6D and BST2 was examined. cf, Spleen cryosections, 20 μm, from SCRIPT mice infected or not infected by MCMV stained with antibodies against indicated markers. c, The masks used for quantification shown on the right of the photographs, with pDCs in black, the TCZ in green and the MZ in blue. d, Representative images of a pDC cluster in the MZ at 36 h and of YFP+ pDCs in the TCZ at 48 h. e, Microanatomical distribution of splenic pDCs during MCMV infection. The data shown are from six animals for NI mice, nine for 36 h, seven for 40 h, eight for 44 h and nine for 48 h, with one whole spleen section analyzed per mouse. f, Fraction of YFP+ versus YFP pDCs in the MZ or TCZ. The data are from the same mice as in e. The height of the boxes shows the mean value. A two-sided Wilcoxon’s t-test was used for the statistical analysis: *P < 0.05, **P < 0.01. g,h, Quantitative assessment of the cellular morphology of YFP+ versus YFP pDCs from 60-h MCMV-infected SCRIPT mice, compared with pDCs and cDC2s from uninfected mice. g, One representative confocal microscopy image of each DC type. h, Distribution of the circularity indices for individual cells across DC types. The height of the boxes shows the mean value. The data shown are from 2 independent experiments each with 42–53 cells analyzed for each DC type from one mouse, as shown below the graph. The Kruskal–Wallis test was used for the statistical analysis: *P < 0.05, **P < 0.01, ***P < 0.001, ****P < 0.0001. Source data
Fig. 7
Fig. 7. Early during MCMV infection pDCs are recruited at the MZ where they contact infected cells.
af, Spleen cryosections, 20 μm, from pDC-Tom mice stained with anti-tdT (magenta), anti-CD169 (white) and anti-CD3 (green) antibodies (ac) or with anti-tdT (magenta), anti-CD169 (white) and anti-IE1 (cyan) antibodies (df). a, Representative images for NI or 12-h, 18-h and 24-h MCMV infection conditions. b, Microanatomical distribution of pDCs across the different areas of the spleen, during the course of MCMV infection. The data shown are from six animals for uninfected mice, six animals for 12 h, nine for 18 h and 11 for 24 h, with one whole spleen section analyzed per mouse. c, Quantification of the proportion of pDCs in the MZ. The data are shown as mean ± s.e.m. One-way ANOVA was used for the statistical analysis: *P < 0.05, **P < 0.01, ***P < 0.001, ****P < 0.0001. d, Representative images for 12-h, 36-h and 48-h MCMV infection conditions. e, Microanatomical distribution of IE1+ cells across the different areas of the spleen, during the course of MCMV infection. The data shown are from two animals for each time point analyzed, with one whole spleen section analyzed per mouse. f, Number of IE1+ cells mm−2 quantified in the whole spleen section. The data are shown as mean ± s.e.m. Source data
Fig. 8
Fig. 8. ScRNA-seq confirms the unique capacity of pDCs for high IFN-I/III expression during infection and shows divergent activation patterns for pDC-like cells and tDCs.
a, Projection of assigned DC type and activation states (color code) on to the UMAP space based on FB5P-seq gene expression for DC types isolated from the spleens of eight ZeST mice (three NI; three MCMV infected for 36 h and two infected for 48 h; see the key below the figure; Extended Data Fig. 7a). DC-type assignment is the same as in Fig. 4a. Seurat clusters are indicated on the UMAP (Extended Data Fig. 7b). Activation states were assigned based on mining of the marker genes of Seurat clusters (see Supplementary Table). b, Violin plots showing the expression of selected phenotypic markers across DC types and activation states. c, Heatmap showing mRNA expression levels of selected genes (rows) across all 951 individual cells (columns), with hierarchical clustering of genes using Euclidean distance, and ordering of individual cells (column) according to their assignment into cell types and activation states using the same color code (top) as in a. The color scale for gene expression levels is the same as in Fig. 4c.
Extended Data Fig. 1
Extended Data Fig. 1. Expression of RFP and tdT in different immune lineages in S-RFP and pDC-Tom mice.
a, Gating strategy used for the identification of the different immune cell types studied. b, c, Splenocytes were isolated from S-RFP (b) or pDC-Tom (c) animals, stained with fluorescently labeled antibodies and analyzed by flow cytometry. The expression of RFP (b, red histograms) or tdT (c, orange histograms) was evaluated in different immune cell types as indicated. d, The expression of Lineage cocktail antibodies and CD11b was assessed on tdT+ cells and compared to Live non-autofluorescent cells (Red) (Lineage, left panel) or cDC2 (Blue) (CD11b, right panel). C57BL/6 mice were used as negative controls (black histograms). The data shown are from one mouse representative of 8 animals for (b) and 6 animals for (c, d) from 2 independent experiments.
Extended Data Fig. 2
Extended Data Fig. 2. Gating strategy for bone marrow precursor analysis of pDC-Tom mice.
Bone marrow cells were isolated from pDC-Tom animals, stained with fluorescently labeled antibodies and analyzed by flow cytometry. The gating strategy used to identify myeloid progenitors (a) or lymphoid progenitors (b) is depicted. The data shown are from one mouse representative of 5 pDC-Tom animals from 2 independent experiments.
Extended Data Fig. 3
Extended Data Fig. 3. The phenotype and the proportions of Zbtb46+ Ly6D+ cells, CD11chigh tDC and pDC-like cells are relatively stable during MCMV infection.
Splenocytes from ZeST mice were stained with fluorescently labeled antibodies and analyzed by flow cytometry. Representative contour plots from uninfected animals (a-c), MCMV-infected mice at 36 h p.i (d-f) and from MCMV-infected mice at 48 p.i (g-i). The data shown are from one ZeST mouse representative of at least 10 uninfected animals (a-c), and for 7 MCMV-infected animals at 36 h p.i (d-f) or 8 MCMV-infected animals at 48 h p.i. (g-i).
Extended Data Fig. 4
Extended Data Fig. 4. Spectral flow cytometry-based unsupervised characterization of the expression pattern of tdT and GFP in splenocytes of ZeST mice.
a, Unsupervised dimensional reduction, and cell clustering, for the analysis by spectral flow cytometry of the expression of surface markers on CD45+ splenocytes from ZeST mice and one control C57BL/6 mouse, without considering tdT and GFP signals. The UMAP was calculated for all samples together, with downsampling to 200,000 CD45+ cells/sample, and is shown for each infection time point with individual mice pooled together (ZeST not infected, n = 2; 36 h, n = 4; 48 h, n = 3; control C57BL/6 mouse, not infected, n = 1). The cluster color code represents related cell types in similar colors (lower right, see also panel b). b, Cell cluster annotation for cell type identities, based on cell surface marker expression. The mean fluorescence intensity (MFI) of each cluster for each marker was calculated by averaging cluster MFI values across the 10 mice analyzed, and used for hierarchical clustering (heatmap). The corresponding expression patterns were then used to assign cell cluster to indicated cell types. c, Percent of each cluster within GFP+ cells, shown first as mean percent of each cluster within GFP+ cells across all ZeST mice, and then for each mouse. The color code of the clusters is the same as in (a, b) and their ordering in each pie chart shown in the color key (lower right). d, GFP MFI (mean on scaled data, Y-axis) for each ZeST mouse (one dot per mouse) and each cluster (X-axis, with same color code and ordering as in (a, c, d). For each cluster, the mean ± SEM of the MFI across all ZeST mice is shown as the black lines. For comparison, the autofluorescent signal in the GFP channel in each cell cluster in the C57BL/6 mouse is shown as a black square. e, Percent of each cluster within tdT+ cells, designed as in (c). f, tdT MFI for each cluster and each ZeST mouse, designed as in (d). The data shown are from one experiment representative of two independent ones. Source data
Extended Data Fig. 5
Extended Data Fig. 5. Spectral flow cytometry-based supervised analysis of the expression of tdTomato and GFP in splenocytes of ZeST mice.
a, Gating strategy followed to identify the indicated lymphoid vs myeloid cell populations. Splenocytes were isolated from uninfected or MCMV-infected ZeST mice. Cells were previously gated as CD45+ after exclusion of dead cells and doublets. b, c, The expression of CD11c (b), GFP (c) and of CD26 vs CD64 (d) was analyzed on Ly6C+ tDC cells (orange), Ly6Cneg tDC (purple) and CD26neg Ly6Cneg cells gated as shown in (a). e, CD11chigh tDC (purple) and pDC-like cells (green) were gated from the spectral flow cytometry dataset according to the strategy used with the initial regular flow cytometry dataset (as shown in Fig. 3b), and then analyzed for CD26 vs Ly6C expression, for comparison with the gating strategy used to identify Ly6Cneg tDC and Ly6C+ tDC (panel a). f, Analysis of the expression of GFP vs the indicated cell markers upon gating on Ly6Dneg CX3CR1neg cells. g, Percentages (mean ± SD) of GFP+ cells (top) or tdT+ cells (bottom) in indicated cell populations gated as shown in (a). For (a) and (f), the analysis shown is representative one ZeST mouse out of 9 tested. For (b-e) n = 2 for NI, n = 4 for MCMV 36 h and n = 3 for MCMV 48 h. Source data
Extended Data Fig. 6
Extended Data Fig. 6. Analysis of the FB5P-seq data for cells from uninfected mice to generate DC type-specific signatures for helping annotation of the total FB5P-seq dataset.
a, UMAP dimensionality reduction of the gene expression data for DC types isolated from the spleen of 3 uninfected ZeST mice. Cells were index sorted into the 5 DC types studied (see Fig. 3b), and used for single cell RNA sequencing. After quality controls, 343 cells were kept for the analysis. The color code indicates belonging of the cells to the 7 Seurat clusters obtained. b, Projection onto the UMAP space of the phenotype of cells based on their belonging to the Rphenograph clusters (color code) obtained upon re-analysis of the fluorescent signals for 10 of the phenotypic markers acquired during index sorting as listed in panel c. c, Annotation of the Rphenograph clusters for DC type identity based on mean fluorescent intensities per marker and cluster as shown on the heatmap. d, Number of cells belonging to the intersections between Seurat (rows) and Rphenograph (column) clusters. Seurat clusters were annotated for cell types based on analysis of their marker genes (see Supplementary Table). e, Heatmap showing sgCMAP scores of individual cells (rows) for DC type-specific signatures (columns) generated from published independent RNA-seq datasets. Hierarchical clustering was performed, using the Pearson’s minus one metric for signatures (columns), and the Euclidian distance for individual cells (rows), with annotation of individual cells (rows) for i) belonging to Seurat clusters, ii) belonging to Rphenograph clusters, iii) sorting phenotype, and iv) final cell type assignment. 205 cells were assigned a cell type identity based on consistency between their belonging to Seurat and Rphenograph clusters (panel d) and their sgCMAP scores. 138 cells were left non-annotated (NA). f, Projection onto the UMAP space of the final cell type assignment.
Extended Data Fig. 7
Extended Data Fig. 7. Analysis of the FB5P-seq data for all cells from uninfected and infected mice.
a, UMAP dimensionality reduction of the gene expression data for DC types isolated from the spleens of eight ZeST mice (3 uninfected, 3 MCMV-infected for 36 h and 2 infected for 48 h, see graphical legend). Cells were index sorted into the 5 DC types studied (see Fig. 3b), and used for single cell RNA sequencing. After quality controls, 951 cells were kept for the analysis. b, Projection onto the UMAP space of the 13 Seurat clusters obtained (see graphical legend). c, Projection onto the UMAP space of the phenotype of cells based on their belonging to the Rphenograph clusters (color code) obtained upon re-analysis of the fluorescent signals for 10 of the phenotypic markers acquired during index sorting as listed in panel d. d, Annotation of the Rphenograph clusters for DC type identity based on mean fluorescent intensities per marker and cluster as shown on the heatmap. e, Number of cells belonging to the intersections between Seurat (rows) and Rphenograp (column) clusters. Seurat clusters were annotated for cell types based on analysis of their marker genes (see Supplementary Table 2). f, Heatmap showing sgCMAP scores of individual cells (rows) for the DC type-specific sgCMAP signatures (columns) generated from the analysis of the data focused on cells from uninfected mice (see Extended Data Fig. 6). Hierarchical clustering was performed, using the Pearson’s minus one metric for signatures (columns), and the Euclidian distance for individual cells (rows), with annotation of individual cells (rows) for i) belonging to Seurat clusters, ii) belonging to Rphenograph clusters, iii) sorting phenotype, and iv) final cell type assignment. 851 cells were assigned a cell type identity based on consistency between their belonging to Seurat and Rphenograph clusters (panel e), which was well corroborated by the sgCMAP scores. 100 cells were left non-annotated (NA).
Extended Data Fig. 8
Extended Data Fig. 8. pDC-Tom mice allow to determine pDC micro-anatomical location in the different organs.
20μm organ cryosections from uninfected pDC-Tom mice were stained with anti-tdT (magenta), anti-CD169 (white), anti-CD3 (green), anti-CD11c (red) and anti-BST2 (cyan) antibodies (a) or with anti-tdT (magenta), anti-Epcam (white), anti-CD3 (green) and anti-B220 (cyan) antibodies (b-d). Representative images are shown for LN of 3 mice (a), small intestine of 4 mice (b, c) and colon of 3 mice (d).
Extended Data Fig. 9
Extended Data Fig. 9. Circularity indices for cDC1 and cDC2 upon MCMV infection.
a, b, Quantitative and unbiased assessment of the cellular morphology of cDC1 and cDC2 isolated from 60 h MCMV-infected SCRIPT mice, as compared to cDC1 and cDC2 from uninfected mice. a, One representative confocal microscopy image of each DC type is shown. b, The distribution of the circularity indices for individual cells across DC types is shown as dots, with the overlaid color bars showing the mean circularity indices of each DC type. The data shown are from 2 independent experiments, each performed with one mouse, with 35 to 46 individual cells analyzed for each DC type as indicated below the graph. The data are shown as mean ± SEM. Source data
Extended Data Fig. 10
Extended Data Fig. 10. Expression of selected phenotypic markers and genes across DC types and activation states.
a, Violin plots showing the expression of phenotypic markers across DC types and activation states. b, Violin plot showing expression of the Xcr1 gene across DC types and activation states. c, Violin plots showing mRNA expression levels of selected genes across DC types and activation states. d, Mini-bulk qRT-PCR analysis of the expression level of control (Siglech and Xcr1) and new candidate marker genes (Tmem176a, Tmem176b and Apod) across DC types and activation states. e,Violin plots showing mRNA expression levels of Il18 and Il12b across DC types and activation states. Source data

Comment in

References

    1. Tomasello E, Pollet E, Vu Manh TP, Uze G, Dalod M. Harnessing mechanistic knowledge on beneficial versus deleterious IFN-I effects to design innovative immunotherapies targeting cytokine activity to specific cell types. Front. Immunol. 2014;5:526. doi: 10.3389/fimmu.2014.00526. - DOI - PMC - PubMed
    1. King C, Sprent J. Dual nature of type I Interferons in SARS-CoV-2-induced inflammation. Trends Immunol. 2021;42:312–322. doi: 10.1016/j.it.2021.02.003. - DOI - PMC - PubMed
    1. Reizis B. Plasmacytoid dendritic cells: development, regulation, and function. Immunity. 2019;50:37–50. doi: 10.1016/j.immuni.2018.12.027. - DOI - PMC - PubMed
    1. Rodrigues PF, et al. Distinct progenitor lineages contribute to the heterogeneity of plasmacytoid dendritic cells. Nat. Immunol. 2018;19:711–722. doi: 10.1038/s41590-018-0136-9. - DOI - PMC - PubMed
    1. Dress RJ, et al. Plasmacytoid dendritic cells develop from Ly6D+ lymphoid progenitors distinct from the myeloid lineage. Nat. Immunol. 2019;20:852–864. doi: 10.1038/s41590-019-0420-3. - DOI - PubMed

Publication types

Substances