. 2023 Apr;55(4):607-618.
doi: 10.1038/s41588-023-01321-1. Epub 2023 Mar 16.

Multiomic analysis of malignant pleural mesothelioma identifies molecular axes and specialized tumor profiles driving intertumor heterogeneity

Lise Mangiante #  1   2 Nicolas Alcala #  1 Alexandra Sexton-Oates #  1 Alex Di Genova #  1   3   4 Abel Gonzalez-Perez  5   6 Azhar Khandekar  7 Erik N Bergstrom  7 Jaehee Kim  8   9 Xiran Liu  8 Ricardo Blazquez-Encinas  10   11   12   13 Colin Giacobi  1 Nolwenn Le Stang  14 Sandrine Boyault  15 Cyrille Cuenin  16 Severine Tabone-Eglinger  14 Francesca Damiola  14 Catherine Voegele  1 Maude Ardin  17 Marie-Cecile Michallet  17 Lorraine Soudade  1 Tiffany M Delhomme  1   5 Arnaud Poret  1 Marie Brevet  18 Marie-Christine Copin  19 Sophie Giusiano-Courcambeck  20 Diane Damotte  21   22 Cecile Girard  23 Veronique Hofman  24 Paul Hofman  24 Jérôme Mouroux  25 Charlotte Cohen  26 Stephanie Lacomme  27 Julien Mazieres  28 Vincent Thomas de Montpreville  29 Corinne Perrin  30 Gaetane Planchard  31 Nathalie Rousseau  31 Isabelle Rouquette  32 Christine Sagan  23 Arnaud Scherpereel  33 Francoise Thivolet  30 Jean-Michel Vignaud  34   35 Didier Jean  36 Anabelle Gilg Soit Ilg  37 Robert Olaso  38 Vincent Meyer  38 Anne Boland-Auge  38 Jean-Francois Deleuze  38 Janine Altmuller  39 Peter Nuernberg  39 Alejandro Ibáñez-Costa  10   11   12   13 Justo P Castaño  10   11   12   13 Sylvie Lantuejoul  14   40 Akram Ghantous  16 Charles Maussion  41 Pierre Courtiol  41 Hector Hernandez-Vargas  42   43 Christophe Caux  17 Nicolas Girard  44   45 Nuria Lopez-Bigas  5   6   46 Ludmil B Alexandrov  7 Françoise Galateau-Salle  14 Matthieu Foll  47 Lynnette Fernandez-Cuesta  48
Affiliations

Multiomic analysis of malignant pleural mesothelioma identifies molecular axes and specialized tumor profiles driving intertumor heterogeneity

Lise Mangiante et al. Nat Genet. 2023 Apr.

Abstract

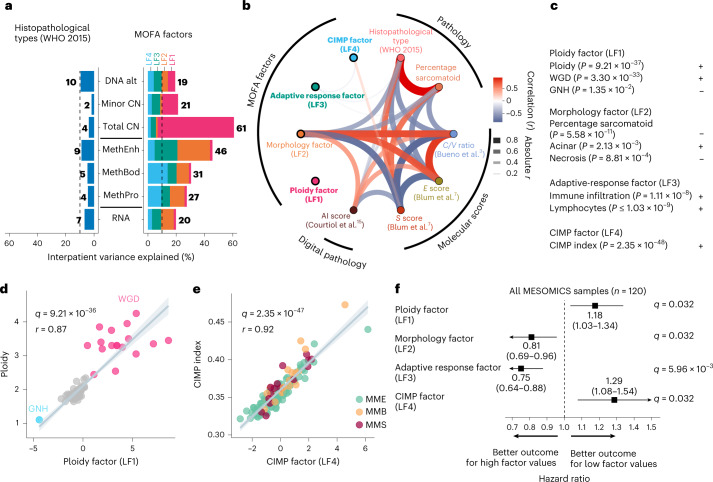
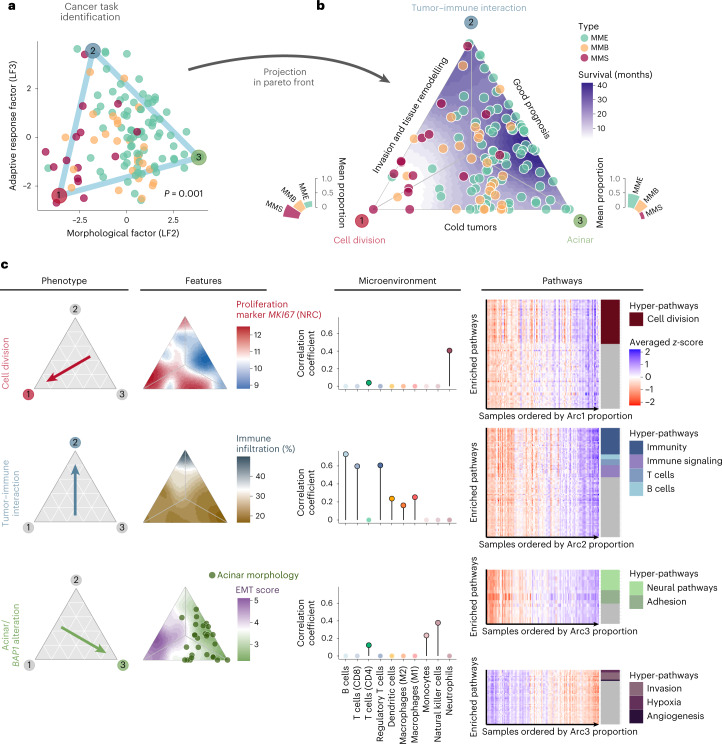
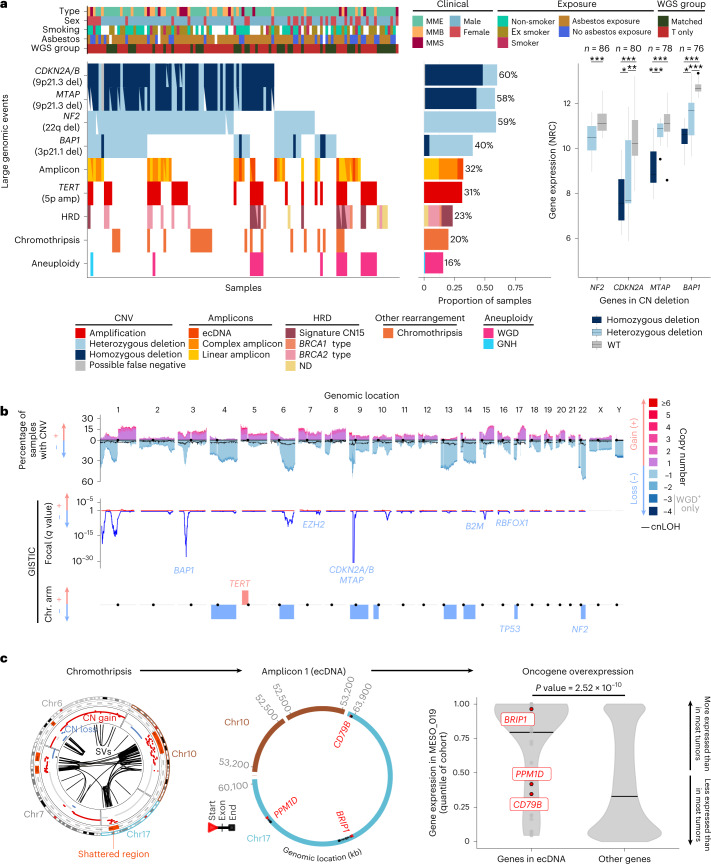
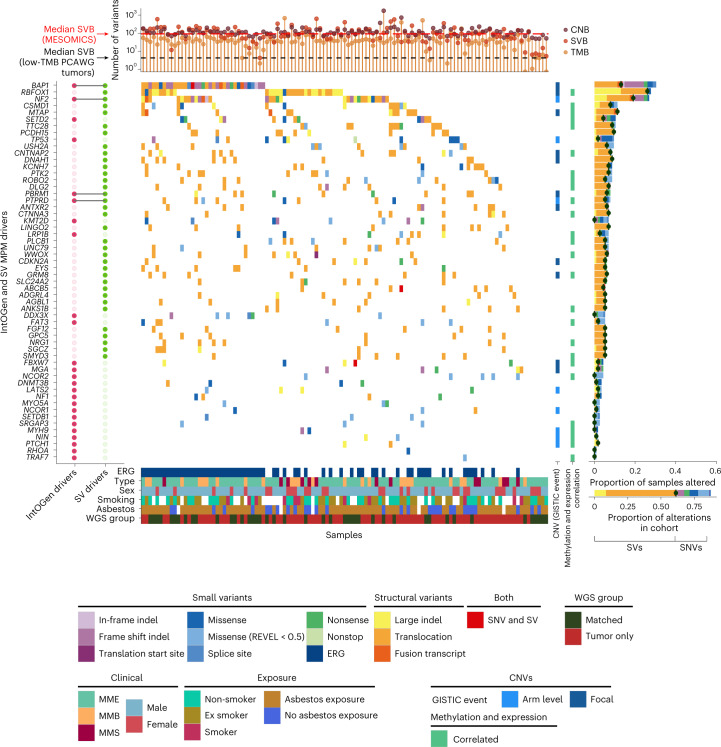
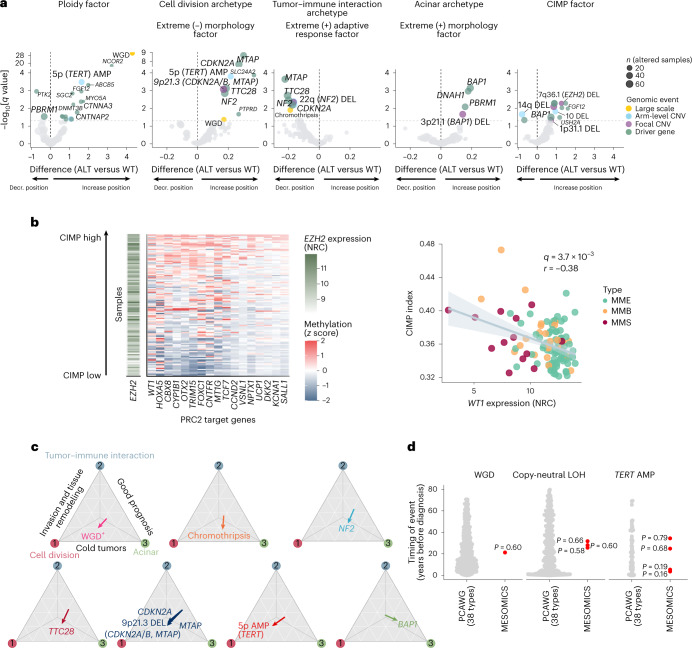
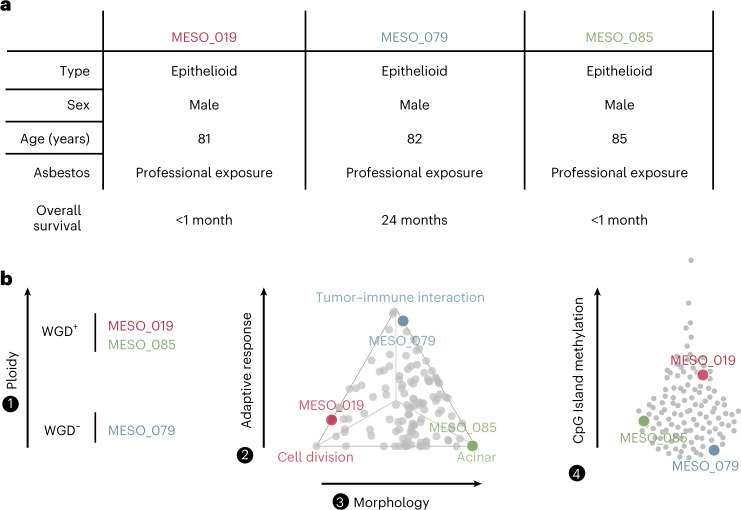
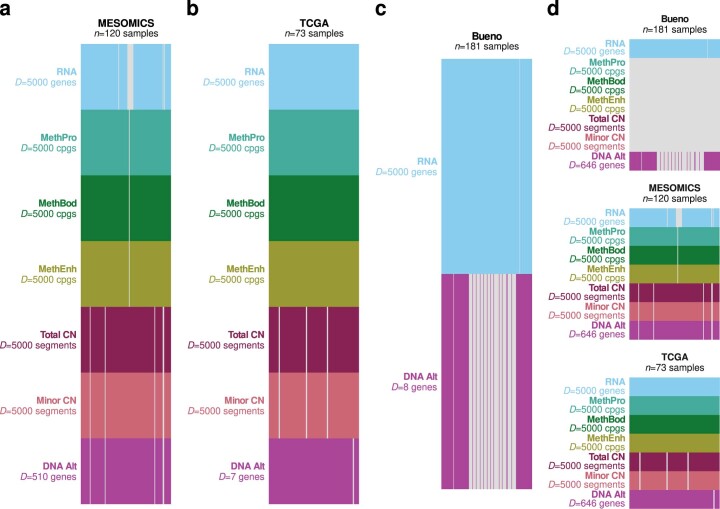
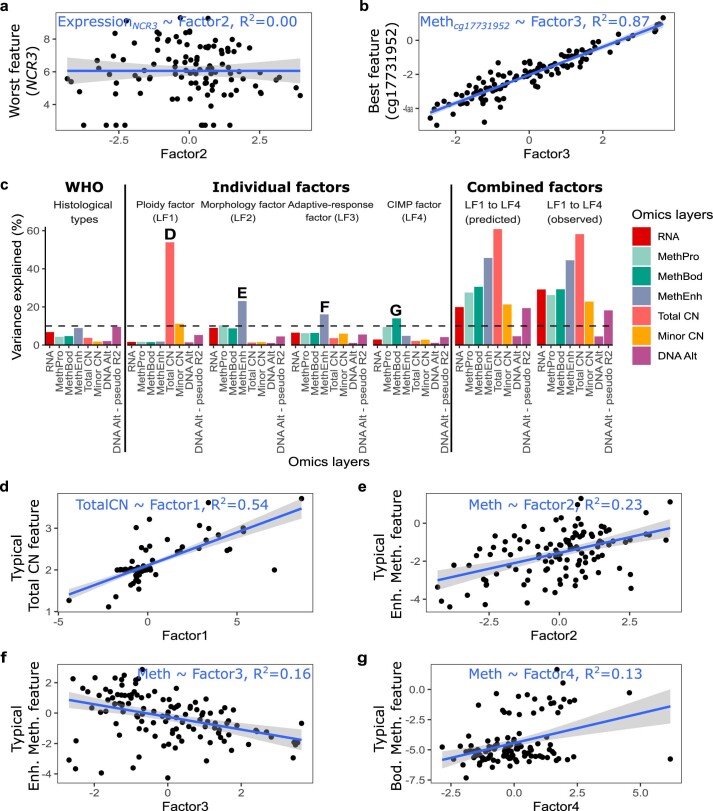
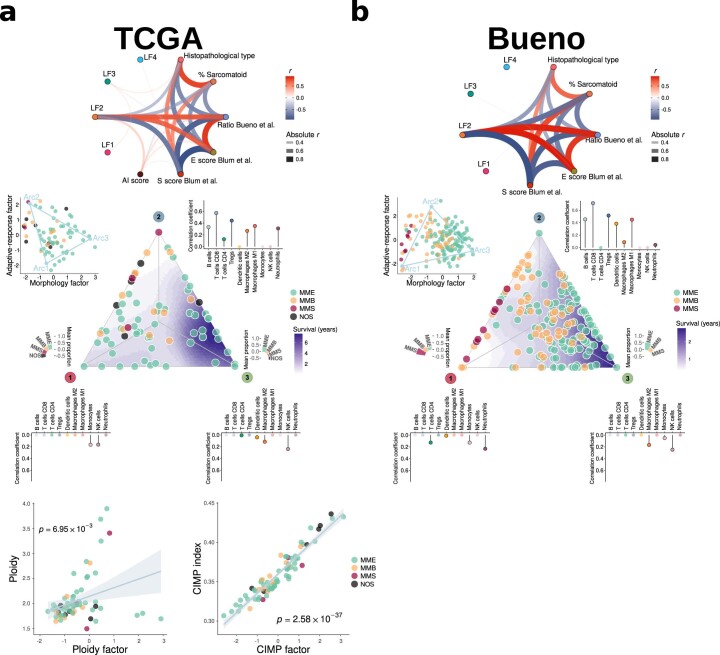
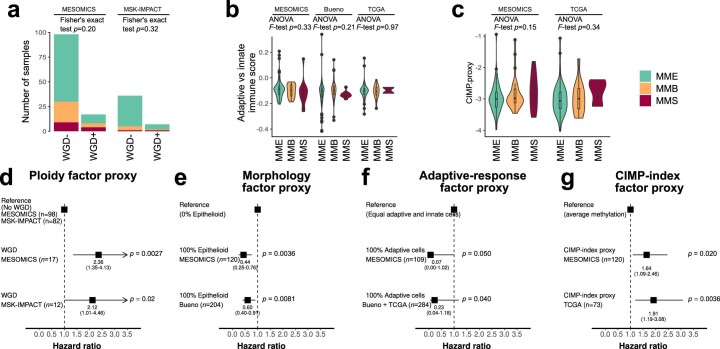
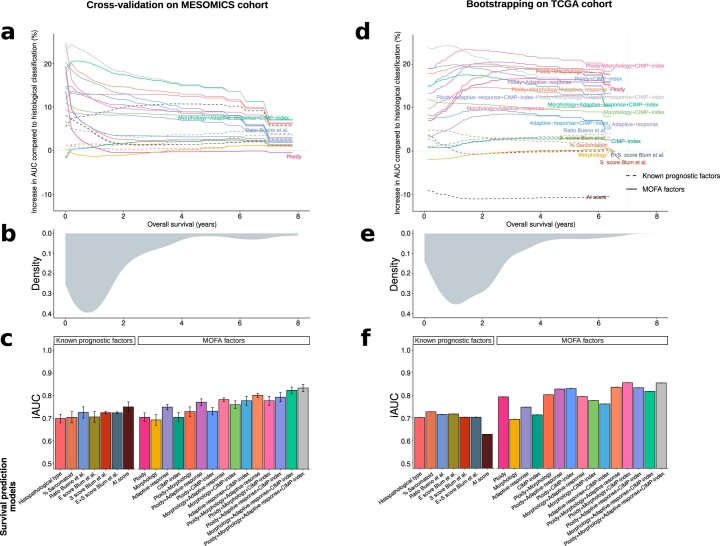
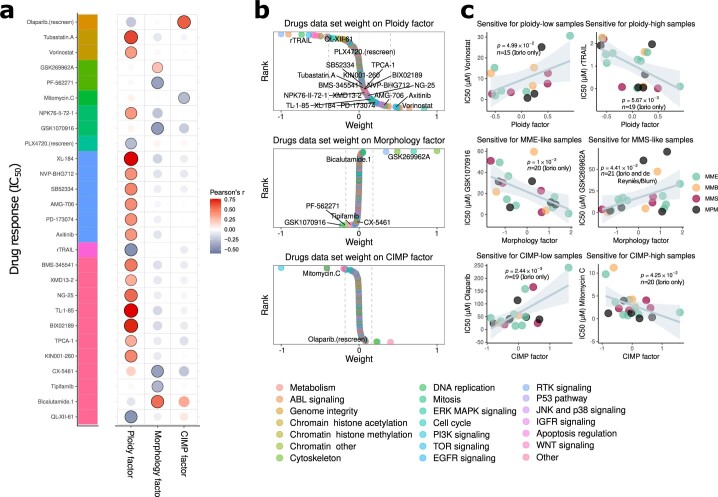
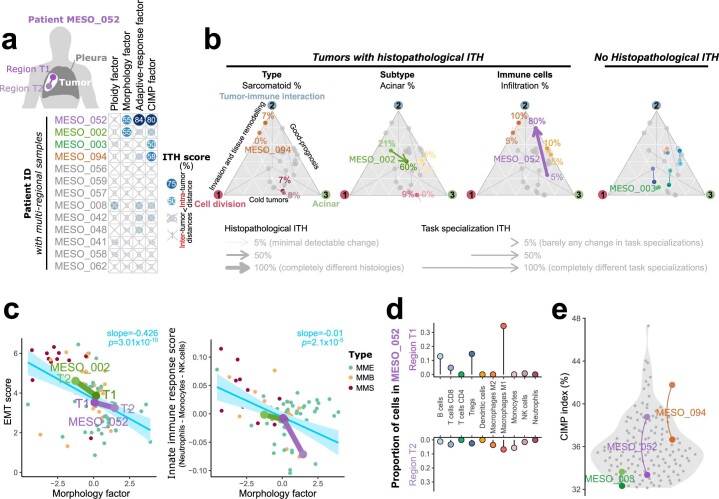
Malignant pleural mesothelioma (MPM) is an aggressive cancer with rising incidence and challenging clinical management. Through a large series of whole-genome sequencing data, integrated with transcriptomic and epigenomic data using multiomics factor analysis, we demonstrate that the current World Health Organization classification only accounts for up to 10% of interpatient molecular differences. Instead, the MESOMICS project paves the way for a morphomolecular classification of MPM based on four dimensions: ploidy, tumor cell morphology, adaptive immune response and CpG island methylator profile. We show that these four dimensions are complementary, capture major interpatient molecular differences and are delimited by extreme phenotypes that-in the case of the interdependent tumor cell morphology and adapted immune response-reflect tumor specialization. These findings unearth the interplay between MPM functional biology and its genomic history, and provide insights into the variations observed in the clinical behavior of patients with MPM.


Conflict of interest statement

Where authors are identified as personnel of the IARC/WHO, the authors alone are responsible for the views expressed in this article and they do not necessarily represent the decisions, policy or views of the IARC/WHO. Where authors are identified as personnel of the Centre de Recherche en Cancérologie de Lyon, the authors declare no competing interests. A.S. participated in expert boards and clinical trials with AstraZeneca, Bristol-Myers Squibb, MSD and Roche. N.G. declares consultancy for and research support from Bristol-Myers Squibb, AstraZeneca, Roche and MSD. S Lantuejoul declares research support from AstraZeneca, Sanofi, Bristol-Myers Squibb, Janssen and Eli Lilly and has participated in expert boards for MSD and Bristol-Myers Squibb. D.D. declares research support from AstraZeneca. J. Mazieres declares consultancy for and research support from Roche, AstraZeneca, Bristol-Myers Squibb, MSD and Pierre Fabre. M.B. declares consultancy for and research support from AstraZeneca, Bristol-Myers Squibb and Amgen. I.R. participated in expert boards for AstraZeneca, MSD and Bristol-Myers Squibb. L.B.A. is a compensated consultant and has equity interest in io9. His spouse is an employee of Biotheranostics. L.B.A. is also an inventor on a US patent (10,776,718) relating to source identification by non-negative matrix factorization. E.N.B. and L.B.A. declare US provisional patent applications with the serial numbers 63/289,601 and 63/269,033. L.B.A. declares US provisional patent applications with the serial numbers 63/366,392, 63/367,846 and 63/412,835. C.M. is employed by and has equity interest in Owkin. C.M., P.C. and F.G.-S. are inventors on the US patent 17185924 ‘Systems and methods for mesothelioma feature detection and enhanced prognosis or response to treatment’. All other authors declare no competing interests.

Figures

Fig. 1
Fig. 1. MOFA of whole genomes, transcriptomes and methylomes of the MESOMICS cohort (n = 120).
a, Proportion of interpatient variance within a molecular layer explained by WHO-defined histopathological type (left) and MOFA latent factors 1–4 (right). For example, 7% of variation present in RNA expression can be explained by mesothelioma types, in contrast with 20% explained by integrative MOFA. CN, segmental copy number; DNA alt, rearrangements and mutations; MethBod, DNA methylation level at body regions; MethEnh, DNA methylation level at enhancer regions; MethPro, DNA methylation level at promoter regions; RNA, gene expression level. b, Network of the correlations between latent factors, tumor histopathology and previously published molecular scores. The arc colors, widths and transparency correspond to Pearson correlation coefficients. Features uncorrelated with any other features are highlighted in bold. AI, artificial intelligence; C/V ratio, log2 ratio of CLDN15 to VIM gene expression; S score, sarcomatoid gene expression score; E score, epithelioid gene expression score. c, Interpretation of MOFA latent factors. Plus signs indicate positive correlations and minus signs indicate negative correlations. d, Correlation between the ploidy factor (LF1) and ploidy. e, Correlation between the CIMP factor (LF4) and CIMP index. The samples are colored by histological type. f, Forest plot of the hazard ratios of MOFA latent factors for overall survival. The squares correspond to estimated hazard ratios and the segments correspond to their 95% confidence intervals. In be, P values, q values and r coefficients were determined by two-sided Pearson correlation tests. In d and e, the gray bands represent 95% confidence intervals. Source data
Fig. 2
Fig. 2. Cancer task inference from the morphology and adaptive response factors (n = 120).
a, Sample positions along the morphological (LF2) and adaptive response factors (LF3) are contained within a triangle formed by three phenotypic archetypes (colored vertices). The P value corresponds to a one-sided test from the Pareto fit. b, Ternary plot representing the sample’s distance from the three specialized profiles. The bar plots represent the association between archetypes and histopathological types. c, Summary table of the main phenotypes, features and overexpressed pathways (columns) identified in each profile (rows). Left, arrows indicate the focal profile of each row. Middle left, ternary plots with a color-filled background representing key features for each profile. NRC, normalized read count. Middle right, lollipop plots presenting the correlation between RNA-seq-estimated immune cell infiltration and the proportion of archetypes. Right, expression heatmaps of cancer tasks inferred from each phenotype. The rows represent enriched pathways and the columns represent the samples, ordered by increasing phenotype proportion. The heatmap color scale corresponds to the averaged z score of each gene set. The colored tiles on the right annotate the gene sets that belong to the hyper-pathways inferred from each phenotype. Source data
Fig. 3
Fig. 3. Genomic characterization of MPM from the MESOMICS cohort.
a, Recurrent large genomic events. Top, clinical, epidemiological, morphological and technical features per sample. T only represents samples with WGS on the tumor sample only. Bottom left, oncoplot describing the genomic events per sample. amp, amplification; del, deletion; ND, HRD type not determined. Bottom middle, barplot of the frequency of each event within the cohort. Bottom right, comparison of the gene expression of cancer-relevant genes belonging to frequent deletions detected by GISTIC, with regards to their copy number (CN) status. Wild-type (WT) cases correspond to samples without copy number, structural variant or single-nucleotide variant events detected. The box plots represent the median and interquantile range and the whiskers the maximum and minimum values, excluding outliers. The n number above represents the number of biologically independent samples for each test. *0.01 < q value ≤ 0.05; **0.001 < q value ≤ 0.01; ***q value ≤ 0.001. NRC, normalized read count. b, Cohort-level copy number profile (top), with significantly altered regions identified by GISTIC in focal peaks (middle) and at the chromosome (chr.) arm level (bottom). cnLOH, copy-neutral LOH. c, Data from a patient with oncogene amplification due to a chromothripsis event (MESO_019). Left, chromosomes involved in the chromothripsis event (outer circle, shattered regions; intermediate circle, copy number gain and loss; inner circle, structural variants (SVs)). Middle, reconstructed ecDNA structure. Right, gene expression in MESO_019 relative to the expression in other tumors of the cohort (quantile). Oncogenes found within the ecDNA region are represented in red. The P value was determined by two-sided Wilcoxon rank-sum test. kb, kilobases. Source data
Fig. 4
Fig. 4. MPM driver genes in the MESOMICS cohort.
Top, tumor mutational burden (TMB), number of segments or copy number burden (CNB) and structural variant burden (SVB) of each sample. Main, oncoplot describing genomic alterations in IntOGen and structural variant MPM driver genes per sample. These genomic events can co-occur with copy number changes. Large indels and translocations refer to structural variant events detected by structural variant callers while fusion transcripts are detected at the transcriptomic level. Each gene is also annotated as belonging to one focal or arm-level GISTIC event, as well as for being regulated by DNA methylation (right bars). Right, frequency of alterations within the cohort. For each gene, the dark green dot represents the frequency of structural variants. In the legend, ERG indicates whether the sample has one or more alteration in an ERG. Key clinical, epidemiological, morphological and technical features are given for each sample. PCAWG, Pan-Cancer Analysis of Whole Genomes; SNV, single-nucleotide variant; SV, structural variant. Source data
Fig. 5
Fig. 5. Impact of genomic events on MPM molecular profiles.
a, Association between genomic events and MOFA factors. For each event, the ALT (altered) versus wild-type difference corresponds to the difference between the mean factor value of wild-type samples and that of altered samples. The q values correspond to an adjusted analysis of variance P value; the dashed horizontal line represents the q value threshold of 0.05. AMP, amplification; Decr., decrease; DEL, deletion. b, Association between CIMP index, EZH2 expression (n = 109 samples) and PRC2 target gene methylation (n = 119 samples). Left, heatmap of EZH2 gene expression (NRC) and CpG island methylation (z score) of PRC2 target genes whose methylation level was significantly positively correlated with CIMP index (q < 0.05), for samples ordered by CIMP index. Right: correlation between WT1 expression and CIMP index. The q value was determined by Pearson correlation test and the gray band corresponds to the 95% confidence interval. c, Effect vector of key alterations affecting specialization in the tumor tasks from Fig. 2. The effect vector corresponds to the difference in position on the Pareto front between the centroid of altered samples and the centroid of wild-type samples. d, Comparison of the timing of large-scale amplifications in the MESOMICS and PCAWG cohorts. The points represent estimates of the timing of genomic events. The empirical P values (red data points) were determined by one-sided outlier tests. Source data
Fig. 6
Fig. 6. Added value of the four-factor molecular classification in understanding intertumor heterogeneity in three example patients.
a, Patients MESO_019, MESO_079 and MESO_085 had nearly identical clinical characteristics. b, The three patients had vastly different profiles based on our four-factor morphomolecular classification: different WGD status (left), opposite positions on the Pareto front (middle) and variable levels of CpG island methylation (right). Source data
Extended Data Fig. 1
Extended Data Fig. 1. Overview of the MPM datasets for multiomic integration with MOFA.
Overview of the omic data sets integrated into multiomics factor analyses (MOFAs), for (a) a MOFA of the MESOMICS cohort (n = 120), (b) MOFA of the TCGA cohort (n = 73), (c) MOFA of the Bueno cohort (n = 181), and (d) MOFA of the 3 cohorts (n = 120 + 73 + 181). D is the number of integrated omic features from genomic (rearrangements and mutations within DNA Alt; allele-specific copy number (CN) in Total CN and Minor CN), transcriptomic (RNA), and epigenomic data at promoter (MethPro), gene body (MethBod), and enhancer regions (MethEnh). Source data
Extended Data Fig. 2
Extended Data Fig. 2. Proportion of interpatient variance explained by MOFA latent factors.
a) Example feature for which a latent factor explains 0% of interpatient variance (here factor 2 explains no variance at all in the expression of gene NCR3R2 = 0). b) Example feature for which a latent factor explains most of the variance (here factor 3 explains 87% of the variance of methylation site cg17731952R2 = 0.87). c) Variance explained by the three histopathological types, each latent factor (LF) independently, predicted total variance explained by all latent factors together if they were completely independent (LF1 to LF4 predicted), and actual variance explained by a model including the four latent factors as covariables (LF1 to LF4 observed). CIMP: CpG island methylator phenotype. d) Typical Total copy number (CN) feature associated with Factor 1. e) Typical Enhancer Methylation feature associated with Factor 2. f) Typical Enhancer Methylation feature associated with Factor 3. g) Typical Gene Body Methylation feature associated with Factor 4. In (a)-(b) and (d)-(g), the gray band corresponds to 95% confidence intervals. Source data
Extended Data Fig. 3
Extended Data Fig. 3. Replication of MOFAs latent factors and tumor tasks in major MPM cohorts.
MESOMICS MOFA latent factors and tumor task replicated in the TCGA (a) and Bueno (b) cohorts. The gray band corresponds to 95% confidence intervals. In (a), P values correspond to Pearson correlation tests (n = 73). MME: epithelioid; MMB: biphasic; MMS: sarcomatoid; NOS: malignant pleural mesothelioma not otherwise specified. Source data
Extended Data Fig. 4
Extended Data Fig. 4. Replication of the prognostic value of MOFAs latent factors in other MPM cohorts.
a)-(c) Association between histological types and proxies for the MOFA latent factors. a) Association between whole genome-doubling (WGD) status and histological types in the MESOMICS and MSK-IMPACT cohorts, as determined by Fisher’s exact tests. b) Association between the Adaptive versus innate response score and histological types, in the MESOMICS (n = 120) and Bueno (n = 211) and TCGA (n = 73) cohorts, as determined by ANOVA tests. c) Association between the CIMP-index proxy computed on a five-gene panel and histological types in the MESOMICS and TCGA cohorts, as determined by ANOVA tests. d)-(g) Forest plots of hazard ratios for overall survival showing the replication of latent factors’ prognostic value, using a Cox proportional hazards model. In (b)-(c), boxplots represent the median and interquantile range and whiskers the maximum and minimum values, excluding outliers. d) WGD status (proxy for the ploidy factor) in the MESOMICS and MSK-IMPACT cohorts. e) Percentage of epithelioid estimated by pathologists from H&E slides (proxy for the morphology factor) in the MESOMICS and Bueno cohorts. f) Adaptive versus innate response score (proxy for the adaptive-response factor), in the MESOMICS and Bueno and TCGA cohorts, computed as the difference between the proportion of lymphocyte B and T-cells minus the proportion of macrophages, monocytes, and neutrophils, estimated from gene expression data (quanTIseq software). g) CIMP-index proxy computed on a five-gene panel (proxy for the CIMP-index factor), in the MESOMICS and TCGA cohorts. In all panels, P values indicate the significance of tests. In (d)-(g), squares correspond to estimated hazard ratios and segments to their 95% confidence intervals; tests in the MESOMICS cohort (discovery) are two-sided while tests in validation cohorts (MSK-IMPACT, TCGA, or Bueno cohorts) are one-sided, in the direction found in the discovery cohort. Source data
Extended Data Fig. 5
Extended Data Fig. 5. Performance of MOFA factors to predict survival.
a) Increase in area under the curve (AUC) as a function of percentage of change compared to histological classification. b) Density of survival time within the MESOMICS cohort. c) Integral AUC (iAUC) of twenty-two Cox proportional hazards survival models based on: (i) the three histopathological types (MME, MMB, and MMS); (ii) the proportion of sarcomatoid content; (iii) the log2 ratio of CLDN15/VIM (C/V) expression proposed by Bueno and colleagues; (iv), (v) and (vi) the E score, S score, and combining both scores from Blum and colleagues, respectively; (vii) an Artificial Intelligence (AI) prognostic score; (viii-xi) the one-dimensional summary of molecular data using LFs as a continuous variable; (xii-xvii), the two-dimensional summary of molecular data using either each combination of 2 LFs as continuous variables, respectively; (xviii-xxi), the three-dimensional summary of molecular data using each combination of 3 LFs as continuous variables; and (xxii), the four-dimensional summary of molecular data using all 4 LFs. Bars represent the mean values and error bars their standard error. Panels (a-c) present the out-of-sample accuracy within the MESOMICS cohort (4-fold cross-validation on n = 120 individuals), while (d-f) present the out-of-sample accuracy within the TCGA cohort (2000 bootstraps on n = 73 individuals). The model fit accuracy (no split between training and test sets) on MESOMICS and TCGA cohort are presented in Supplementary Table 17. Source data
Extended Data Fig. 6
Extended Data Fig. 6. MOFA LFs of MPM cell lines and drug response.
a) Correlations between drug responses (measured by half maximal inhibitory concentration, IC50 in μM) and MOFA LFs of cell lines. Significant associations are annotated by black point border. b) Distribution of drug response weights from the Drugs data set, with drugs for which the response is significantly correlated with the given LF annotated in black. Targeted pathways are represented in (a) by a color bar (left), and in (b) by point colors. c) Correlations between representative drug responses significantly correlated with MOFA LFs from cell lines (left: negative correlations, right: positive associations). MPM: malignant pleural mesothelioma not otherwise specified. Gray bands correspond to 95% confidence intervals. Pearson correlation coefficients and the associated two-sided P values are displayed in (a) and (c). Source data
Extended Data Fig. 7
Extended Data Fig. 7. Tumor burden of mutational signatures.
Tumor Mutational Burden of a) 7 copy number signatures (n = 115 biologically independent samples) and b) 10 Single Nucleotide Variant Signatures detected in the MESOMICS cohort (n = 46 biologically independent samples). Note that although SBS40 is associated with age in many cancers, its etiology is still unknown. TDP: tandem duplicator phenotype; HRD: homologous recombination deficiency; fLOH: focal loss of heterozygosity; CIN: chromosomal instability. c) Comparison of the tumor mutation burden (TMB, in number of mutations) of APOBEC signatures SBS2 and 13 in the MESOMICS cohort and in more than 2000 tumors from the Pan-Cancer Analysis of Whole Genomes (PCAWG) cohort. d) Comparison of the Relative TMB in number of somatic mutations of age-related signatures SBS1, SBS5, and SBS40, with that of APOBEC signatures SBS2 and 13 in the MESOMICS (red) and PCAWG cohorts (black). Source data
Extended Data Fig. 8
Extended Data Fig. 8. Test of the impact of genomic events on cancer task specialization.
a) Alignment of vectors with the Pareto front in degree (0°: perfectly aligned, 90°: completely orthogonal) and (b) length of the vector. P values correspond to two-sided Wilcoxon tests between observed and shuffled vector distributions. Source data
Extended Data Fig. 9
Extended Data Fig. 9. Multiomics intra-tumor heterogeneity (ITH) of 13 multiregion samples.
a) Intratumoral heterogeneity (ITH) score, ranging from 0% (no ITH) to 100% (ITH greater than the maximum observed intertumor heterogeneity in the cohort), for each sample (row) and each MOFA latent factor (column). The score is computed as the percentage of inter-tumor distances in a MOFA factor that are lower than the observed intratumor distance between regions. The four samples with ITH score greater than 50% are highlighted in color. b) Relationship between histopathological heterogeneity and cancer task specialization. Ternary plots depicting task specialization in three cancer tasks (see Fig. 2). For each histopathological feature, a colored arrow connects regions from tumors with differences in this feature. Numbers correspond to the percentage of this feature in the tumor as estimated by our pathologist. The right ternary plot represents all samples with no histopathological ITH. c) Epithelial to mesenchymal transition (EMT) score and innate immune composition score as a function of MOFA’s Morphology factor. Small points correspond to all samples from the MESOMICS cohort, and large points connected by segments to regions from the 3 patients with CIMP factor ITH highlighted in (a). Blue bands correspond to 95% confidence intervals, and P values to two-sided t-tests. d) Lollipop plot of the estimated proportion of immune cells in two regions of a sample with ITH in the adaptive-response factor highlighted in (a). e) CIMP index in regions of two tumors with substantial ITH in the CIMP factor highlighted in (a) (colored points connected by an arc), compared to that of the rest of the cohort (grey points). Source data
Extended Data Fig. 10
Extended Data Fig. 10. Association between MOFA latent factors and the clusters identified by consensus clustering (a-d) and integrative clustering (e-h).
a) Kruskal-Wallis rank sum test significance (P value) between each K (row) and the LFs (column), for K from 2 to 5 from consensus clustering results and the first four LFs. b) Kruskal-Wallis rank sum test significance (P value) between each K (row) and the LFs (column), for K from 2 to 5 from integrative clustering results and the first four LFs. c) Consensus clustering results for K = 3. Samples are visualized in MOFA latent factor space of LF2 vs. LF3 and colored by the consensus clustering results. d) Integrative clustering results for K = 4. Samples are visualized in MOFA latent factor space of LF2 vs. LF3 and colored by the integrative clustering results. On the right, we show the samples in one-dimensional space of LF1 using beeswarm plot. e) Consensus clustering results for K = 4. f) Integrative clustering results for K = 5. Samples are visualized in MOFA latent factor space of LF2 vs. LF3 and colored by the integrative clustering results. On the right, we show the samples in one-dimensional space of LF1 and LF4 using beeswarm plot. g) Top-left: average silhouette width for consensus clustering with different K. Bottom-left: proportion of samples below the selected silhouette width threshold for consensus clustering with different K. Right: consensus matrix heatmap for K = 3. Color gradient represents consensus values from 0–1. h) Top-left: average silhouette width for integrative clustering with different K. Bottom-left: proportion of samples below the selected silhouette width threshold for integrative clustering with different K. Right: heatmap of the frequencies of samples being clustered together among all clustering results using the set of iClusterPlus lambda values for K = 4. Color gradient represents consensus values from 0–1. Source data

References

    1. Carbone M, et al. Mesothelioma: scientific clues for prevention, diagnosis, and therapy. CA Cancer J. Clin. 2019;69:402–429. doi: 10.3322/caac.21572. - DOI - PMC - PubMed
    1. WHO Classification of Tumours, Thoracic Tumours (5th edn) (International Agency for Research on Cancer, 2020).
    1. Bueno R, et al. Comprehensive genomic analysis of malignant pleural mesothelioma identifies recurrent mutations, gene fusions and splicing alterations. Nat. Genet. 2016;48:407–416. doi: 10.1038/ng.3520. - DOI - PubMed
    1. Hmeljak J, et al. Integrative molecular characterization of malignant pleural mesothelioma. Cancer Discov. 2018;8:1548–1565. doi: 10.1158/2159-8290.CD-18-0804. - DOI - PMC - PubMed
    1. De Reyniès A, et al. Molecular classification of malignant pleural mesothelioma: identification of a poor prognosis subgroup linked to the epithelial-to-mesenchymal transition. Clin. Cancer Res. 2014;20:1323–1334. doi: 10.1158/1078-0432.CCR-13-2429. - DOI - PubMed

Publication types

Substances